National balance sheet and financial flow accounts, second quarter 2015
Archived Content
Information identified as archived is provided for reference, research or recordkeeping purposes. It is not subject to the Government of Canada Web Standards and has not been altered or updated since it was archived. Please "contact us" to request a format other than those available.
Released: 2015-09-11
National net worth
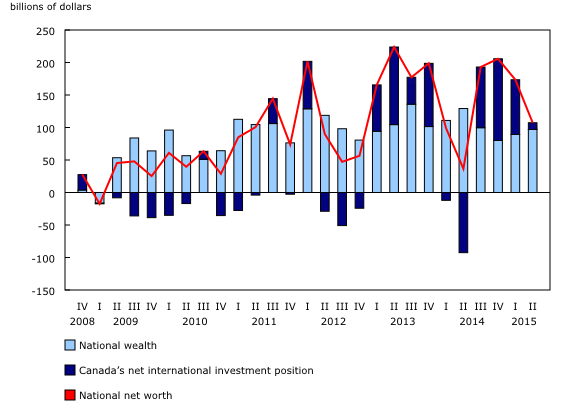
National net worth rose 1.3% or $107.3 billion from the first quarter to reach $8,545 billion by the end of the second quarter. On a per capita basis, national net worth grew 0.9% to $238,200.
National wealth, or the total value of non-financial assets in the Canadian economy, increased $97.0 billion to reach $8,314 billion at the end of the second quarter. This was principally due to growth in the value of residential real estate (+1.6%) and consumer durables (+3.1%) such as vehicles.
Canada's net international investment position edged up $10.4 billion in the second quarter to reach a net asset position of $231.7 billion. This was the fourth consecutive quarterly increase in the net asset position, despite ongoing balance of payments current account deficits.
Households
Household sector net worth at market value was up 0.9% in the second quarter, the slowest pace since the second quarter of 2013. On a per capita basis, household net worth advanced to $243,800. Non-financial assets, primarily real estate, rose 1.8% while net financial assets edged down 0.1%, as the value of financial liabilities increased more than financial assets.
The value of financial assets edged up 0.5% in the second quarter following a 4.6% increase in the first quarter. Growth in mutual fund and pension assets was muted in the second quarter after strong gains in the previous quarter. This was coupled with a decline in the value of equities as domestic markets weakened. The increase in financial assets was more than offset by a 1.8% gain in financial liabilities, notably mortgages. The ratio of financial assets to non-financial assets shed some of its first quarter gains, declining to 124.4% in the second quarter.
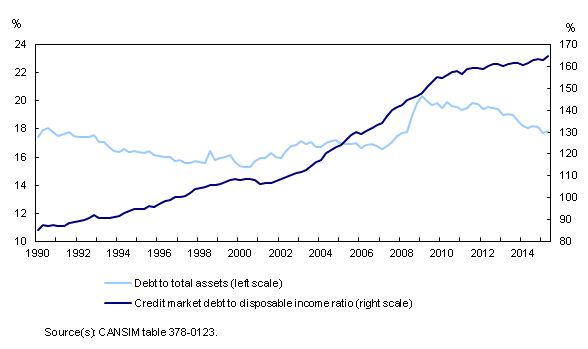
The ratio of total household debt to total assets was up slightly in the second quarter, reaching 17.9%. Since 2009, this ratio has been on a general downward trend, as the growth in the value of assets has outpaced debt, but has not yet returned to pre-recession levels.
On a seasonally adjusted basis, households borrowed $26.3 billion in the second quarter, up $3.7 billion from the first quarter. Mortgages represented the largest portion of total borrowing in the quarter ($17.7 billion), up $2.3 billion from the previous quarter, while consumer credit accounted for $4.0 billion of borrowing.
Total household credit market debt (consumer credit, and mortgage and non-mortgage loans) reached $1,874 billion at the end of the second quarter, up 1.8% from the previous quarter. Consumer credit debt was $526.3 billion, while mortgage debt stood at $1,219 billion.
Leverage, as measured by household credit market debt to disposable income, rose from 163.0% in the first quarter to 164.6% in the second quarter. In other words, there was $1.65 in credit market debt for every dollar of disposable income. Disposable income (+0.8%) increased at a slower pace than household credit market debt (+1.8%).
The household debt service ratio, measured as total obligated payments of principal and interest as a proportion of disposable income, was up slightly from the first quarter to reach 14.1% in the second quarter. This was higher than the historical average of 12.4% for the 1990 to 2015 period. In the prevailing low interest rate environment, the interest-only debt service ratio, defined as household mortgage and non-mortgage interest paid as a proportion of disposable income, continued at historic lows (6.3%).
Government sector
The federal government was a net lender of $4.0 billion in the second quarter. Other levels of government continued to be net borrowers ($16.5 billion). The federal government recorded net issuances of Canadian short-term paper ($6.5 billion) in the second quarter, which were partially offset by net retirements of bonds and debentures of $1.9 billion. Other levels of government recorded $2.8 billion in net retirements of bonds and debentures in the second quarter, which was outweighed by $17.3 billion in net issuances of Canadian short-term paper.
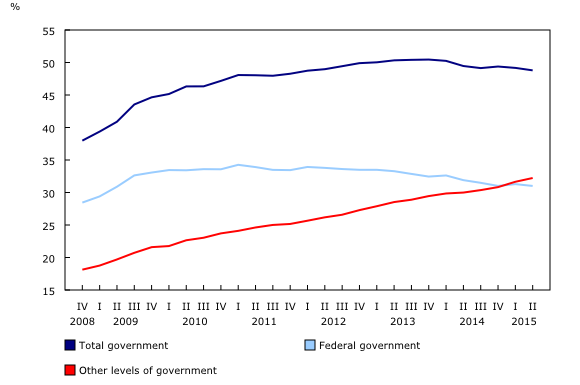
The ratio of federal government net debt (expressed at book value) to gross domestic product declined from 31.3% in the first quarter to 31.0% in the second quarter. The ratio for other levels of government reached 32.2% in the second quarter, continuing the upward trend that began in late 2008, and exceeding the ratio of federal government for a second straight quarter.
Corporate sector
Financial corporations
The financial sector provided $65.5 billion of funds to the economy, compared with $39.7 billion in the second quarter a year earlier. This was principally in the form of mortgages ($25.0 billion) and bonds and debentures ($14.4 billion).
Financial assets of financial corporations were largely unchanged at the end of the second quarter ($11,292 billion), as increased loan assets were offset by declines in the value of bonds and debentures and equities. However, the value of financial liabilities decreased $67.5 billion.
After posting strong first quarter growth (+7.8%), total financial assets of mutual funds rose 1.3% in the second quarter.
Non-financial corporations
Non-financial private corporations raised $15.8 billion worth of funds in financial markets during the second quarter. This was the lowest level of borrowing since the fourth quarter of 2012 and was mainly in the form of non-mortgage loans ($7.6 billion). Borrowing in the form of bonds and debentures was $2.1 billion in the second quarter, down from $22.1 billion in the first quarter.
The value of non-financial assets of non-financial private corporations increased 0.5% in the second quarter, while financial assets declined 1.2%. Net worth decreased for a second consecutive quarter.
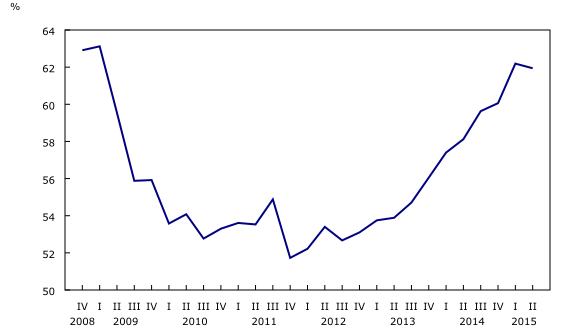
On a book value basis, the credit market debt to equity ratio of non-financial private corporations was unchanged from the previous quarter. There was 62 cents of credit market debt for every dollar of equity at quarter end.
Note to readers
This is a combined release of the National balance sheet accounts and Financial flow accounts (FFA). The National balance sheet accounts are composed of the balance sheets of all sectors and subsectors of the economy. The main sectors are households, non-profit institutions serving households, financial corporations, non-financial corporations, government, and non-residents. They cover all national non-financial assets and financial asset-liability claims outstanding in all sectors. To improve the interpretability of the estimates of the financial flows, selected household borrowing series are available on a seasonally adjusted basis (CANSIM table 378-0127). All other data are unadjusted for seasonal variation.
The FFA articulate net lending or borrowing activity by sector by measuring financial transactions in the economy. The FFA arrive at a measure of net financial investment, which is the difference between transactions in financial assets and liabilities (for example, net purchases of securities less net issuance of securities). The FFA also provide the link between financial and non-financial activity in the economy, which ties estimates of saving and non-financial capital acquisition (for example, investment in new housing) with the underlying financial transactions.
Definitions concerning financial indicators can be found in "Financial indicators from the National Balance Sheet Accounts" and in the "System of macroeconomic accounts glossary."
Next release
Data on the National balance sheet and financial flow accounts for the third quarter will be released on December 14.
Products
The publication Canadian Economic Accounts Quarterly Review (13-010-X) has been discontinued. Links to other releases from the national accounts can still be found in the System of macroeconomic accounts module, accessible from the Browse by key resource module of our website,
The article "Household debt service ratio — Interest and principal," which is part of the Latest Developments in the Canadian Economic Accounts series (13-605-X), is available from the Browse by key resource module of our website under Publications. This article describes the new quarterly estimates of household sector debt payments (mortgage and non-mortgage), including both the interest and principal components.
Contact information
For more information, or to enquire about the concepts, methods or data quality of this release, contact us (toll-free 1-800-263-1136; 514-283-8300; infostats@statcan.gc.ca) or Media Relations (613-951-4636; statcan.mediahotline-ligneinfomedias.statcan@canada.ca).
- Date modified:


