Chart 1
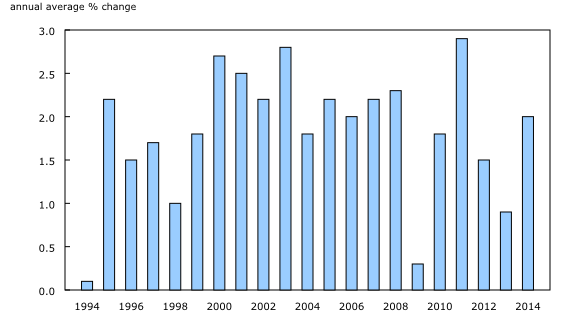
Annual average change in the Consumer Price Index, 1994 to 2014

Chart description
The title of the graph is "Annual average change in the Consumer Price Index, 1994 to 2014."
This is a column clustered chart.
The vertical axis is "annual average % change."
| annual average % change | |
|---|---|
| 1994 | 0.1 |
| 1995 | 2.2 |
| 1996 | 1.5 |
| 1997 | 1.7 |
| 1998 | 1.0 |
| 1999 | 1.8 |
| 2000 | 2.7 |
| 2001 | 2.5 |
| 2002 | 2.2 |
| 2003 | 2.8 |
| 2004 | 1.8 |
| 2005 | 2.2 |
| 2006 | 2.0 |
| 2007 | 2.2 |
| 2008 | 2.3 |
| 2009 | 0.3 |
| 2010 | 1.8 |
| 2011 | 2.9 |
| 2012 | 1.5 |
| 2013 | 0.9 |
| 2014 | 2.0 |
Source(s):
CANSIM table 326-0021.
- Date modified: