Chart 5
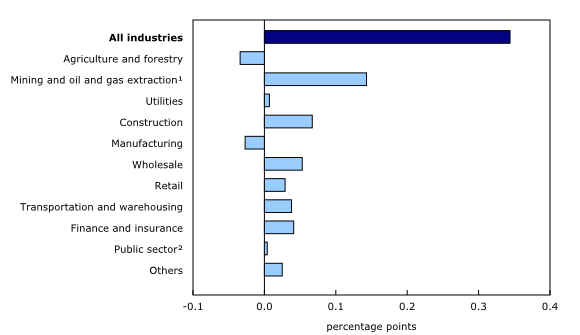
Main industrial sectors' contribution to the percent change in gross domestic product, June 2014

Chart description
The title of the graph is "Main industrial sectors' contribution to the percent change in gross domestic product, June 2014."
This is a bar clustered chart.
The horizontal axis is "percentage points."
| percentage points | |
|---|---|
| All industries | 0.344 |
| Agriculture and forestry | -0.034 |
| Mining and oil and gas extraction¹ | 0.143 |
| Utilities | 0.007 |
| Construction | 0.067 |
| Manufacturing | -0.027 |
| Wholesale | 0.053 |
| Retail | 0.029 |
| Transportation and warehousing | 0.038 |
| Finance and insurance | 0.041 |
| Public sector² | 0.004 |
| Others | 0.025 |
1.
Includes quarrying.
2.
Education, health and public administration.
- Date modified: