Chart 2
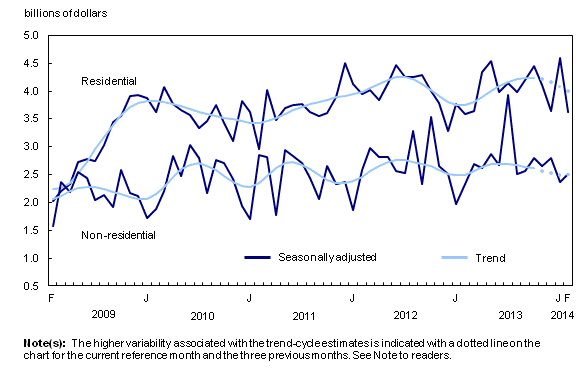
Residential and non-residential sectors

Chart description
The title of the graph is "Residential and non-residential sectors."
This is a line chart.
There are in total 61 categories in the horizontal axis. The vertical axis starts at 0.5 and ends at 5 with ticks every 0.5 points.
There are 4 series in this graph.
The vertical axis is "billions of dollars."
The units of the horizontal axis are months by year from February 2009 to February 2014.
The title of series 1 is "Residential, seasonally adjusted."
The minimum value is 2.025 occurring in February 2009.
The maximum value is 4.593 occurring in January 2014.
The title of series 2 is "Residential, trend."
The minimum value is 2.24 occurring in February 2009.
The maximum value is 4.261 occurring in July 2012.
The title of series 3 is "Non-residential, seasonally adjusted."
The minimum value is 1.575 occurring in February 2009.
The maximum value is 3.935 occurring in July 2013.
The title of series 4 is "Non-residential, trend."
The minimum value is 2.056 occurring in February 2009.
The maximum value is 2.757 occurring in June 2012.
| Residential, seasonally adjusted | Residential, trend | Non-residential, seasonally adjusted | Non-residential, trend | |
|---|---|---|---|---|
| February 2009 | 2.025 | 2.24 | 1.575 | 2.056 |
| March 2009 | 2.208 | 2.253 | 2.367 | 2.124 |
| April 2009 | 2.339 | 2.357 | 2.186 | 2.203 |
| May 2009 | 2.721 | 2.524 | 2.544 | 2.263 |
| June 2009 | 2.784 | 2.73 | 2.432 | 2.283 |
| July 2009 | 2.75 | 2.953 | 2.049 | 2.270 |
| August 2009 | 3.04 | 3.181 | 2.132 | 2.238 |
| September 2009 | 3.443 | 3.393 | 1.918 | 2.193 |
| October 2009 | 3.561 | 3.575 | 2.588 | 2.143 |
| November 2009 | 3.907 | 3.706 | 2.162 | 2.091 |
| December 2009 | 3.935 | 3.783 | 2.109 | 2.060 |
| January 2010 | 3.885 | 3.814 | 1.720 | 2.070 |
| February 2010 | 3.631 | 3.814 | 1.886 | 2.145 |
| March 2010 | 4.074 | 3.797 | 2.206 | 2.284 |
| April 2010 | 3.762 | 3.768 | 2.838 | 2.449 |
| May 2010 | 3.653 | 3.727 | 2.481 | 2.594 |
| June 2010 | 3.563 | 3.679 | 3.031 | 2.681 |
| July 2010 | 3.335 | 3.628 | 2.796 | 2.702 |
| August 2010 | 3.464 | 3.584 | 2.169 | 2.663 |
| September 2010 | 3.75 | 3.549 | 2.771 | 2.580 |
| October 2010 | 3.423 | 3.523 | 2.717 | 2.474 |
| November 2010 | 3.104 | 3.492 | 2.429 | 2.367 |
| December 2010 | 3.826 | 3.457 | 1.931 | 2.295 |
| January 2011 | 3.622 | 3.43 | 1.697 | 2.285 |
| February 2011 | 2.967 | 3.427 | 2.847 | 2.351 |
| March 2011 | 4.014 | 3.459 | 2.820 | 2.478 |
| April 2011 | 3.474 | 3.521 | 1.783 | 2.615 |
| May 2011 | 3.694 | 3.596 | 2.934 | 2.712 |
| June 2011 | 3.752 | 3.665 | 2.840 | 2.731 |
| July 2011 | 3.776 | 3.718 | 2.713 | 2.681 |
| August 2011 | 3.628 | 3.762 | 2.443 | 2.592 |
| September 2011 | 3.545 | 3.804 | 2.063 | 2.492 |
| October 2011 | 3.603 | 3.849 | 2.649 | 2.408 |
| November 2011 | 3.894 | 3.887 | 2.330 | 2.355 |
| December 2011 | 4.511 | 3.917 | 2.367 | 2.346 |
| January 2012 | 4.126 | 3.946 | 1.872 | 2.380 |
| February 2012 | 3.95 | 3.986 | 2.579 | 2.457 |
| March 2012 | 4.016 | 4.047 | 2.973 | 2.562 |
| April 2012 | 3.843 | 4.125 | 2.820 | 2.662 |
| May 2012 | 4.15 | 4.201 | 2.811 | 2.732 |
| June 2012 | 4.476 | 4.253 | 2.564 | 2.757 |
| July 2012 | 4.259 | 4.261 | 2.522 | 2.754 |
| August 2012 | 4.258 | 4.218 | 3.288 | 2.734 |
| September 2012 | 4.282 | 4.133 | 2.325 | 2.698 |
| October 2012 | 3.994 | 4.024 | 3.526 | 2.646 |
| November 2012 | 3.778 | 3.909 | 2.657 | 2.578 |
| December 2012 | 3.277 | 3.812 | 2.507 | 2.518 |
| January 2013 | 3.764 | 3.754 | 1.966 | 2.486 |
| February 2013 | 3.597 | 3.752 | 2.326 | 2.501 |
| March 2013 | 3.639 | 3.806 | 2.696 | 2.559 |
| April 2013 | 4.349 | 3.899 | 2.625 | 2.631 |
| May 2013 | 4.541 | 4.004 | 2.877 | 2.684 |
| June 2013 | 3.982 | 4.098 | 2.671 | 2.699 |
| July 2013 | 4.152 | 4.167 | 3.935 | 2.688 |
| August 2013 | 3.98 | 4.213 | 2.514 | 2.666 |
| September 2013 | 4.199 | 4.238 | 2.571 | 2.641 |
| October 2013 | 4.45 | 4.244 | 2.806 | 2.611 |
| November 2013 | 4.113 | 4.219 | 2.651 | 2.569 |
| December 2013 | 3.644 | 4.163 | 2.793 | 2.527 |
| January 2014 | 4.593 | 4.084 | 2.362 | 2.498 |
| February 2014 | 3.629 | 4.003 | 2.519 | 2.501 |
- Date modified: