
Chart 2
Most critical government programs to support innovation, all surveyed industries
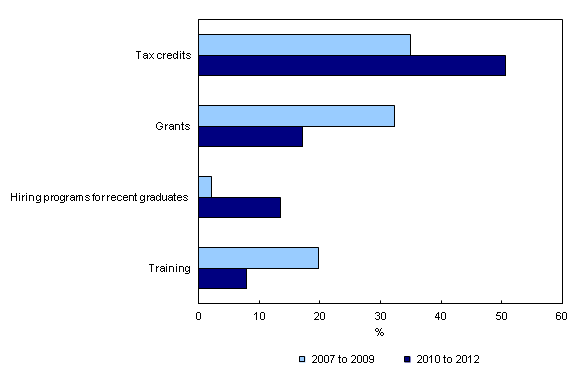
Chart description
The title of the graph is "Most critical government programs to support innovation, all surveyed industries."
This is a bar clustered chart.
This is a horizontal bar graph, so categories are on the vertical axis and values on the horizontal axis.
There are in total 4 categories in the vertical axis. The horizontal axis starts at 0 and ends at 60 with ticks every 10 points.
There are 2 series in this graph.
The horizontal axis is "%."
The vertical axis is "Government programs."
The title of series 1 is " 2010 to 2012."
The minimum value is 7.8 and it corresponds to "Training."
The maximum value is 50.7 and it corresponds to "Tax credits."
The title of series 2 is " 2007 to 2009."
The minimum value is 2.1 and it corresponds to "Hiring programs for recent graduates."
The maximum value is 34.9 and it corresponds to "Tax credits."
| 2010 to 2012 | 2007 to 2009 | |
|---|---|---|
| Training | 7.8 | 19.7 |
| Hiring programs for recent graduates | 13.4 | 2.1 |
| Grants | 17.1 | 32.3 |
| Tax credits | 50.7 | 34.9 |
- Date modified: