
Chart 2
Manufacturing output expands in January
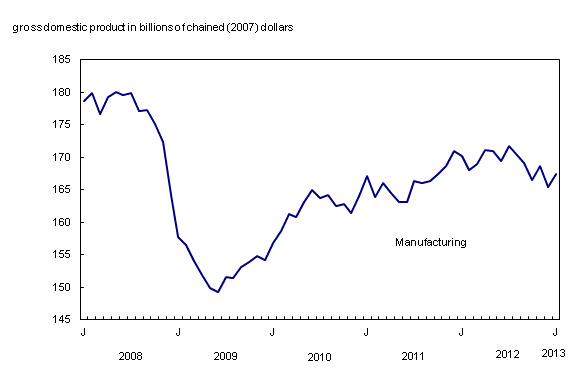
Chart description
The title of the graph is "Manufacturing output expands in January
."
This is a line chart.
There are in total 61 categories in the horizontal axis. The vertical axis starts at 145 and ends at 185 with ticks every 5 points.
There are 1 series in this graph.
The vertical axis is "gross domestic product in billions of chained (2007) dollars."
The units of the horizontal axis are months by year from January 2008 to January 2013.
The title of series 1 is "Manufacturing."
The minimum value is 149.295 occurring in June 2009.
The maximum value is 180.057 occurring in May 2008.
| gross domestic product in billions of chained (2007) dollars | |
|---|---|
| January 2008 | 178.708 |
| February 2008 | 179.917 |
| March 2008 | 176.673 |
| April 2008 | 179.263 |
| May 2008 | 180.057 |
| June 2008 | 179.658 |
| July 2008 | 179.964 |
| August 2008 | 177.086 |
| September 2008 | 177.261 |
| October 2008 | 175.195 |
| November 2008 | 172.291 |
| December 2008 | 164.147 |
| January 2009 | 157.672 |
| February 2009 | 156.462 |
| March 2009 | 153.988 |
| April 2009 | 151.852 |
| May 2009 | 149.828 |
| June 2009 | 149.295 |
| July 2009 | 151.51 |
| August 2009 | 151.365 |
| September 2009 | 153.189 |
| October 2009 | 153.854 |
| November 2009 | 154.83 |
| December 2009 | 154.195 |
| January 2010 | 156.822 |
| February 2010 | 158.585 |
| March 2010 | 161.285 |
| April 2010 | 160.856 |
| May 2010 | 163.164 |
| June 2010 | 165.036 |
| July 2010 | 163.782 |
| August 2010 | 164.241 |
| September 2010 | 162.556 |
| October 2010 | 162.853 |
| November 2010 | 161.432 |
| December 2010 | 164.06 |
| January 2011 | 167.153 |
| February 2011 | 163.837 |
| March 2011 | 166.063 |
| April 2011 | 164.462 |
| May 2011 | 163.16 |
| June 2011 | 163.176 |
| July 2011 | 166.33 |
| August 2011 | 166.002 |
| September 2011 | 166.37 |
| October 2011 | 167.458 |
| November 2011 | 168.588 |
| December 2011 | 170.973 |
| January 2012 | 170.2 |
| February 2012 | 168.013 |
| March 2012 | 168.994 |
| April 2012 | 171.05 |
| May 2012 | 170.916 |
| June 2012 | 169.445 |
| July 2012 | 171.693 |
| August 2012 | 170.335 |
| September 2012 | 169.108 |
| October 2012 | 166.453 |
| November 2012 | 168.679 |
| December 2012 | 165.497 |
| January 2013 | 167.419 |
- Date modified: