
Chart 1
Industrial capacity utilization rate down for a second consecutive quarter
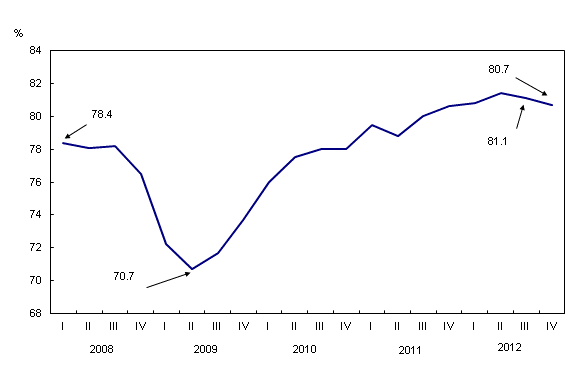
Chart description
The title of the graph is "Industrial capacity utilization rate down for a second consecutive quarter."
This is a line chart.
There are in total 20 categories in the horizontal axis. The vertical axis starts at 68 and ends at 84 with ticks every 2 points.
There are 1 series in this graph.
The vertical axis is "%."
The units of the horizontal axis are quarters by year from first quarter 2008 to fourth quarter 2012.
The title of series 1 is "%."
The minimum value is 70.7 occurring in second quarter 2009.
The maximum value is 81.4 occurring in second quarter 2012.
| % | |
|---|---|
| first quarter 2008 | 78.4 |
| second quarter 2008 | 78.1 |
| third quarter 2008 | 78.2 |
| fourth quarter 2008 | 76.5 |
| first quarter 2009 | 72.2 |
| second quarter 2009 | 70.7 |
| third quarter 2009 | 71.7 |
| fourth quarter 2009 | 73.7 |
| first quarter 2010 | 76 |
| second quarter 2010 | 77.5 |
| third quarter 2010 | 78 |
| fourth quarter 2010 | 78 |
| first quarter 2011 | 79.5 |
| second quarter 2011 | 78.8 |
| third quarter 2011 | 80 |
| fourth quarter 2011 | 80.6 |
| first quarter 2012 | 80.8 |
| second quarter 2012 | 81.4 |
| third quarter 2012 | 81.1 |
| fourth quarter 2012 | 80.7 |
- Date modified: