


|
|
| |
Information identified as archived is provided for reference, research or recordkeeping purposes. It is not subject to the Government of Canada Web Standards and has not been altered or updated since it was archived. Please "contact us" to request a format other than those available.

|

Wednesday, September 29, 2004 Homicides2003The national homicide rate dropped 7% in 2003. The rate of 1.73 victims per 100,000 people was the lowest in over three decades. The homicide rate has generally been declining since the mid-1970s. Canadian police services reported 548 homicides in 2003, 34 fewer than in 2002. This decline was related to a large drop in the number of females killed (50 fewer compared with 2002). At the same time, there were 16 more male victims. Men accounted for 72% of all victims in 2003. 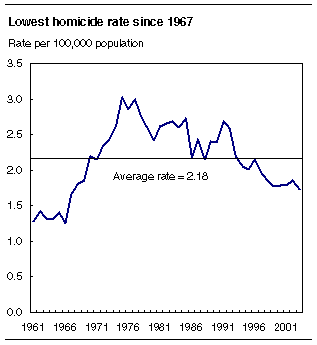
The national decline was driven by decreases in British Columbia (33 fewer homicides), Quebec (-18) and Alberta (-7). Both Quebec and Nova Scotia reported their lowest homicide rates since the 1960s. In contrast, Saskatchewan (+14) and Manitoba (+7) had an increase in homicides in 2003.
Police reported that one in every seven homicides in 2003 involved organized crime or street gangs. There were 84 victims of gang-related homicide, most (45%) of which occurred in Ontario. Most gang-related homicides involved young adults. Of those gang-related homicides that were solved by police, 60% of accused persons and 49% of all victims were between 18 and 24 years old. Canada's homicide rate was about one-third that of the United States (5.69). It was also lower than England and Wales (1.93), but slightly higher than France (1.65) and Australia (1.63). Homicides committed by strangers reach a 25-year lowMost homicides were committed by someone known to the victim. In 2003, 57 victims (14%) were killed by a stranger—the lowest number in more than 25 years. Half (51%) of all victims were killed by an acquaintance and one-third (34%) by a family member. The 139 victims killed by a family member represented a large decline from 182 in 2002 and the average of 172 over the previous decade. Most of the decline in family-related homicides was related to non-spousal killings committed by parents, grown children, siblings and extended family members. The spousal homicide rate declined by 8% in 2003, with six fewer spouses killed. This rate has been gradually declining since the mid-1970s for both men and women. Of the 78 spousal homicides, 64 men killed their wives (including common-law, separated and divorced persons) and 14 women killed their husbands. Homicides involving other types of intimate partner relationships also dropped, from 17 in 2002 to 11 in 2003. These include homicides committed by boyfriends, girlfriends and current or estranged partners. Women were much more likely than men to be killed by an intimate partner. Among all solved homicides of victims who were 15 years of age and older, almost two-thirds (64%) of females were killed by someone with whom they had an intimate relationship at one point in time compared with 7% of males. Males were far more likely to be killed by a casual acquaintance (31%), a stranger (19%) or a criminal associate (13%). Lowest number of children killed in more than 25 yearsThere were 33 homicides committed against children under the age of 12 in 2003, the lowest number in over 25 years. Of these victims, 14 (or 42%) were under one year of age. Of the 27 solved homicides against children, 23 were killed by a parent: 9 by a father, 4 by a step-father, 10 by a mother and 1 by a step-mother (in one incident, both parents were accused). In addition, 2 children were killed by their day-care provider and 2 by a stranger. Shootings most common methodThere were 161 homicides committed with a firearm, accounting for slightly less than one-third (29%) of all homicides. This was similar to previous years. The use of rifles/shotguns to commit homicide continued to decline. Rifles/shotguns accounted for 20% of all firearm homicides in 2003 compared with about 40% a decade ago. There were 109 homicides committed with a handgun in 2003, slightly more than the average over the past decade. Handguns were used in two-thirds of all firearm homicides in 2003 and 59% of all gang-related killings. Other common methods used to commit homicide in 2003 were stabbings (26%), beatings (22%) and strangulation/suffocation (12%). The number of victims stabbed to death fell from 182 in 2002 to 142 in 2003. Most victims and accused persons had a criminal recordConsistent with earlier years, 2 out of every 3 adults accused of homicide in 2003 had a criminal record. Most had been previously convicted of a violent offence, including 5 for homicide. About 4 in 10 youth accused of homicide also had a criminal record. Slightly more than half (52%) of all adult homicide victims and 15% of youth victims also had a criminal record. Increase in homicides committed by youthThere were 57 youths aged 12 to 17 years accused of homicide in 2003, 15 more than in 2002 and 8 more than the previous 10-year average. The youth homicide rate had generally been declining between 1995 and 2001. As in previous years, youth were more likely than adults to kill other youth and young adults. Of the solved homicides committed by youth in 2003, about half (54%) of the victims were between 12 and 24 years old compared with about one-quarter of victims killed by adults. Available on CANSIM: tables 253-0001 to 253-0006. Definitions, data sources and methods: survey number 3315. The publication Juristat: Homicide in Canada, 2003, Vol. 24, no. 8 (85-002-XIE20040088407, $9/$75; 85-002-XPE20040088407, $11/$100) is now available. For further information, or to enquire about the concepts, methods or data quality of this release, contact Information and Client Services (1-800-387-2231; 613-951-9023), Canadian Centre for Justice Statistics.
| |||||||||||||||||||||||||||||||||||||||||||||||||||||||||||||||||||||||||||||||||||||||||||||||||||||||||||||||||||||||||||||||||||||||||||||||||||||||||||||||||||||||||||||||||||||||||||||||||||||||||||||||||||||||||||||||||||||||||||||||||||||||||||||||||||||||||||||||||||||||||||||||||||||||||||||||
|
|
|

