Has the COVID-19 pandemic changed commuting patterns for good?
Archived Content
Information identified as archived is provided for reference, research or recordkeeping purposes. It is not subject to the Government of Canada Web Standards and has not been altered or updated since it was archived. Please "contact us" to request a format other than those available.
Released: 2022-11-30
For millions of Canadians, getting to work is an essential part of the daily routine that affects how they spend both their time and their money. Whether it involves driving, taking a bus or train, walking, or hopping on a bike, commuting can be a stressful ordeal for some, while for others it can be a period of relaxation at the start and end of the day.
Beyond affecting personal well-being, commuting patterns have important economic and infrastructure-related implications, as well as environmental impacts. Governments at all levels continue to invest in commuting and transit infrastructure, roads, public transit, walkways, and cycle paths. They are introducing various strategies to reduce air and noise pollution and harmful greenhouse gas emissions. Understanding how Canadians get to work is critically important for employers, employees and all levels of government.
In the early months of the pandemic, public health measures introduced to slow the spread of COVID-19 had two immediate impacts on the number of Canadians commuting. First, the labour market experienced unprecedented job losses, with employment falling by more than 3 million from February to April 2020, and a further 2.5 million Canadians losing all or most of their work hours. Second, the pandemic triggered a massive shift from working in the office to working from home, with more than 3 million workers making this shift in April 2020.
In addition to the unprecedented magnitude of its impact on labour markets, the pandemic highlighted important differences in the jobs done by diverse groups of Canadians, the vulnerability of those jobs to economic shutdowns and business closures, and the ability to pivot to working from home. For example, 323,000 fewer people were working in accommodation and food services in 2021, compared with 2016, because of required closures and not being able to work at home.
The 2021 Census of Population asked Canadians about their commuting habits in May 2021. At that time, employment was more than half a million (-557,000) below its February 2020 level, with the largest gaps in industries requiring close contact with others. With a number of public health measures being tightened in response to the third wave of the pandemic, millions of Canadians continued to work from home.
Today's release presents a comprehensive portrait of commuting in Canada at the time of the 2021 Census. Using the unique power of census data, today's release documents the impact of the pandemic on commuting at the national, provincial and territorial, and local levels, and it offers important new insights on what getting to work in May 2021 meant for diverse groups of Canadians. In addition, using data from the May 2022 Labour Force Survey (LFS) helps governments, transit planners, workers and employers understand some of the ways the pandemic might more permanently change where Canadians work and how they get there.
Highlights
The way Canadians commute was altered in 2021 by the pandemic, with lockdowns to slow the spread of COVID-19 and changes in how and where Canadians worked leading to 2.8 million fewer commuters, compared with five years earlier.
The number of Canadians "car commuting"—that is, travelling to work by car, truck or van as a driver or as a passenger—declined by 1.7 million from five years earlier to reach 11 million in May 2021. The drop in car commuting mainly occurred among those working in professional service industries, while the number of front-line workers commuting by car increased.
There were 245,000 fewer Canadians making car commutes of at least 60 minutes, compared with May 2016.
The number of people usually taking public transit to work fell from 2 million in 2016 to 1 million in May 2021, declining for the first time since the census began collecting commuting data in 1996.
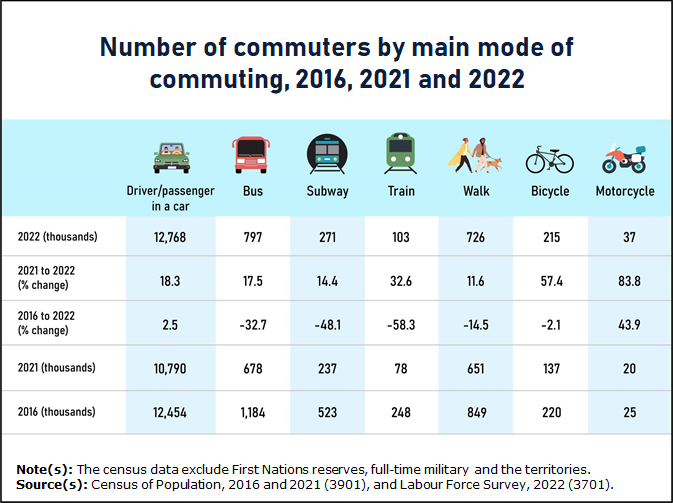
With the economy more open and most public health measures related to the pandemic removed, the number of car commuters, at 12.8 million, had exceeded 2016 levels by May 2022. However, the number of public transit commuters, at 1.2 million, remained well below pre-COVID-19 levels.
Despite the drop in public transit use, the proportion of Canadians using mass transit or walking or cycling to get to work was higher than that of Americans.
While Canadian government investments in walking and bicycle trails continues, nearly 300,000 fewer workers were usually using active transit (walking or bicycling) as a main mode of commuting in May 2021, compared with five years earlier. By May 2022, active transit commuting in the provinces had increased to 941,000 from 788,000 in May 2021, but was still lower than the 1.1 million recorded in 2016.
Hitting the brakes on commuting: 2.8 million fewer commuters in May 2021, compared with five years earlier
Pandemic lockdowns and changes in how and where Canadians work during the pandemic alter the face of commuting in Canada in 2021
Just over 2.8 million fewer Canadians were usually commuting in May 2021 than in May 2016. This includes just under 1.7 million fewer people travelling to work mainly by car, close to 1 million fewer usually taking public transit and 289,000 fewer usually walking or cycling to work.
The decline in commuting during the pandemic was a confluence of two factors.
First, the pandemic resulted in unprecedented employment losses, particularly among businesses that require close physical contact indoors, such as restaurants, retailers and gyms.
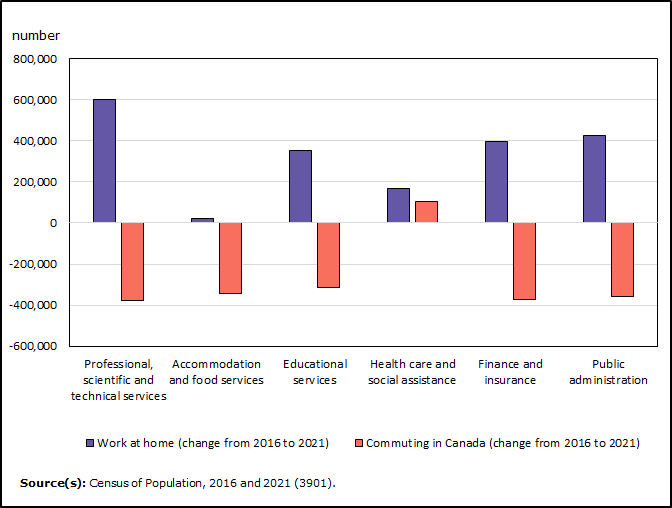
Second, the pandemic caused a massive shift toward working at home in industries where this was possible. In May 2021, there were 4.2 million people usually working at home, over three times the level seen in May 2016 (1.3 million). (See the census labour release in The Daily for more details.) Increases in working from home were concentrated in industries such as professional, scientific and technical services; public administration; finance and insurance; and educational services.
Not only were millions more Canadians working from home in May 2021, but related data from the census release on labour, also released today, indicate that some of these Canadians had moved to a different municipality than the one in which they were living in May 2020. In other words, virtual work not only affects where people work and whether they commute, but can also influence where they choose to live and how they get to work. Whether this phenomenon will continue remains to be seen.
Discussions surrounding preferred work models—in-person full-time, hybrid or virtual work—continue. There are certain advantages and disadvantages to each model, tied to factors such as commuting, team building, client and colleague interactions, work–life balance, training, and networking and mentoring. Personal costs, as well as environmental impacts, are other factors. The policy implications of shifting from the pre-pandemic model and the measurement of the advantages and disadvantages of each work option will continue to be evaluated for years to come.
By May 2022, the number of car commuters returns to 2016 levels, but taking public transit to work remains below levels seen six years earlier
While the pandemic impacted commuting in 2021, there were signs that car commuting was returning to pre-pandemic patterns by the spring of 2022. A full year after the census, conducted in May 2021, with most public health measures removed and businesses encouraged to fully reopen, data from the May 2022 LFS indicate that the number of car commuters (drivers or passengers travelling to work in a car, truck or van) was 12.8 million, about the same as in 2016.
No similar change occurred for public transit commuting. The number of public transit commuters in May 2022, at 1.2 million, continued to lag well behind pre-pandemic levels (2 million in 2016). It is too soon to tell whether the impact of the pandemic on public transit use is temporary or lasting, but the May 2021 census data provide a baseline from which to gauge this effect going forward.
The decline in car commuting is widespread across Canada, but highest in Ontario and Alberta
Approximately 11 million Canadians were car commuters in May 2021, usually travelling to work by car, truck or van either as a driver or passenger. This is nearly 1.7 million fewer (-13.2%) compared with five years earlier.
Every province and territory except Prince Edward Island and Yukon saw fewer people usually commuting by car in 2021 than five years earlier. The number of car commuters in Ontario fell by one-fifth (-20.2%) to 3.8 million in May 2021, the largest drop nationally, followed by Alberta (-13.7%).
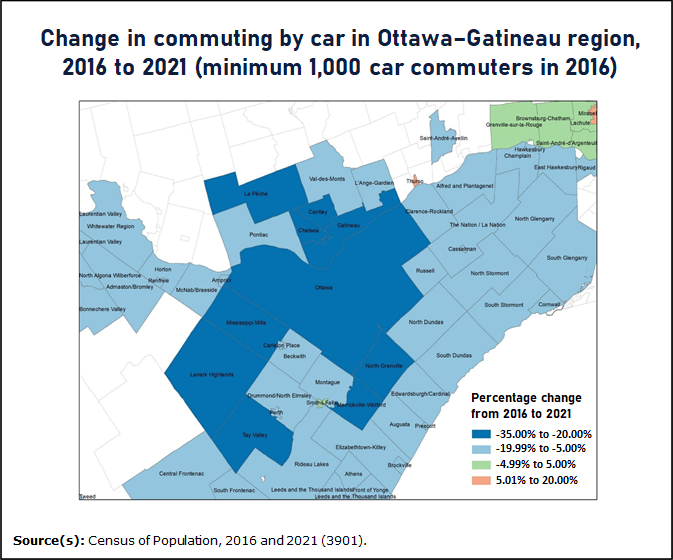
Almost all of Canada's largest census metropolitan areas (CMAs) saw fewer car commuters on the road, with many located in Ontario. Ottawa–Gatineau (-26.4%) had the largest proportional decline among the CMAs, followed by Toronto (-24.3%), Hamilton (-23.1%) and Kitchener–Cambridge–Waterloo (-21.0%).
Ottawa–Gatineau, along with many neighbouring municipalities—particularly urban ones—had declines of at least 20% in the number of car commuters from 2016 to 2021, while nearby rural municipalities had smaller declines.
Conversely, Winnipeg (-7.6%) reported the smallest decline in car commuters among CMAs with at least 125,000 commuters.
Car commuting is much more prevalent outside Canadian cities because public transit is not often available. In 2021, the decline in car commuting was less pronounced in rural and small-town Canada (-5.7%), compared with Canadian CMAs (-15.8%) and census agglomerations (cities with a population under 100,000) (-7.4%).
Decline in car commuting mainly seen among those working in professional service industries, while front-line workers are more likely to commute by car
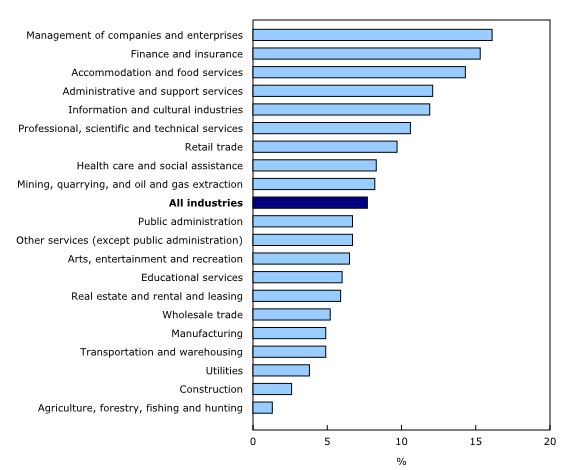
The largest drops in car commuting in May 2021, compared with five years earlier, occurred among Canadians working in public administration (-235,000 people, or -28.2%); finance and insurance (-224,000, or -47.8%); professional, scientific and technical services (-224,000, or -32.1%); and educational services (-216,000, or -22.0%). This mirrors an increase in working at home among people in these industries, as it was possible to do at least some work from home in most cases.
People working in other industries did not have as much choice to work at home and continued to commute. In 2021, more people working in health care and social assistance (+126,000, or +7.8%), construction (+69,000, or +6.4%), and transportation and warehousing (+20,000, or +2.8%) were commuting by car, compared with five years earlier.
The pandemic led to fewer cars on the road and a faster trip to work in 2021, but commute times for drivers are starting to rise in 2022
With fewer commuters on the road in May 2021, many of those who were commuting by car benefited from shorter commuting times. In 2021, more than 8 in 10 (82.0%) car commuters had a journey to work of 30 minutes or less, up from 78.9% in 2016. In contrast, 18.0% had a commute of more than half an hour, down from 21.1% five years earlier.
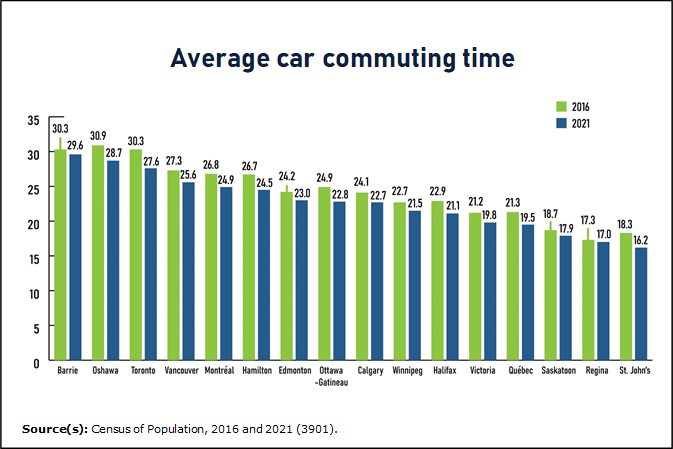
On average, car commuters spent 22.8 minutes getting to work in May 2021, down from 24.1 minutes in May 2016. Workers who commuted by car to a usual workplace saw a decline in average commute times of 1.9 minutes (from 22.9 minutes in 2016 to 21.0 minutes in 2021). Among the 2.2 million Canadians with no fixed workplace address—many of whom work in construction and transportation and warehousing—average car commuting times fell by 1.5 minutes, from 32.2 minutes in 2016 to 30.7 minutes in 2021.
Much of Canada's population lives in large cities, and with more people comes more road congestion. However, with fewer commuters on the road in 2021, the average car commute time fell in 16 of Canada's largest CMAs.
Toronto saw the largest decline in average car commuting time (-2.7 minutes), followed by Hamilton and Oshawa (-2.2 minutes each), and St. John's and Ottawa–Gatineau (-2.1 minutes each).
Conversely, average car commute times declined the least in Regina (-0.3 minutes), followed by Barrie (-0.7 minutes). With the greater decline in car commuting time from 2016 to 2021 for Oshawa and Toronto, Barrie had the longest average car commuting time, at 29.6 minutes.
Fewer Canadians face long car commutes in 2021
The number of Canadians making long commutes by car (60 minutes or more) fell by over one-quarter (-28.7%), from 854,000 in 2016 to 609,000 in 2021. A number of negative effects are associated with long commutes. Studies mentioned in a 2019 Statistics Canada report show that longer commutes are associated with poorer physical and mental health outcomes. They also found that those with long commutes in cars were more likely to be negatively impacted than those with long commutes using public transit. Family strain and environmental impacts from idling in congestion are other effects mentioned.
Some groups are more likely to be long commuters. Using 2016 Census data, the report mentioned above showed that among people aged 25 and older, men, high-income earners, those in jobs with no fixed workplace address and those in natural resource occupations were more likely to have long car commutes, compared with other groups.
Similar results were found in 2021. Men were more than twice as likely as women to be long car commuters (7.4% versus 3.2%). Canadians working in natural resource occupations (9.8%) were most likely to have long car commutes, followed closely by those working in trades, transport and related occupations (9.4%); many in these occupations had no fixed workplace address. Conversely, those working in sales and service occupations (3.2%) were least likely to have long car commutes.
The drop in long commutes by car was most pronounced in Canada's largest city. In 2016, 208,000 people living in the Toronto CMA spent one hour or more per day commuting by car. By 2021, this number had fallen to 108,000.
Time spent car commuting edges up in May 2022, but still lower than in 2016
Less time commuting by car may reduce personal stress and contribute to lower greenhouse gas emissions. Emissions from road transportation fell by 14.4% from 2019 to 2020, leading to the lowest greenhouse gas emissions from road transportation since 2005.
Canada is continuing to push for greater reductions in greenhouse gas emissions, having formally submitted its enhanced Nationally Determined Contribution to the United Nations in July 2021, committing to cutting its greenhouse gas emissions by 40% to 45% below 2005 levels by 2030. Part of this overall strategy, in terms of commuting, is to make zero-emission vehicles more accessible and affordable, and to electrify public transit networks and promote active modes of commuting. Some Canadians appear to be adopting this strategy; in 2021, 1 in 10 new vehicles registered in Canada were either fully electric or hybrid electric, the highest share on record.
Based on data from the LFS, the number of car commuters exceeded May 2016 levels (12.5 million, excluding those in the territories, First Nations reserves and full-time military) by May 2022 (12.8 million). Car commuting levels had approached or exceeded May 2016 levels in every province except Quebec by May 2022. Approximately 4.7 million people in Ontario commuted by car in May 2022, on par with May 2016 levels.
With the rebound in car commuters, average car commute times edged up from 22.8 minutes in 2021 to 23.5 minutes in May 2022, but remained below 2016 levels (24.1 minutes, on average).
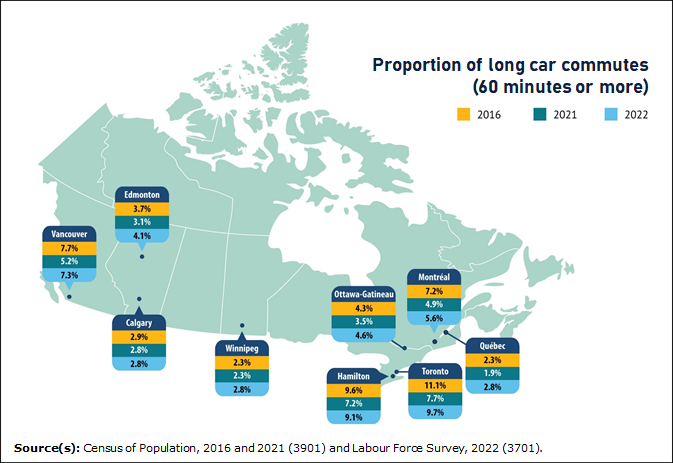
In May 2022, 6.2% of car commuters spent 60 minutes or more travelling to work, up from 5.6% in 2021 but down from 6.8% in 2016.
In Toronto, Montréal, Hamilton and Vancouver, the proportion of workers commuting one hour or more in a car was lower in 2022 compared with 2016. However, for the other five largest urban centres, it was unchanged or slightly higher, compared with six years earlier.
No ticket to ride: Commuting by public transit down by one-half from five years earlier
The number of Canadians commuting by public transit sees its first decline since data collection began in 1996
Public transit infrastructure, for both commuting and non-commuting purposes, remains a priority for federal, provincial and large municipal governments seeking to transition to a low-carbon economy. For example, starting in 2021, the federal government invested $14.9 billion in public transit over eight years, including an upfront investment of $5.9 billion and a permanent $3 billion annual investment starting in 2026. At the same time, some municipal governments are exploring new funding models for public transit and assessing their impact on tax revenues.
The number of public transit commuters rose by 59.5% from 1996 to 2016, up from 1.2 million to just under 2 million over this 20-year period. The share of Canadians using a bus, train or subway as their main mode of commuting rose from 10.1% to 12.4% in the same period.
In May 2021, public health measures such as masking when using public transit were in effect, and most transit routes were still operating normally. Nevertheless, the number of Canadians usually travelling to work by bus, train or subway fell from just under 2 million in 2016 to 1 million in 2021. This fully reversed the gains made from 1996 to 2016, as there were fewer public transit commuters in 2021 (1.0 million) than in 1996 (1.2 million). With this decline, 7.7% of employed Canadians used public transit as their main mode of commuting in 2021, the lowest level since these data started being collected in 1996.
Ontario had the largest proportional decline in public transit commuting, falling by 56.1%, from 889,000 in 2016 to 390,000 in 2021. The number of Albertans commuting by public transit also fell by over half (-54.6%), from 195,000 to 88,000.
All types of public transit were affected by public health measures put in place to slow the spread of COVID-19. The number of Canadians commuting by bus fell by 42.8%, from 1.19 million in 2016 to 681,000 in May 2021. The number of Canadians commuting by subway fell by over half (-54.6%), from 523,000 in 2016 to 237,000 in May 2021; in the same period, the number of Canadians commuting by light rail, train and streetcar fell by over two-thirds (-68.5%), from 248,000 to 78,000.
Despite the pandemic-related drop, the proportion of Canadians using public transit or active transit to get to work is higher than that of Americans
Commuting is measured similarly in the Canadian Census of Population (2021) and the American Community Survey (2021), allowing for some comparison between the two countries. One difference is that Canada tracks commuting for the working population aged 15 years and older, while in the United States, the data cover those aged 16 years and older.
In 2021, 7.7% of Canadian workers commuted by public transit, more than double (2.6 times) the proportion in the United States, at 3.0%. The gap was even larger than in 2016 (2.3 times), when 12.4% of Canadians commuted by public transit, compared with 5.4% in the United States.
Shorter commute times for public transit users in May 2021
Average commuting times declined for every type of public transit from May 2016 to May 2021. The average commute by bus declined by 1.4 minutes to 40.9 minutes, partly as a result of less traffic on roadways.
Average commute times for light rail or commuter rail users fell by 3.5 minutes to 50.7 minutes during this period. The average commute for those using a ferry as their main mode of commuting declined by 3.7 minutes to 45.7 minutes. The average subway commute edged down slightly by 0.1 minutes to 45.9 minutes.
Every large CMA with at least 100,000 workers—except Calgary (+2.0 minutes) and St. John's (+0.5 minutes)—saw little change or a decline in bus commute times from 2016 to 2021. Bus commuters in Kelowna saw the largest drop (-3.9 minutes) from five years earlier, followed by those in Barrie (-3.5 minutes), Halifax (-3.3 minutes) and Victoria (-3.1 minutes).
Average commuting times for Canadians who mainly used commuter rail or light rail fell notably in Barrie (-13.1 minutes), Hamilton (-7.6 minutes), Oshawa (-4.4 minutes) and Vancouver (-4.0 minutes).
Commuting by public transit remains well below pre-COVID-19 levels, despite some recovery in 2022
Based on data from the May 2022 LFS, the number of Canadians using public transit as their primary means of getting to work was up, albeit to a lesser extent than the number of car commuters.
In May 2022, the number of public transit commuters (excluding those in the territories, First Nations reserves and full-time military) was 177,000 higher than in May 2021, but down by 788,000 (-40.2%) compared with May 2016. Other data sources support this small, slow uptick in public transit.
According to a Statistics Canada survey of urban transit providers in May 2022, ridership in Canada was at 60.8% of the pre-pandemic level of May 2019. Indeed, May 2022 was the first month since the start of the pandemic in which passenger levels reached 60% of those of the same month in 2019, before the pandemic.
Every province except Manitoba saw more people commuting on public transit in 2022 than in 2021. However, levels remained well below those from 2016 in every province except Newfoundland and Labrador, Prince Edward Island, and Saskatchewan.
Prince Edward Island, which has limited public transit, was the lone province to return to 2016 levels in 2021.
Newfoundland and Labrador saw public transit commuting drop in 2021, but then bounce back in 2022 to reach slightly higher than 2016 levels.
Public transit commuting in Saskatchewan fell in 2021 and was 6.1% below 2016 levels in 2022 (compared with 15.1% to 48.7% below 2016 levels in the remaining provinces).
Among Canada's largest urban centres with at least 100,000 commuters, public transit commuting levels in 2022 were still well below those of 2016 in nearly all of them, with a few exceptions, such as Windsor, London and Saskatoon.
Public transit remains the lone commuting option for many Canadians
Driving to work, especially alone, lowers the risk of contracting COVID-19 through close contact with others.
However, many Canadians do not have the option of taking a car to work, and the impact of the pandemic on commuting varied significantly across demographic, economic and cultural groups, including women, youth, low-income individuals, members of racialized groups and immigrants.
In 2021, 9.6% of women commuted by public transit, compared with 6.0% of men. Women accounted for 57.8% of all commuters who mainly used public transit to commute, while accounting for 46.2% of all commuters.
Part of this difference may be associated with the types of industries where men and women work. For example, women are more likely than men to work in health care and social assistance, finance and insurance, retail trade, and accommodation and food services. People working in these industries are more likely to take public transit to get to work than those working in many other industries.
In 2021, 11.9% of youths aged 15 to 24 commuted by public transit, compared with 7.0% of those aged 25 and older. This was likely related to differences in access to a vehicle and affordability; specifically, the cost of maintaining a private vehicle is generally more expensive relative to the cost of taking public transit.
According to the 2021 Census, 11.7% of Canadians aged 25 and older in low income in 2020 used public transit as their main mode of commuting in 2021, compared with 6.7% of workers in this age group who were not in low income.
Among racialized groups, the proportion of commuters who used public transit as their main mode of commuting in May 2021 ranged from 11.9% for Chinese Canadians to 22.7% for Black Canadians.
Of the 1 million commuters who mainly used public transit to commute in 2021, 563,000 people (56.3%) belonged to a racialized group. Racialized Canadians accounted for just over one-quarter (26.5%) of the employed. In addition, racialized groups represented a much larger share of public transit commuters in 2021, compared with 2016 (56.3% versus 43.7%).
This difference is not fully explained by industry of work in relation to opportunities to work at home. For example, while high proportions of racialized Canadians worked in industries that generally require a workplace outside the home (e.g., accommodation and food services; transportation and warehousing), high proportions also worked in industries where working at home was common during the pandemic (e.g., finance and insurance; professional, scientific and technical services). Also, even though racialized groups were more likely to live in large urban centres where public transit is more available, compared with smaller cities or rural areas, the difference in public transit commuting remains when only large urban centres are considered. In 2021, 17.6% of commuters who were in a racialized group and living in a large urban centre were using public transit, compared with 6.4% of commuters who were not in a racialized group and were living in a large urban centre.
In 2021, 13.1% of immigrants commuted by public transit, compared with 4.7% of Canadian-born individuals. In fact, 559,000 (55.9%) of the 1 million commuters who mainly used public transit to commute were immigrants or non-permanent residents, while immigrants and non-permanent residents represented 27.8% of all commuters.
There was a shift in who used public transit from 2016 to 2021, with the share of immigrants and non-permanent resident commuters using public transit rising from 44.0% to 55.9%.
There were also differences in public transit commuting between immigrants (including non-permanent residents) and non-immigrants, even within the same broad occupation groups. For example, immigrants who worked in sales and service occupations (21.2%) and health occupations (15.9%) were more likely to be using public transit, compared with non-immigrant workers in similar occupations (7.1% in sales and service occupations and 3.6% in health occupations).
Fewer Canadians walking or biking to work in 2021
Going for a walk or a bike ride was one of the few activities available to Canadians during the lockdowns of the first two years of the pandemic. Recent data show that some Canadian adults were exercising a few more minutes each day for recreation during the pandemic, while older Canadians were walking or cycling more.
Governments at all levels continue to expand public transit and sustainable routes, such as walking and cycling trails, to encourage Canadians to exercise, make cities more liveable and foster a sense of community, and create safe modes of active commuting. In 2021, the federal government invested over $400 million in active transit. Research shows that walkability and physical activity benefit overall well-being and that this was particularly the case during the pandemic. In light of this, over the past two years, a number of municipalities have added or extended bicycle paths and trails to link up with places of employment, parks and stores.
However, with many more Canadians working from home, far fewer were walking or cycling to work compared with May 2016. The number of Canadians walking or cycling to work declined by over one-quarter (-26.2%), falling from 1.1 million in 2016 to 811,000 in 2021, with their overall share of commuters falling from 6.9% to 6.2% during this period.
Despite the decline, Canadians (6.2%) were more likely to walk or cycle to work in 2021 compared with Americans (3.2%).
This decline in walking and biking to work reflects, in part, fewer jobs in accommodation and food services and retail trade in 2021. In 2016, nearly one-third (32.0%) of all Canadians who mainly commuted by foot or bicycle worked in accommodation and food services and retail trade.
The decline in commuting by foot or bicycle was most pronounced in Ontario (-37.8%), followed by Alberta (-31.1%).
Canada's largest cities—namely Montréal (89,000), Toronto (86,000) and Vancouver (62,000)—had the most commuters who mainly walked to work in May 2021. However, as a share of commuters overall, Canadians living in rural areas were more likely to walk to work (6.0%) than those living in one of the country's 111 mid-sized cities and small towns (5.1%) or in one of Canada's 41 largest cities (5.0%).
The likelihood of commuting on foot in the downtown cores of Canada's largest cities varied widely in 2021.
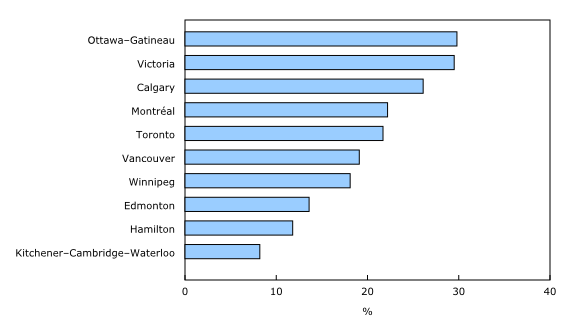
For example, 3 in 10 commuters living in downtown Ottawa–Gatineau (29.8%) usually walked to work in the spring of 2021, the highest rate among Canada's largest cities with at least 15,000 commuters living downtown. Conversely, fewer than one in eight commuters living in downtown Hamilton (11.8%) walked to work, the lowest rate among Canada's largest cities with at least 15,000 commuters living downtown.
Approximately 139,000 Canadians reported that they regularly bicycled to work in the spring of 2021, down 37.6% from five years earlier. Canadians living in a metropolitan area of 100,000 or more people (1.2%) or in smaller cities and towns (0.8%) were more likely to bicycle to work than those living in rural areas (0.6%).
In Victoria, approximately 1 in 20 commuters (5.3%) regularly biked to work in 2021, by far the highest rate among Canada's 41 largest cities, and perhaps not unexpected given Victoria's compact urban environment, relatively flat topography and generally mild winters.
Kelowna had the second-highest rate of bicycle commuting in 2021, at 2.0%, followed by Vancouver (1.9%).
Among the 41 biggest cities, the share of people commuting by bicycle was lowest in St. John's, Saint John and Oshawa, each at 0.2%.
Canadians aged 25 and older living in low income were much more likely to walk or bicycle to work, compared with higher-income Canadians in the same age group. Of those who were in low income in 2020, 10.4% walked or biked to work in 2021, compared with 5.5% of all other commuters.
Uptick in walking or biking to work in 2022
Approximately 1 in 20 Canadians (4.8%) mainly walked to work in May 2022, while around 1 in 60 (1.4%) bicycled.
While the numbers of Canadians in the provinces who were walking (+75,000) or bicycling (+78,000) to work in May 2022 were up slightly since the 2021 Census, active commuting overall was 11.9% below 2016 levels.
The number of people usually walking or cycling to work in May 2022 remained below 2016 levels in Ontario, Newfoundland and Labrador, Alberta, British Columbia, and Manitoba, and essentially returned to 2016 levels in the remaining five provinces.
Looking ahead
As the economy and labour market continue to adjust to the various impacts of the COVID-19 pandemic, so too will the commuting patterns of Canadians. Will working from home remain at historically high levels? Will public transit commuting return to pre-pandemic levels? Statistics Canada aims to continue regularly studying and collecting data to answer these and other commuting-related questions.
Note to readers
We encourage you to download the StatsCAN app to consult the census results.
Definitions, concepts and geography
The population growth rates (e.g., change in commuting) presented in this release are calculated by determining the difference in population size between two dates (such as between two censuses), divided by the population of the first date. They are expressed as a percentage change.
All the results presented in this release are based on 2021 geographic boundaries.
"Commuting" refers to anyone who usually travels to a workplace outside their residence. The term "usual" refers to the most common pattern for the worker, whether for a place of work or a mode of commuting. For example, if someone works the majority of a typical workweek or month at a fixed workplace address that is not their home, they would be identified as having a usual workplace and would be considered a commuter. For a mode of commuting, respondents identify the typical (usual) modes of commuting they use, and the one they use most often or for the longest distance.
In this release, the term "large urban centre" refers to a census metropolitan area (CMA). A CMA is an urban centre with 100,000 or more people. A census agglomeration is an urban centre with at least 10,000 people but fewer than 100,000 people.
Downtowns (or downtown neighbourhoods) are geographic areas that contain job-dense areas analogous to the central business district of a census subdivision (CSD), as well as adjacent areas of residential and mixed-use development. Downtowns are delineated from dissemination blocks and are classified into two groups: primary and secondary downtowns. Each CMA has one primary downtown, located in the historical central municipality CSD of the CMA. Some CMAs can have secondary downtowns located in CSDs without a primary downtown and with a population greater than 100,000 and employment counts greater than 50,000, based on data from the previous Census of Population. In this release, the term "municipality" refers to a census subdivision.
The term "Canadians" refers to residents of Canada, regardless of citizenship status.
Beginning in 2021, the census asked questions about both the sex at birth and the gender of individuals. While data about sex at birth are needed to measure certain indicators, for the purposes of this release, gender (as opposed to sex) is the standard variable used in concepts and classifications. For more details on the new gender concept, see Age, Sex at Birth and Gender Reference Guide, Census of Population, 2021.
Given that the non-binary population is small, data aggregation to a two-category gender variable is sometimes necessary to protect the confidentiality of responses provided. In these cases, individuals in the category "non-binary persons" are distributed into the other two gender categories. Unless otherwise indicated in the text, the category "men" includes men (and/or boys), as well as some non-binary persons. The category "women" includes women (and/or girls), as well as some non-binary persons.
A fact sheet on gender concepts, Filling the gaps: Information on gender in the 2021 Census, is also available.
For a detailed definition of the census language and geography concepts, please consult the Census Dictionary or see the conceptual videos.
Labour Force Survey, May 2022
In May 2022, the Labour Force Survey (LFS) asked supplemental questions related to place of work and commuting through the Labour Market Indicators program. Respondents were asked about where they completed their work, what modes of commuting they used, how often they worked at home and their freedom to choose where to work. The universe for the supplemental questions is respondents aged 15 to 69 who are not members of the regular Canadian Armed Forces and reside in the provinces, excluding reserves. In comparisons with census data in this release, the census also excludes the territories, regular Canadian Armed Forces members and reserves. More information on the Labour Market Indicators program, including the questionnaire, is also available. For more details on the main LFS, please consult the Guide to the Labour Force Survey.
2021 Census of Population products and releases
Today, Statistics Canada is releasing a seventh set of results from the 2021 Census of Population.
Several 2021 Census products are now available on the 2021 Census Program web module. This web module has been designed to provide easy access to census data, free of charge.
The analytical products include four articles in The Daily, a Census in Brief article and two infographics.
Additional Census in Brief articles will be released in the coming months.
The data products include the commuting results for a wide range of standard geographical areas, available through the Census Profile and data tables.
The Focus on Geography Series provides data and highlights on key topics in this Daily release at various levels of geography.
The reference materials are designed to help users make the most of census data. These include the Guide to the Census of Population, 2021, the Dictionary, Census of Population, 2021, the 2021 Census of Population questionnaires and the 2021 Census Data Quality Guidelines. The Commuting Reference Guide, Census of Population, 2021 is also available.
Geographic products and services related to the 2021 Census Program can be found under Census geography. This includes GeoSearch, an interactive mapping tool, and thematic maps, which show data for various standard geographic areas, along with the Focus on Geography series and the Census Program Data Viewer, which are data visualization tools.
Videos on census concepts can be viewed in the Census learning centre.
An infographic, Commuting in Canada during the COVID-19 pandemic: What changed from 2016 to 2021?, is also available.
November 30, 2022, marks the final major release from the 2021 Census of Population. Please see the 2021 Census release schedule for a full list of the topics that have already been released.
Contact information
For more information, or to enquire about the concepts, methods or data quality of this release, contact us (toll-free 1-800-263-1136; 514-283-8300; infostats@statcan.gc.ca) or Media Relations (statcan.mediahotline-ligneinfomedias.statcan@statcan.gc.ca).
- Date modified:


