
 StatCan COVID-19: Data to Insights for a Better CanadaYouth—but not adults—reported less physical activity during the COVID-19 pandemic

Archived Content
Information identified as archived is provided for reference, research or recordkeeping purposes. It is not subject to the Government of Canada Web Standards and has not been altered or updated since it was archived. Please "contact us" to request a format other than those available.
by Jenny Watt and Rachel C. Colley
Text begins
Fewer youth aged 12 to 17 met Canadian physical activity recommendations during the COVID-19 pandemic
Over one-third (37.2%) of youth aged 12 to 17 met the Canadian physical activity recommendations during the COVID-19 pandemic compared with half (50.8%) of youth pre-pandemic (Chart 1). In contrast, there was no significant change in the percentage of adults aged 18 to 64 meeting the recommendations. Seniors increased their physical activity: 35.4% of older adults aged 65 and over met the recommendations in 2018 versus 40.3% in 2020.Note These findings come from the fall collection periods of the 2018 and 2020 cycles of the Canadian Community Health Survey (CCHS), which used series of questions on physical activity in the past week to assess whether respondents reported accumulating the amount of moderate-to-vigorous physical activity recommended by the 2020 Canadian 24-Hour Movement Guidelines.

Data table for Chart 1
| Fall 2018 (Pre-COVID) | Fall 2020 (During COVID) | |
|---|---|---|
| percentage | ||
| Youth (12 to 17) | 50.8 | 37.2Note ** |
| Adults (18 to 64) | 57.1 | 57.1 |
| Older adults (65+) | 35.4 | 40.3Note ** |
|
||
The COVID-19 pandemic has been accompanied by various physical distancing measures (e.g., school closures, work-from-home policies), and prolonged restrictions may lead to reduced engagement in physical activity. Results from two Canadian studies suggest that physical activity decreased among Canadian adults during the initial months of the pandemic (Woodruff et al., 2021; Lesser and Neinhaus, 2020). Another study finds that physical activity among adults decreased initially but later returned to pre-pandemic levels (Sebastiano et al., 2020). The current study compares data from fall 2018 (pre-COVID) to fall 2020 (during COVID) to examine changes in physical activity for youth (aged 12 to 17), adults (aged 18 to 64), and older adults (aged 65 and older).
Less gym, fewer organized sports, and isolation from friends: youth reported less physical activity through recreation and school
Although policies aimed at controlling the spread of COVID-19 have varied across the country, Canadian youth and adults have been generally asked to limit contact with people outside of their household, which reduces opportunities for physical activity outside of the home. Additionally, many youth across Canada have been affected by school closures and by restrictions on physical education and organized sports,Note while many adults have been affected by work-from-home policies (Mehdi & Morissette, 2021) and other changes in employment status (Statistics Canada, 2021).
Youth were asked about physical activity from four sources: active transportation (e.g., walking or cycling to get to and from places), recreation (e.g., participation in sports outside of school), school (e.g., gym class), and household chores. Comparing fall 2018 and fall 2020, youth reported significantly fewer average daily minutes of physical activity from recreation and school (Chart 2.a). Physical activity from recreation decreased from an average of 27.0 minutes per day in 2018 to 20.3 minutes in 2020, and the average time spent on physical activity at school fell from 24.7 to 13.0 minutes per day. There was no significant difference in reported physical activity achieved through active transportation or household chores. Results were similar for boys and girls.
Adults and older adults were asked about physical activity from three sources: active transportation, recreation, and household/occupation (i.e., physical activity from household chores or work or volunteering). Comparing fall 2018 and fall 2020, adults aged 18 to 64 reported more average daily minutes of physical activity accrued through recreation, although the difference only amounted to a couple of extra minutes per day (13.6 minutes in 2018 to 15.5 in 2020; Chart 2.b). Among older adults aged 65 and over, there was an increase in physical activity accumulated through household chores or workvolunteering (7.0 to 10.3 average daily minutes). Results were similar for men and women.
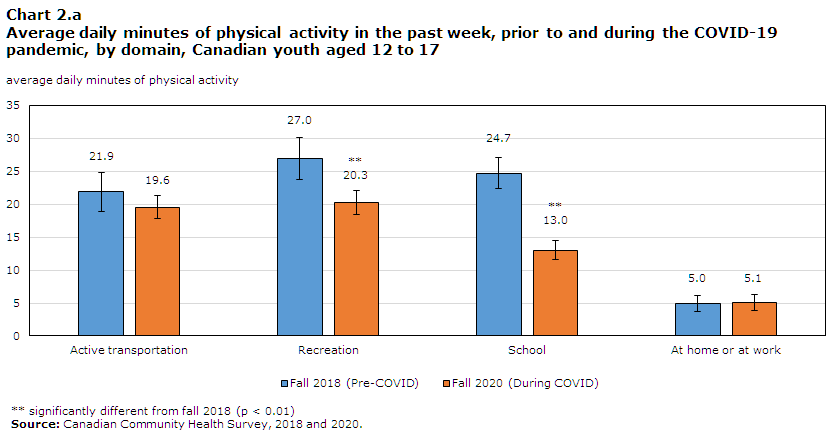
Data table for Chart 2.a
| Fall 2018 (Pre-COVID) | Fall 2020 (During COVID) | |
|---|---|---|
| average daily minutes of physical activity | ||
| Active transportation | 21.9 | 19.6 |
| Recreation | 27.0 | 20.3Note ** |
| School | 24.7 | 13.0Note ** |
| At home or at work | 5.0 | 5.1 |
|
||

Data table for Chart 2.b
| Fall 2018 (Pre-COVID) | Fall 2020 (During COVID) | |
|---|---|---|
| average daily minutes of physical activity | ||
| Active transportation | ||
| 18 to 64 | 13.1 | 12.8 |
| 65+ | 8.5 | 11.1Note ** |
| Recreation | ||
| 18 to 64 | 13.6 | 15.5Note ** |
| 65+ | 8.8 | 8.8 |
| At home or at work | ||
| 18 to 64 | 16.0 | 15.9 |
| 65+ | 7.0 | 10.3Note ** |
|
||
Workers who worked from home reported less physical activity
While levels of physical activity among working-age adults did not change significantly between fall 2018 and fall 2020, results varied by whether workers worked from home for the purposes of protecting themselves or others from COVID-19. Workers who worked from home due to the pandemic reported 40.9 daily minutes of physical activity, on average, which is fewer than the 49.8 daily minutes reported by other workers (Chart 3). This is explained by fewer minutes of physical activity accumulated through active transportation (11.7 versus 13.5 average daily minutes) and household/occupation (11.3 versus 22.3 average daily minutes) among those who worked from home compared with those who did not work from home. However, workers who worked from home due to the pandemic reported more minutes of physical activity from recreation (18.1 versus 14.1 average daily minutes). This suggests that workers who worked from home due to the pandemic may have been able to transition to other forms of physical activity, such as at-home workouts or recreational walks in their neighbourhoods.

Data table for Chart 3
| Teleworking | Not teleworking | |
|---|---|---|
| average daily minutes of physical activity | ||
| Active transportation | 11.4 | 13.5Note * |
| Recreation | 18.4 | 14.1Note ** |
| At home or at work | 11.0 | 22.3Note ** |
| Total | 40.7 | 49.8Note ** |
Source: Canadian Community Health Survey, 2018 and 2020. |
||
Did You Know?
In the fourth quarter of 2020 (October through December), Canadians spent an estimated $211.4 million on exercise equipment at retail stores—an increase of 24% from the fourth quarter of 2018.
Source: Table 20-10-0016-01, retail commodity survey, retail sales.
Data sources and methodology
This study uses data from the 2018 and 2020 cycles of the Canadian Community Health Survey (CCHS), an annual cross-sectional survey that collects information related to health status, health care utilization, and health determinants for the Canadian population. Although data for both years are from the CCHS, the 2020 cycle of the survey had some differences. In March 2020, the CCHS collection was paused and did not resume until September 2020— at which point the collection periods transitioned from 3 month periods to five week periods. In person interviews were halted for the CCHS and collection was only completed via telephone interview.
Some bias was discovered in the 2020 cycle of CCHS, which is likely attributed to the limitations to survey collection in the pandemic, including the decreased response rate and the use of telephone interviews only. Based on weighted estimates, results show that respondents interviewed during the pandemic (September to December 2020) appear to have slightly higher educational attainment and they were slightly more likely to own their place of residence compared to previous cycles.
As for previous CCHS cycles, survey weights were adjusted to minimise any potential bias that could arise from survey non-response; non-response adjustments and calibration using available auxiliary information were applied and are reflected in the survey weights provided with the data file. Extensive validations of survey estimates were also performed and examined from a bias analysis perspective. Despite these rigorous adjustments and validations, the high non-response increases the risk of a remaining bias and the magnitude with which such a bias could impact estimates produced using the survey data. Therefore, users are advised to use the CCHS 2020 data with caution, especially when creating estimates for small sub-populations or when comparing to other CCHS years.
This study compares physical activity before and during the COVID-19 pandemic by comparing the September-through-December 2020 data from the 2020 CCHS to the October-through-December data from the 2018 CCHS.Note The study reports the percentage of youth, adults, and older adults meeting the Canadian physical activity recommendations. The 2020 Canadian 24-Hour Movement Guidelines provide recommendations on sleep, sedentary behaviour, and physical activity for various age groups (Canadian Society for Exercise Physiology, 2021). Following these guidelines is associated with a lower risk of mortality, lower risk of several health conditions (e.g., hypertension, type 2 diabetes), improved bone health, improved cognitive functioning, and improved physical functioning. Youth (aged 12 to 17) should accumulate 60 minutes of moderate-to-vigorous physical activity per day. Adults (aged 18 to 64) and older adults (aged 65 and over) should accumulate 150 minutes of moderate-to-vigorous aerobic physical activity per week. For this study, the percentage of individuals meeting the physical activity recommendations specific to their age group was estimated by using responses to a series of questions on physical activity in the last week. For the analysis involving work-from-home status, the sample was restricted to respondents who worked in past week.
This analysis focuses on differences that are statistically significant at the 5% level. Survey sampling weights were applied to the data.
References
British Columbia Ministry of Education. (2021, April 16). Provincial COVID-19 Health & Safety Guidelines for K-12 Setting.
Canadian Society for Exercise Physiology. (2020). “Canadian 24-Hour Movement Guidelines.”
Di Sebastiano, K.M., T. Chulak-Bozzer, L.M. Vanderloo, and G. Faulkner. 2020. “Don’t walk so close to me: Physical distancing and adult physical activity in Canada.” Frontiers in Psychology 11: 1895.
Lesser, I.A., and C.P. Nienhuis. 2020. “The impact of COVID-19 on physical activity behavior and well-being of Canadians.” International Journal of Environmental Research and Public Health 17 (11): 3899.
McCarthy H., Potts H., and A. Fisher. 2020. “Physical Activity Behavior Before, During, and After COVID-19 Restrictions: Longitudinal Smartphone-Tracking Study of Adults in the United Kingdom.” J Med Internet Res 23 (2): e23701.
Mehdi, T. and R. Morissette. 2021. Working from home: Productivity and preferences. StatCan COVID-19: Data to Insights for a Better Canada. Statistics Canada Catalogue no. 45-28-0001. Ottawa: Statistics Canada.
Ontario Ministry of Education. (2021, March 2). Guide to reopening Ontario’s schools.
Statistics Canada. 2021. Labour Force Survey, December 2020. The Daily. January 1. Statistics Canada Catalogue no. 11-001-XIE.
Statistics Canada. Table 20-10-0016-01: Retail commodity survey, retail sales (x 1,000).
Woodruff, S.J., P. Coyne, and E. St-Pierre. 2021. “Stress, physical activity, and screen-related sedentary behaviour within the first month of the COVID-19 pandemic.” Applied Psychology: Health and Well-Being. Forthcoming.
- Date modified: