State of the union: Canada leads the G7 with nearly one-quarter of couples living common law, driven by Quebec
Released: 2022-07-13
Sharing a home with one's spouse or partner can provide a special bond and source of support when navigating life's ups and downs. Couples are one of the key decision-making units in society, where choices are often made about having children, what to buy and where to live and work.
While diverse forms of couplehood have always existed, recognition of different types of couples has increased as society has evolved.
Many individuals entering new relationships have children from a previous relationship, leading to the creation of stepfamilies. Members of these stepfamilies may live together only part of the time, meaning that decisions about housing, expenditures, parenting and other aspects of family life could involve additional people outside of the couple itself.
For many couples, the fallout of the COVID-19 pandemic was a major disruption within the home. Some became seriously ill, lost their job or worked fewer hours, while others had to adapt quickly to the new reality of one or both members of the couple working from home. Lockdowns and physical distancing measures may have led to new sources of stress and disagreements, but may also have led to greater closeness within families. Those with children at home encountered new challenges in the form of virtual schooling, decisions about whether and when to vaccinate, and emerging concerns about the well-being of their children.
In this context, the 2021 Census of Population took a snapshot of Canada's 8.6 million couples. It reveals that the face of romantic relationships continues to become more diverse, and differs considerably across generations and regions of the country.
Highlights
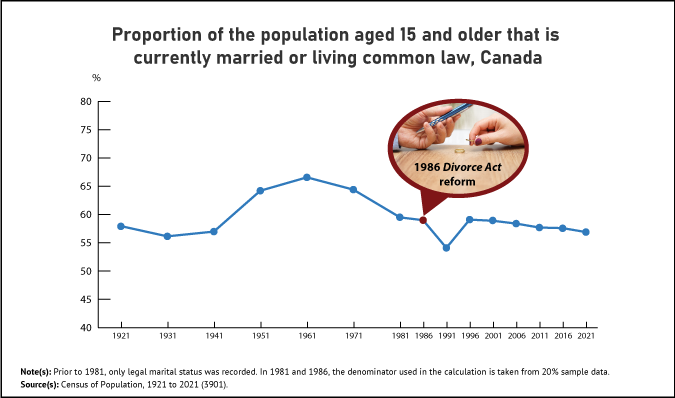
It has remained a constant over the last century that most adults aged 15 and older live with a spouse or partner. In 2021, 57% of adults were part of a couple, similar to the proportion exactly 100 years earlier, in 1921 (58%).
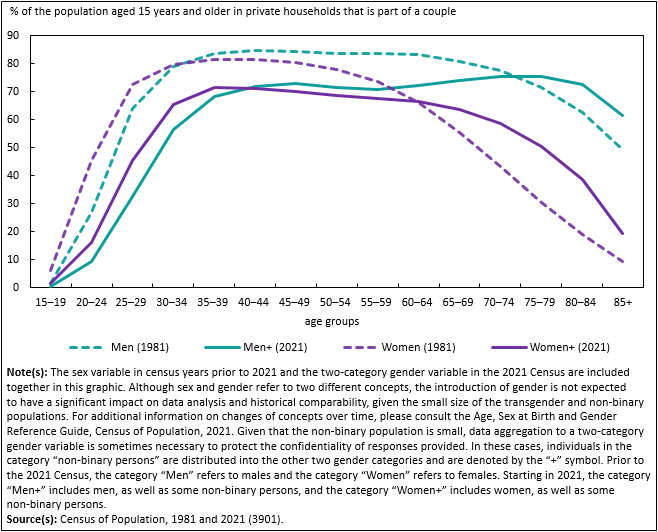
Owing largely to population aging, the median age of people in couples has increased over time. Additionally, as men are living longer on average than in the past, a higher percentage of women are remaining in couples at older ages. Over half (52%) of women aged 65 and older were in a couple in 2021, up from 41% in 1981.
Compared with previous generations, today's younger adults are less likely to be living as part of a couple—as alternatives like living alone, with roommates or with parents have become more common. While more than two-thirds (68%) of people aged 25 to 29 were in a couple in 1981, this was the case for just under two-fifths (39%) of people in this age group in 2021.
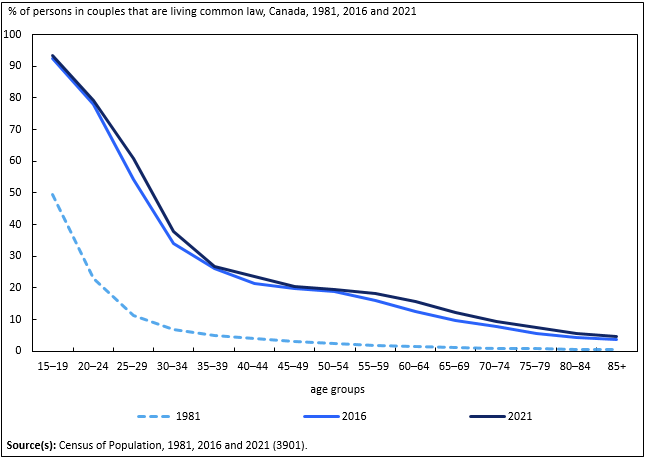
When young adults do pair off, living common law is the norm. In 2021, nearly 8 in 10 people aged 20 to 24 who were part of a couple (79%) were living with a common-law partner. However, living common law is also gaining popularity at older ages, accounting for 16% of people aged 55 to 69 in couples, up from 13% in 2016.
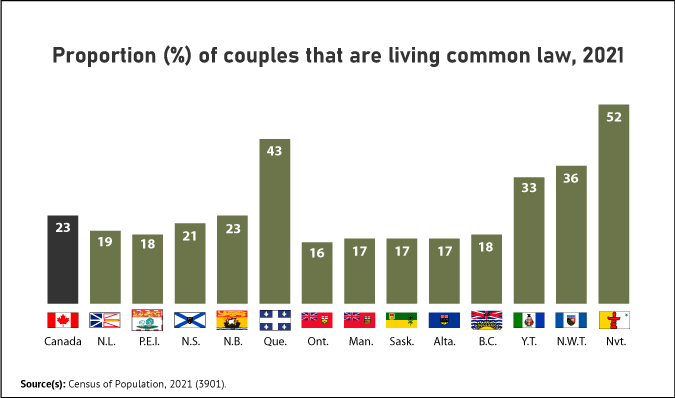
From 1981 to 2021, the number of common-law couples increased by 447%, a much faster growth than that of married couples over the same period (+26%). Still, marriage remains the predominant type of union. In 2021, more than three-quarters (77%) of couples were married, with the remaining 23% living common law.
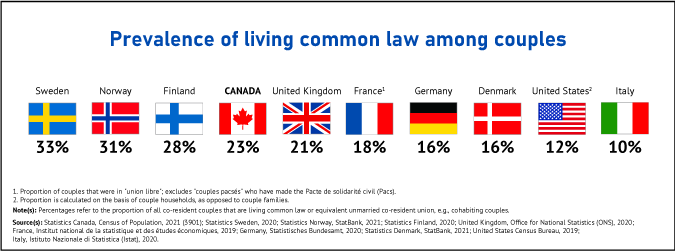
Among G7 countries, Canada has the highest share of couples that are living common law (23%), mainly due to the popularity of this type of union in Quebec—home to more than two-fifths (43%) of Canada's common-law couples. Excluding Quebec, the share of common-law couples in Canada would have been 17% in 2021.
For the first time, the majority of couples in Nunavut (52%) were living common law in 2021. The prevalence of living common law in this territory reflects the much younger age structure of the population compared with other parts of Canada, but may also reflect cultural preferences.
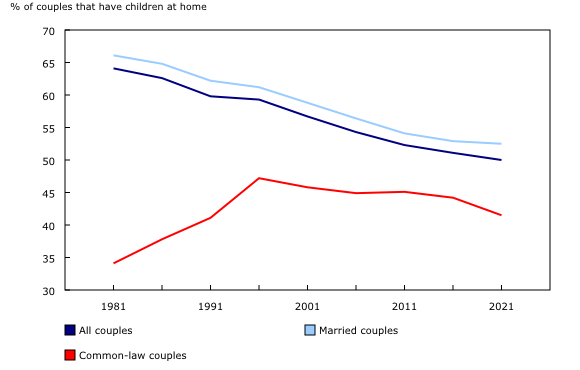
The combined trends of population aging and decreasing fertility have resulted in relatively fewer couples with children living at home with them. Half (50%) of couples in 2021 had children of any age living with them, down from 51% in 2016 and 64% in 1981.
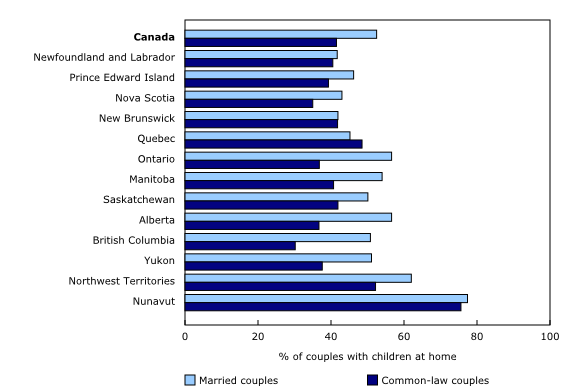
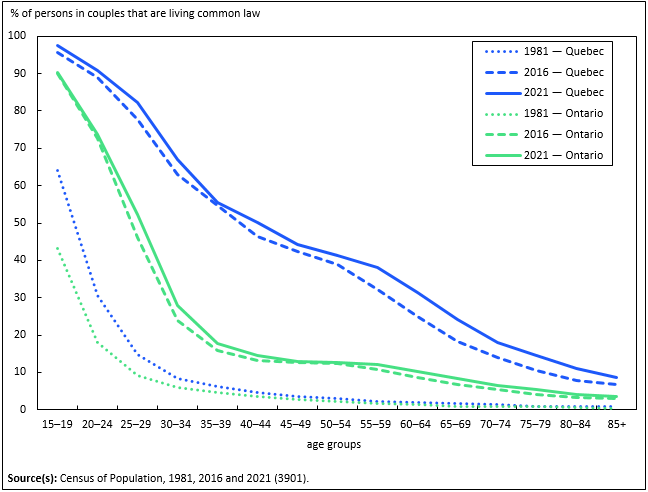
While living common law drops sharply after young adulthood in other provinces, this is not the case in Quebec. Furthermore, common-law couples in Quebec were more likely to have children living at home (49%) than their married counterparts (45%), as has been the case since 2011.
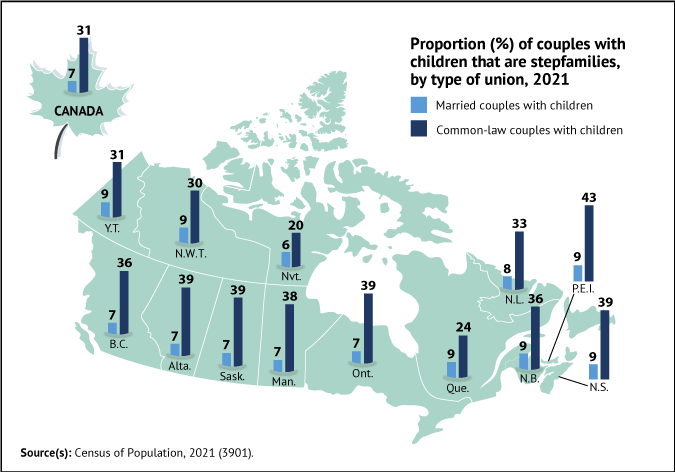
Among couples with children, those living in a common-law relationship were more than four times as likely to be stepfamilies (31%) as their married counterparts with children (7%), suggesting that parents may prefer to live common law when they re-partner.
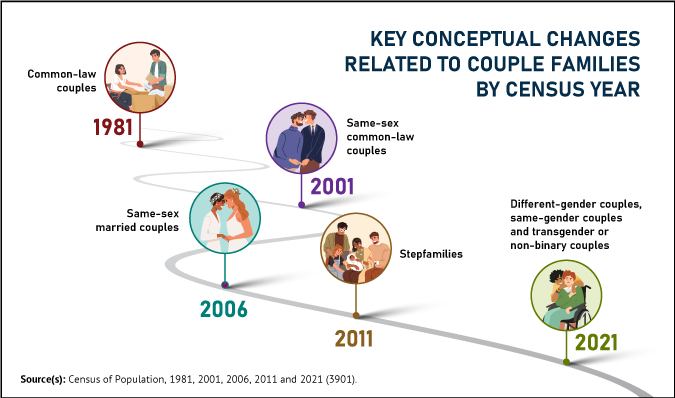
Today, Statistics Canada releases census information on the gender diversity status of couples for the first time. In 2021, of the 8.6 million couples in Canada, 32,205 included at least one transgender or non-binary person. Same-gender couples, that is, couples in which there were either two women or two men, and both members were cisgender, numbered 95,435. Together, same-gender, transgender or non-binary couples represented 1.5% of all couples in the country.
Most adults have a spouse or partner, as has been the case for the last 100 years
Despite the growing diversity of Canada's population and major changes to the daily realities of life, it remains true that most adults (aged 15 and older) are part of a couple. Indeed, the share of adults who are in a couple has been remarkably stable if we compare 2021 (57%) with a century earlier, in 1921 (58%).
Small variations in the share of adults in couples over the last century reflect social changes. For instance, from the 1950s to the late 1970s, a surge of marriages and the baby boom occurred as adults married and had children at historically young ages. In turn, two-thirds (67%) of adults were in couples in 1961—the peak share over the last century.
In the decades following the baby boom, other societal developments during the last half of the 20th century brought more choice and independence for many individuals—particularly women—to postpone or forgo living as part of a couple, if they desired. These developments included the legalization of the contraceptive pill, greater participation by women in higher education and the paid labour force, and the coming into force of the Divorce Act in 1968 and the subsequent reduction of the separation period required for "no-fault" divorces from three years to one year in 1986.
The slight decrease in the share of adults who were part of a couple from 1996 (59%) to 2021 (57%) is largely related to the aging of the population. While the rates of living in a couple have increased for more recent generations of older adults compared with their predecessors, the share of people aged 65 and older in couples in 2021 (62%) was still lower than for people aged 35 to 64 (70%).
More older women but fewer younger adults in couples
In recent decades, the share of older adults living as part of a couple has increased, reflecting gains in men's life expectancy and therefore converging life expectancy between women and men. From 1980 to 2020, men's life expectancy at birth increased faster (from 71.6 years to 79.5 years) than it did for women (from 78.8 years to 84.0 years) over the same period. Previous studies have shown that among older adults, living as part of a couple is associated with greater longevity and lower likelihood of experiencing social isolation, particularly among older women.
As men are living longer on average than in the past, a higher percentage of women are remaining in couples at older ages. Over half (52%) of women aged 65 and older were in a couple in 2021, up from 41% in 1981.
Despite the narrowing gap in their life expectancies, women still live longer than men, on average, and men are more likely to re-partner at older ages. As a result, older men remain more likely to be part of a couple than older women. In 2021, close to three-quarters (74%) of men aged 65 and older were part of a couple, virtually unchanged from 1981 (75%).
Fewer of today's younger adults are part of a couple compared with previous generations. This decline in unions was largest for men and women aged 25 to 29, falling from 68% in 1981 to 43% in 2016 and then to 39% in 2021. The pursuit of higher education and starting a career, increasing delays in the onset of childbearing and the growing prevalence of young adults living in the parental home are among the trends that have contributed to this pattern. Additionally, a growing share of young adults live apart from their romantic partner (see Box below).
Can't live with them, can't live without them: Almost 3 in 10 young adults not living with a spouse or partner are in a "living apart together" relationship
The Census of Population only identifies co-residing couple relationships, but some people may live apart from their spouse or partner by choice or as a result of circumstances. This is especially the case among young adults aged 20 to 34 who were neither married nor living common law: according to the Canadian Social Survey – Well-being, Unpaid Work and Family Time, close to 3 in 10 (29%) in 2021 were in this situation—a higher share than that for all adults aged 15 and older (17%).
Canada has the highest share of common-law couples among G7 countries, owing mainly to the popularity of this union in Quebec
From 1981 to 2021, the number of common-law couples increased by 447%, much faster than that of married couples over the same period (+26%). In fact, the number of married couples even decreased in Quebec (-17%), Newfoundland and Labrador (-10%), and New Brunswick (-2%) over this 40-year period.
Still, marriage remains the predominant type of union. In 2021, more than three-quarters (77%) of couples were married, with the remaining 23% living common law.
According to recent data, the prevalence of common-law unions in Canada is the highest among G7 countries, mostly because of the popularity of this union in Quebec. Excluding Quebec, the share of common-law couples in Canada would have been 17% in 2021.
While Canada has the highest share of couples living common law among the G7, it is still lower than in most Nordic countries (Norway, Sweden, Finland)—a pattern reflecting different societal attitudes and legal frameworks with respect to cohabitation and childbearing outside of marriage.
The prevalence of common-law unions in Nunavut (52%), Quebec (43%) and the Northwest Territories (36%) is higher than in Sweden, which is the country with the highest rate of common-law unions at the national level (with one-third of couples living common law).
Common law is the norm among young adults, growing in prevalence at older ages
In young adulthood, most couples live common law. Nearly 8 in 10 (79%) people aged 20 to 24 in couples in 2021 were not married.
Living common law drops rapidly from ages 25 to 34, then declines more slowly to reach its lowest levels in the oldest age group. Among people aged 85 and older in couples, 5% were living common law.
Over the 40 years preceding the 2021 Census, living common law has grown in prevalence at all ages, but increased most rapidly during young adulthood. Among people aged 20 to 24 who were part of a couple, 23% were living common law in 1981 compared with 79% in 2021.
From 2016 to 2021, growth in the number of common law couples has also been relatively strong at ages 55 to 69—representing 16% of persons in couples in this age group in 2021, up from 13% in 2016. People in this age group in 2021 comprise the bulk of the baby boomer generation, a group that is more likely to have experienced multiple unions over their lifetimes than previous generations. Following divorce, older adults are increasingly choosing to live common law when they re-partner.
For better or worse, couples have likely been affected by the COVID-19 pandemic
Because of the pandemic, some couples have experienced unexpected major changes to their lives, such as illness, job loss, income reduction and less social interaction. These shocks could change the relationship dynamic considerably, if, for example, the balance of earnings within the couples changed. It has been found, for instance, that early in the pandemic, women experienced greater year-over-year employment loss than men.
In the wake of the pandemic, spouses and partners had to make new decisions jointly around physical distancing, social bubbles, vaccination, and family planning, among other emerging issues. Some couples with children had different perceptions as to whether each spouse or partner was pulling their fair share of the weight with respect to parental tasks and homeschooling.
According to the 2021 Canadian Social Survey – Well-being, Unpaid Work and Family Time, more than one-fifth (22%) of adults who were part of a couple in which both spouses or partners were currently employed reported that both were working from home at least part of the time. These couples may have faced new challenges in the form of limited work space and a lack of privacy.
Many family researchers examining the impacts of the pandemic on couple relationships argue that it likely amplified the relationship quality within the couple, for better or worse. For spouses and partners who were already experiencing relationship difficulties, the added stresses of the pandemic could lead to increased tension, and possibly the desire to separate or end the relationship.
At the same time, the circumstances of the pandemic have made it difficult in practical terms for couples to physically separate from one another. Married couples who were contemplating divorce or in the process of it faced closures and delays in the courts systems, leading to a slowdown in the number of divorce applications being filed and granted. Because of this, the number of divorces registered in Canada decreased by 25% from 2019 to 2020, the largest annual percentage drop on record.
In contrast, for couples who had strong relationships prior to the pandemic—and for whom the impacts of the pandemic were less detrimental—the increased time together, joint decision-making and reliance on one another may have helped spouses or partners navigate and endure the evolving challenges of this unprecedented period.
For the first time, the majority of couples in Nunavut are common law
While common-law relationships have grown in popularity in all areas of the country, there is considerable variation in how prevalent these couples are across the provinces and territories.
For the first time, in 2021, more than half (52%) of couples in Nunavut lived common law. The higher prevalence of common-law unions in this territory largely reflects the much younger age structure of the population compared with other parts of Canada, but may also reflect to some extent different cultural preferences.
More than 4 in 10 (43%) couples in Quebec—the second most populous province in the country—were living common law in 2021. Among the provinces, Quebec has had the largest share of couples living common law in every census year since these couples were first tracked in 1981. In contrast, fewer than 2 in 10 couples were living common law in Ontario, British Columbia, the three Prairie provinces, as well as Prince Edward Island and Newfoundland and Labrador.
Quebec was home to more than two-fifths (43%) of Canada's common-law couples in 2021, a share virtually unchanged since 2001 (44%).
More couples living common law in rural parts of the country, compared with urban areas
Across different regions within the provinces and territories, the share of common-law couples varies, reflecting their distinct sociocultural and demographic settings.
In Canada's large urban centres (census metropolitan areas), 21% of couples lived common law, just below the national average of 23%. Canada's large urban centres tend to have relatively larger populations of immigrant and racialized groups where marriage is more prevalent. This was particularly the case in Toronto (12%) and Abbotsford–Mission (13%).
In comparison with large urban centres, common-law relationships were more prevalent among couples living in smaller urban centres (census agglomerations) or in rural areas outside urban centres (27% for each).
Canada's municipalities (census subdivisions) also showed considerable diversity in terms of the makeup of couples. For instance, marriage is ubiquitous in Stanley, Manitoba, where 99% of couples were married; similar proportions were found in the neighbouring municipalities of Rhineland (98%) and Winkler (96%). According to the 2011 National Household Survey, these three rural municipalities had a relatively large population that is German-speaking and affiliated with the Mennonite religion.
In contrast, in several communities in the outer suburbs surrounding Québec and Montréal, living common law is the norm for couples. Over two-thirds (68%) of couples in Sainte-Brigitte-de-Laval were common law, as were over 6 in 10 couples in Saint-Apollinaire (64%), Stoneham-et-Tewkesbury (63%), Saint-Lin-Laurentides (63%) and Sainte-Catherine-de-la-Jacques-Cartier (61%). These suburban towns have experienced large population growth in recent years, often with new housing developments focused on young families.
Population aging and declining fertility lead to fewer couples with children at home
Continuing a trend of gradual decline over the last four decades, half (50%) of couples in 2021 had children of any age living with them at home, down from 51% in 2016 and 64% in 1981.
The census identifies families based on the usual place of residence of individuals. Because of this, couples with older children who do not live in their household—because they have established their own families or households—are identified in the census data as not having children present in the home.
The decrease over the last five years in the share of couples with children at home was driven by common-law couples, as the proportion of married couples that had children held steady at 53%. Following the rapid growth in the share of common-law couples with children at home in the 1980s and 1990s, there was a plateau throughout the 2000s, followed by a decrease from 2016 (44%) to 2021 (42%).
Two key demographic trends have contributed to the decrease in the share of couples with children at home: population aging and lower fertility.
Population aging—combined with a higher rate of older adults living as part of a couple compared with previous generations—means that couples are getting older on average and that they are at stages of life where having children at home is less likely. This was especially the case for people in married unions who had an older median age (55.2 years) than people in common-law unions (41.2 years).
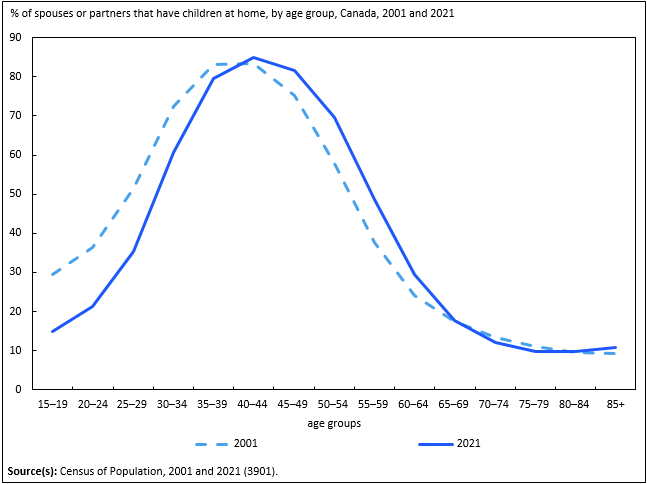
In addition to population aging, Canada's total fertility rate has been trending downward since 2008, reaching a record low of 1.40 children per woman in 2020. Additionally, the average age of childbearing has steadily increased, from 26.7 years in 1976 to 31.3 years in 2020. As a result of these shifts to lower and later fertility, the proportion of younger adults in couples that have children at home decreased over time, particularly in the last 20 years. For instance, in 2001, over half (51%) of spouses or partners aged 25 to 29 had a child at home. By 2021, this share had decreased to 35%.
Among people aged 40 to 64, however, the share of spouses or partners with a child at home has increased over the last 20 years. This increase was largest among spouses or partners aged 50 to 54, where 70% had a child at home in 2021, compared with 58% in 2001. The rising trend among older adults in couples to have children at home reflects increases in both the average age of childbearing and young adults living with their parents.
The pandemic also led nearly one-quarter of adults to change their plans about having children, mostly delaying or having fewer children than previously planned. In this context, it is expected that the share of couples with children at home will continue to decrease in the coming years.
Urban Canada, particularly the Greater Toronto Area, has more couples with kids at home
Generally, couples living in Canada's urban centres (census metropolitan areas and census agglomerations) were more likely to have children at home (52%) in 2021 than those living outside of these areas (41%). This reflects the fact that rural areas of the country have an older age composition and are aging faster than the urban population. An exception to this pattern was in Nunavut, where close to 8 in 10 couples had children at home, owing to its higher fertility and the exceptionally young age structure of its population.
About 6 out of 10 couples in Toronto (60%) and Oshawa (59%) had children at home, the highest shares among large urban centres. Within the Greater Toronto Area, having children at home was typical among couples in the municipalities of Milton (71%), Brampton (69%), Ajax (68%), Vaughan and Bradford West Gwillimbury (66% each) and Oakville (65%)—reflecting the fact that these suburban communities tend to attract young families. In contrast, relatively fewer couples had children at home in Qualicum Beach (19%), Nanaimo E (23%) and Parksville (25%) in British Columbia, as well as Elliot Lake, Ontario (26%), smaller urban centres known for their retirement communities.
In Quebec, children are more prevalent in common-law couples than in married couples
Unlike Canada as a whole, common-law couples in Quebec were more likely to have children living at home (49%) in 2021 than their married counterparts (45%), as has been the case since 2011. The greater prevalence of common-law couples with children in Quebec, compared with other provinces and territories, may reflect in part the unique legal and cultural setting of this province.
The prevalence of living common law drops sharply after young adulthood in all provinces and territories, with the exceptions of Quebec and Nunavut. This suggests that while in many parts of Canada, living common law appears to serve mainly as a "prelude" to marriage among young adults in many parts of Canada—and to a lesser extent, a "post-script" to marriage—this living arrangement may function more as an alternative to marriage for many Quebec (link in French only) and Nunavut residents.
Several countries, namely Norway, Iceland and Slovenia, have also seen proportionately more common-law couples with children than married couples with children in recent years (0.6 MB, link in PDF format only).
Common-law couples with children are more than four times as likely to be stepfamilies as their married counterparts
While many spouses and partners are experiencing their first union, others are separated or divorced from one or more previous marriages or common-law unions. The presence of children from previous relationships means many couples must navigate and negotiate parenting time arrangements, child support and other parenting decisions across two or more households. In 2021, just over 1 in 10 couples with children (12%) were stepfamilies, meaning that their family included at least one biological or adopted child whose birth preceded the current union. This proportion has been stable since data on stepfamilies were first collected in the 2011 Census.
For more information on the living arrangements of children, see Home alone: More persons living solo than ever before, but roomies the fastest growing household type.
Among couples with children, those living common law were more than four times as likely to be stepfamilies (31%) as their married counterparts with children (7%). This suggests that individuals may have a preference for living common law when they re-partner after having children.
The physical distancing measures and travel restrictions that have arisen throughout various stages of the pandemic are likely to have created new challenges for couples in which at least one member co-parents children with an ex-spouse or ex-partner. According to the 2021 Canadian Social Survey – Well-being, Unpaid Work and Family Time, 5% of adults who experienced a change in their living arrangements because of the pandemic reported that at least one of their children now spent more or less time at the home of their other parent or guardian.
For more information on families, see the infographic A portrait of Canada's families in 2021.
Gender diversity status of couples is captured for the first time: About 1 in every 250 couples include at least one transgender or non-binary person
In the 2021 Census, couples could be classified according to their gender diversity status for the first time.
Gender diversity status refers to whether both members of a couple are cisgender—meaning their reported gender corresponds to their reported sex at birth—or whether at least one member is transgender or non-binary. In addition, among cisgender couples, a distinction can be made between those composed of two people of different genders (a different-gender couple) and those composed of two people of the same gender (a same-gender couple).
The ability to identify the prevalence and distribution of gender diversity among couples represents another step in Statistics Canada's continuing efforts to better reflect societal changes and produce statistical information on diverse population groups.
In 2021, most (98.5%) of Canada's 8.6 million couples were different-gender couples, meaning they included one woman and one man, both of whom were cisgender.
An additional 1.5% of couples (127,640) were either same-gender couples, transgender couples or non-binary couples.
Same-gender couples, that is, a couple in which there were either two women or two men, and both members were cisgender, represented 1.1% of all couples.
Transgender or non-binary couples, in which at least one member was transgender or non-binary, represented about 1 in every 250 couples (0.4%). Within this group, transgender couples (a couple in which at least one member was transgender and neither member was non-binary) outnumbered non-binary couples (in which at least one member was non-binary) by about 2 to 1.
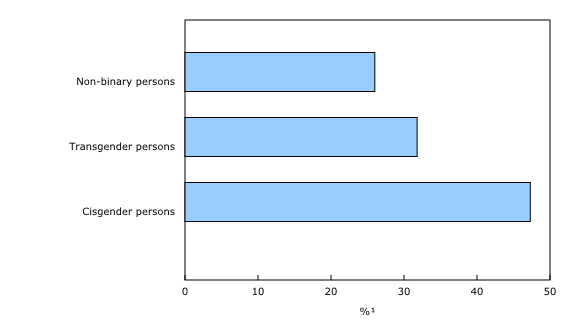
Reflecting in part their younger average ages, the proportion of people that were living in a couple was lower among the transgender (32%) and non-binary (26%) populations than for the cisgender population (47%).
Most same-gender couples with children are composed of two women
Among same-gender couples with children, nearly four in five (79%) were couples with two women. Moreover, the share of same-gender couples that were married—as opposed to common law—was slightly higher among couples with two women than among couples with two men.
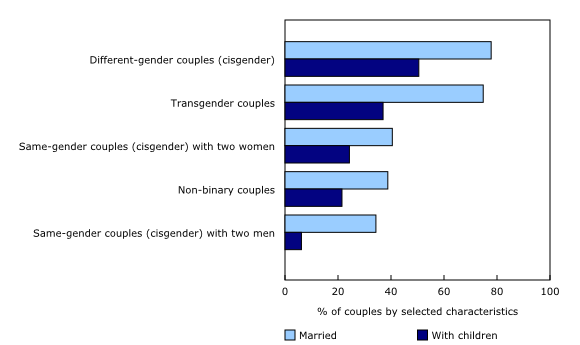
Overall, the share of same-gender couples that were married (37%) was less than half that of different-gender couples (78%). Same-gender couples were also less likely to have children living at home with them (15%) than different-gender couples (50%).
Non-binary couples are younger, mainly living common law without children
The demographic characteristics of transgender couples and non-binary couples were found to differ substantially. For instance, the median age of people in transgender couples (52.8 years) was similar to that of people in different-gender couples (52.4 years), but was higher than that of people in same-gender couples (44.0 years) or non-binary couples (32.0 years).
As with their age profiles, transgender couples and non-binary couples differed by type of union and the presence of children at home. Again, transgender couples had characteristics that were more similar to those of different-gender couples than same-gender couples or non-binary couples. For instance, 75% of transgender couples were married, compared with 78% of different-gender couples and 39% of non-binary couples.
Among transgender people in couples, most (63%) were transgender women and 37% were transgender men. Over half (54%) of transgender people in couples were transgender women in a union with a cisgender man.
Same-gender, transgender or non-binary couples are more prevalent in Canada's large urban centres, particularly their downtowns
Echoing the regional differences observed among the transgender or non-binary populations, transgender or non-binary couples were more prevalent in Canada's large urban centres, particularly in Victoria (0.8%), Halifax (0.7%) and Fredericton (0.7%).
While transgender or non-binary couples were somewhat less prevalent in Quebec, this province recorded the highest share of same-gender couples among the provinces (1.4%). In general, same-gender couples accounted for a much higher share of all couples in the downtown parts of large urban centres, especially in the downtowns of Toronto (8.6% of all couples), Vancouver (8.5%), Québec (6.8%) and Montréal (6.3%).
Close to two-fifths of same-gender couples with children are stepfamilies
Among couples with children, stepfamilies were considerably more common for same-gender couples (39%) than for different-gender couples (12%), transgender couples (16%) or non-binary couples (22%).
In almost three-quarters (74%) of stepfamilies composed of same-gender, transgender or non-binary couples, all the children in the family were the biological or adopted child of only one spouse or partner in the couple. This share was relatively lower among stepfamilies composed of two cisgender persons of different genders (62%).
Looking ahead
In the coming months, subsequent releases from the 2021 Census of Population will shed further light on the characteristics of the people who make up Canada's families, including their Indigenous identity, ethnocultural and religious diversity, language, housing, education and labour characteristics.
Note to readers
Readers are invited to download the StatsCAN app to view the census results.
Definitions, concepts and geography
Definitions
Counts are calculated on rounded data and may not necessarily add up to the total.
The median age is an age "x", such that exactly one half of the population is older than "x" and the other half is younger than "x".
The new concept of gender in the families, households and marital status release
In censuses prior to 2021, concepts and classifications relating to the family characteristics of individuals used information from a question about the sex of individuals. Beginning in 2021, the census asks questions about both the sex at birth and the gender of individuals. While data about sex at birth are needed to measure certain indicators, for the purposes of the families, households and marital status release, gender (as opposed to sex) is now the standard variable used in concepts and classifications. For more details on the new gender concept, including impacts on historical comparability, see Age, Sex at Birth and Gender Reference Guide, Census of Population, 2021.
The new gender variable impacts the classification of family variables involving couples families. For more information on the new "gender diversity status of couple" standard, see Families, Households and Marital Status Reference Guide, Census of Population, 2021 and Gender diversity status of couples: New information in the 2021 Census.
In this analysis, the sex variable in census years prior to 2021 and the two-category gender variable in the 2021 Census are used when making comparisons over time. Although sex and gender refer to two different concepts, the introduction of gender is not expected to have a significant impact on data analysis and historical comparability, given the small size of the transgender and non-binary populations. For additional information on changes of concepts over time, please consult Age, Sex at Birth and Gender Reference Guide, Census of Population, 2021.
Given that the non-binary population is small, data aggregation to a two-category gender variable is sometimes necessary to protect the confidentiality of responses provided. In these cases, individuals in the category "non-binary persons" are distributed into the other two gender categories. Unless otherwise indicated in the text, the category "men" includes men (and/or boys) as well as some non-binary persons. The category "women" includes women (and/or girls) as well as some non-binary persons.
Considerations for examining families and living arrangements with the Census of Population
As a consequence of changes in the family and society overall in recent decades, many people live at more than one residence throughout the year. However, the census does not capture the phenomenon of individuals who split their time living in multiple households.
The main purpose of the Census of Population is to enumerate the population. To ensure that individuals are counted once and only once in the census, individuals in private households are counted as residing at only one dwelling, and in only one household, by applying the concept of usual place of residence. As part of this concept, rules are applied for individuals who have multiple residences, including the following:
• Family members who live elsewhere for part of the year for work-related reasons should be included at their family's home regardless of the amount of time they spend there;
• Children who split their time throughout the year between the homes of two parents or guardians should be included in the home where they live most of the time. If they spend an equal amount of time with each parent or guardian, they should be included where they were staying on Census Day;
• Students who periodically return to their parents' home should be listed only at this home, even though they may spend more time living elsewhere.
As a consequence, the Census of Population does not necessarily reflect the full complexity of families, households and living arrangements. For more information, see Families, Households and Marital Status Reference Guide, Census of Population, 2021.
2021 Census of Population products and releases
Today, Statistics Canada is releasing a third series of results from the 2021 Census of Population.
Several 2021 Census products are also available today on the 2021 Census Program web module. This web module has been designed to provide easy access to census data, free of charge.
Analytical products include two articles in The Daily.
Data products include the families, households, and marital status results for a wide range of standard geographic areas, available through the Census Profile and data tables.
Focus on Geography provides data and highlights on key topics found in this Daily release at various levels of geography.
Reference materials are designed to help users make the most of census data. They include the Guide to the Census of Population, 2021, the Dictionary, Census of Population, 2021, and the 2021 Census of Population questionnaires. The Families, Households and Marital Status Reference Guide is also available. A new census fact sheet, Gender diversity status of couples: New information in the 2021 Census, is also available. The Balancing the Protection of Confidentiality with the Needs for Disaggregated Census Data report was previously released.
Geography-related 2021 Census Program products and services can be found under Census geography. This includes GeoSearch, an interactive mapping tool, and thematic maps, which show data for various standard geographic areas, along with Focus on Geography and the Census Program Data Viewer, which are data visualization tools.
Videos on census concepts can be found in the Census learning centre.
An infographic, A portrait of Canada's families in 2021, is also available.
Over the coming months, Statistics Canada will continue to release results from the 2021 Census of Population and provide an even more comprehensive picture of the Canadian population. Please see the 2021 Census release schedule to find out when data and analysis on the different topics will be released throughout 2022.
Contact information
For more information, or to enquire about the concepts, methods or data quality of this release, contact us (toll-free 1-800-263-1136; 514-283-8300; infostats@statcan.gc.ca) or Media Relations (statcan.mediahotline-ligneinfomedias.statcan@statcan.gc.ca).
- Date modified:

