Distributions of household economic accounts for income, consumption and saving of Canadian households, fourth quarter 2020
Archived Content
Information identified as archived is provided for reference, research or recordkeeping purposes. It is not subject to the Government of Canada Web Standards and has not been altered or updated since it was archived. Please "contact us" to request a format other than those available.
Released: 2021-09-07
The Distributions of household economic accounts provide important insight into the trends in household economic well-being and income inequality in Canada. While the results released today present estimates of income, consumption and saving for groups or average households with specific socioeconomic characteristics, it is important to recognize that not all households, even those with similar characteristics, necessarily experience the same situations.
In response to the high degree of uncertainty and volatility that Canadians faced due to the pandemic, the federal government implemented various support and recovery measures for Canadian households. These measures are factored into this analysis.
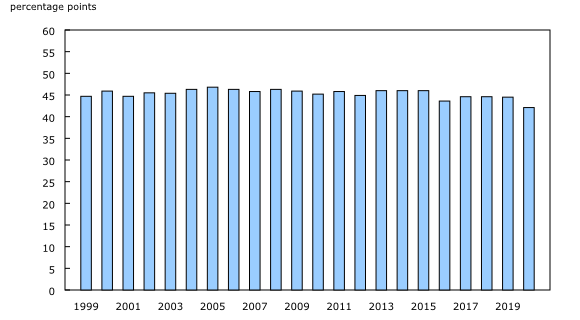
On average, all households in Canada recorded higher disposable income in 2020 compared with 2019. Lower and middle income earners recorded the largest annual increases in their disposable income. As a result, the gap between the highest and lowest income earners—calculated as the difference between the top two and bottom two quintiles' respective shares of total disposable income—shrunk to the lowest level ever recorded in the data series.
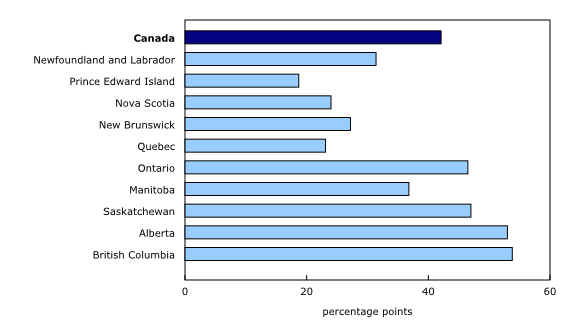
On a provincial basis, Alberta and British Columbia continued to record the largest gap between the highest and lowest income earners in their respective provinces in 2020. Despite having one of the highest gaps in 2020, Alberta saw the largest reduction in income inequality, as the gap between the highest and lowest income households shrunk nearly 13 percentage points compared with the average over the last two decades. In 2020, Prince Edward Island, Quebec, Nova Scotia and New Brunswick had the lowest estimates of income inequality, with their respective income gaps being roughly half of the national measure.
Low income and younger households see largest increases in disposable income in 2020
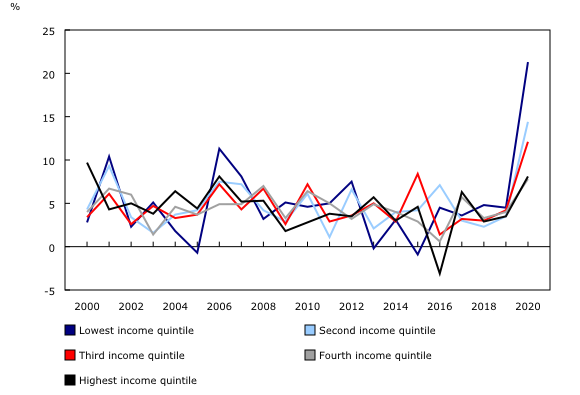
There was unprecedented volatility in household disposable income in 2020 as the pandemic initially caused notable declines in wages and self-employment income. In the end, on average all households recorded higher disposable income in 2020 compared with 2019. For the three middle income quintiles, it was the largest increase in disposable income recorded since the beginning of the data series in 1999. Both the lowest and highest income households saw larger annual increases in their disposable income back in 2006.
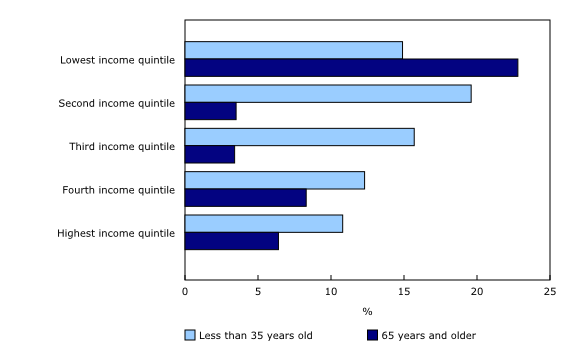
While all households had higher disposable income in 2020 compared with 2019, the lowest two income quintiles recorded the largest increases, with the lowest income quintile rising 21.3% and the second income quintile increasing 14.4%. Across most income quintiles it was generally younger households—those with a major income earner under the age of 35—that recorded the largest increases in disposable income in 2020. The exception was the lowest income quintile, where middle-aged (45-55 years) and senior (65+ years) households had the biggest jump in disposable income. This larger growth among older households is due in part to a trend of an increasing number of households 65 years and older being in the lowest income quintile. For example, the share of households 65 years and older in the lowest income quintile has increased from 26.4% in 2010 to 40.4% in 2020.
In most provinces it was the lowest two income quintiles that saw the largest increases in their disposable income in 2020, except British Columbia where it was the top income quintile that recorded the biggest income gains compared with 2019. The majority of provinces also saw the largest increases in disposable income among younger households (those under 45 years of age). The exceptions were Newfoundland and Labrador, Nova Scotia and Quebec which saw older households—those 55 years and older—increase their disposable income the most in 2020.
The saving rate improves the most for lowest income households in 2020
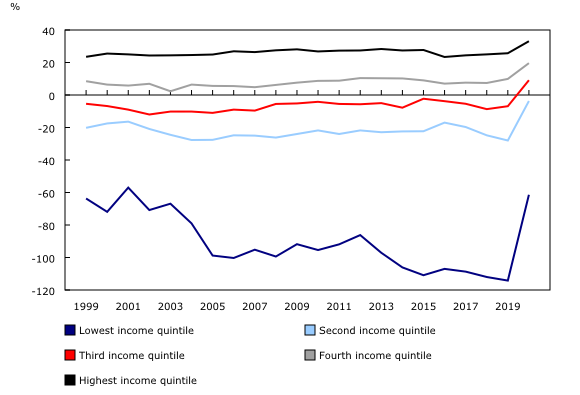
While households saw notable increases in their disposable income in 2020, there were also record declines in household final consumption expenditures as various lockdowns and public health measures limited opportunities to spend. The result was an unprecedented increase in household net saving and the saving rate. Although the lowest income households continued to have a negative saving rate in 2020, meaning they spent more than their disposable income in the year, they saw the greatest improvement in their saving rate, which had previously been below -100% from 2013 to 2019. Middle income households also switched to a net saving position or positive saving rate, for the first time since the start of this data series in 1999.
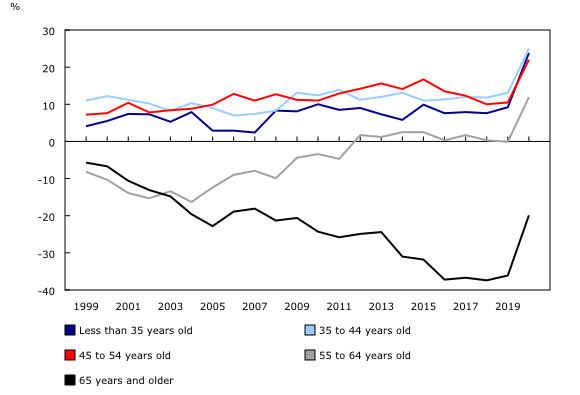
From an age perspective, the oldest (65 years and older) and youngest (under 35 years) households recorded the largest improvements in their saving rates in 2020. While an increase in their pension entitlements, a form of saving, boosted the oldest households' saving rate, it was higher disposable income, coupled with declines in spending, that pushed the youngest household saving rate into double-digit territory for the first time ever.
Note to readers
Statistics Canada regularly publishes macroeconomic indicators on household disposable income, final consumption expenditure and net saving as part of the Canadian System of Macroeconomic Accounts (CSMA). These accounts are aligned with the most recent international standards and are compiled for all sectors of the economy, including households, non-profit institutions, governments and corporations along with Canada's financial position vis-à-vis the rest of the world. While the CSMA provide high quality information on the overall position of households relative to other economic sectors, the Distributions of household economic accounts (DHEA) provide additional granularity to address questions such as vulnerabilities of specific groups and the resulting implications for economic well-being and financial stability, and are an important complement to standard quarterly outputs related to the economy.
The DHEA estimates released today provide estimates of income, consumption and saving and their sub-components by various household distributions for 2020. Annual estimates for 2006 to 2019 have been revised to include updated household counts, the CSMA benchmarks as of June 1, 2021, as well as new microdata used for estimating household distributions (2019 Survey of Household Spending, 2019 Survey of Financial Security and the Social Policy Simulation Database and Model 28.1).
Along with annual estimates, the release today includes revised quarterly estimates for the period from the first quarter of 2020 to the fourth quarter of 2020. The inclusion of new microdata, household counts and CSMA benchmarks impacted the revisions to the quarterly DHEA. Additionally, the quarterly DHEA released today differ from previously published experimental sub-annual estimates in that we are no longer holding constant the 2019 demographic and socioeconomic conditions. Instead we used the same approach as with the annual DHEA, allowing households to change distributional groupings from one quarter to another. This change has resulted in slight different estimates from the experimental sub-annual estimates released earlier this year, but overall the main trends are similar.
As with all data, the DHEA estimates are not without their limitations. While some distributions are estimated using timely microdata or micromodels, such as wages and salaries, others, including household final consumption expenditures, rely on assumptions or use data from prior reference periods. Users should keep these limitations in mind when analyzing the estimates included in this release.
All values are expressed in quarterly nominal unadjusted rates, unless otherwise specified.
Products
Details on the sources and methods behind these estimates can be found in the publication Methodological Guide: Canadian System of Macroeconomic Accounts (13-607-X). See the section "Distributions of Household Economic Accounts'' under Satellite Accounts and Special Studies.
The Economic accounts statistics portal, accessible from the Subjects module of our website, features an up-to-date portrait of national and provincial economies and their structure.
The Latest Developments in the Canadian Economic Accounts (13-605-X) is available.
The User Guide: Canadian System of Macroeconomic Accounts (13-606-G) is available.
Contact information
For more information, or to enquire about the concepts, methods or data quality of this release, contact us (toll-free 1-800-263-1136; 514-283-8300; STATCAN.infostats-infostats.STATCAN@canada.ca) or Media Relations (613-951-4636; STATCAN.mediahotline-ligneinfomedias.STATCAN@canada.ca).
- Date modified:


