Greenhouse, sod and nursery industries, 2017
Archived Content
Information identified as archived is provided for reference, research or recordkeeping purposes. It is not subject to the Government of Canada Web Standards and has not been altered or updated since it was archived. Please "contact us" to request a format other than those available.
Released: 2018-04-25
Total sales of the greenhouse, nursery, field cut flowers and sod industries increased 2.2% to $3.8 billion in 2017.
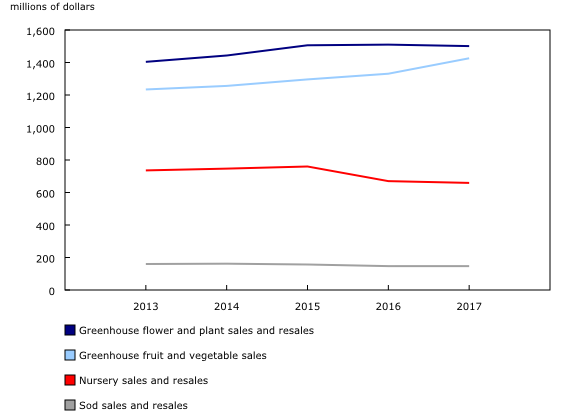
Greenhouse products accounted for 78.0% of total sales ($2.9 billion), up 3.0% compared with 2016. This was the result of a 7.1% increase in greenhouse fruit and vegetable sales to $1.4 billion. Sales of nursery products fell 1.7% to $659.3 million, and accounted for 17.6% of total sales.
Greenhouse fruit and vegetable sales
Tomatoes, peppers and cucumbers accounted for 95.5% of greenhouse fruit and vegetable sales in 2017. Sales of greenhouse tomatoes accounted for almost 40% or $556.6 million of total greenhouse fruit and vegetables sales in 2017, up 3.6% compared with 2016. Pepper sales totalled $421.9 million, up 2.9% from 2016.
Greenhouse cucumber production has been expanding outside of Ontario and British Columbia, with new producers in Alberta and Quebec in recent years. Cucumber sales rose 14.1% to $383.5 million due to this additional production. Although lettuce accounted for only 2.2% of total greenhouse fruit and vegetable sales in 2017, its sales grew 17.2% to $32.1 million, as production increased.
Greenhouse flower and plant sales
Indoor and outdoor potted plants accounted for 60.5% of the flower and plant sales for Canadian greenhouses in 2017, with sales totalling $786.9 million. Potted plants sales fell 3.0% for the year. The most common varieties reported were geraniums (15.1 million pots), herbs (11.6 million pots) and miniature rose pots (10.4 million pots).
Sales of prefinished products rose 7.6% to $386.5 million in 2017. Sales of ornamental bedding plants increased 6.2% to $204.2 million, while vegetable bedding plant sales increased 12.0%, in response to vegetable producers' higher demands for transplants.
Greenhouse expenses
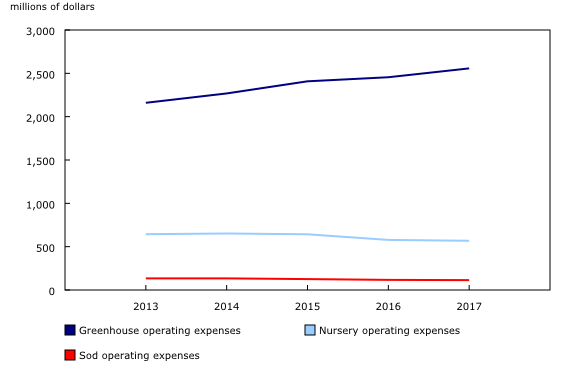
Greenhouse total operating expenses rose 4.1% to $2.6 billion in 2017. Labour still accounted for the largest share of total expenses (28.8%). The number of employees increased 1.5% to 33,089 employees, while payroll rose 3.1% to $735.3 million. The largest increase was reported for the other crop expenses category (+21.0%), which includes expenses for growing mediums, fertilizer, pesticides, pollination, irrigation, bioprograms, containers and packaging. There were also increases in purchases of plant material for growing on (+7.8%) and fuel expenses (+6.7%).
Other operating expenses, such as repairs to farm buildings, machinery, equipment and vehicles, land taxes, interest, insurance, and contract work, represented 22.1% of total expenses.
Total greenhouse area
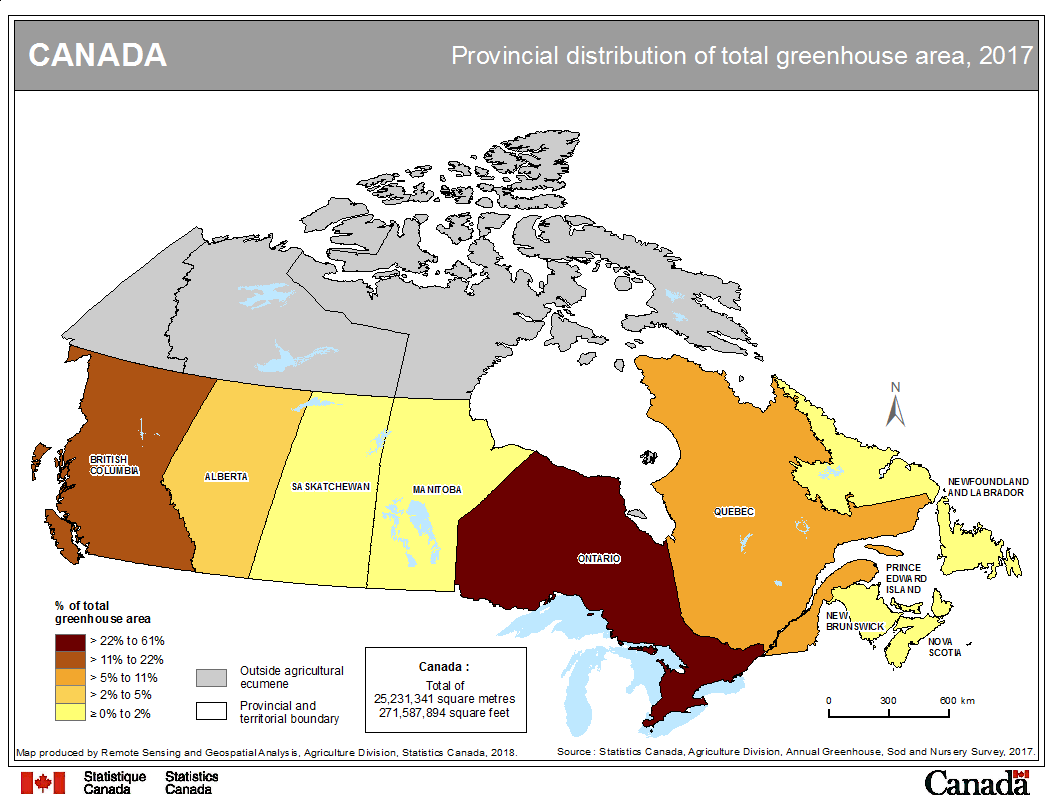
Total greenhouse area increased by 2.0% or 491 975 square metres in 2017 compared with 2016. As shown in Map 1, total greenhouse area is concentrated in Ontario. In 2017, Ontario represented 60.3% of total greenhouse area in Canada, compared with 21.3% in British Columbia, 10.3% in Quebec and 4.5% in Alberta.
Nursery area, sales and expenses
Total nursery area decreased 3.7% in 2017 to 17 691 hectares. This decline was accompanied by a 0.5% decrease in nursery product sales to $527.9 million, and a 6.0% decrease in resales to $131.4 million.
Nursery operating expenses fell by 1.7% to $568.3 million. Labour expenses accounted for 35.1% of total expenses, down 1.2% compared with 2016 due to the change in the total number of employees, which fell 7.5% to 10,600 employees.
Sod area, sales and expenses
In 2017, total sod area decreased 6.4% to 20 522 hectares. Total sales were stable at $147.3 million, while expenses decreased 3.2% to $113.7 million. Labour expenses accounted for 34.3% of total costs and this proportion was stable (34.8%) compared with 2016.
Contact information
For more information, or to enquire about the concepts, methods or data quality of this release, contact us (toll-free 1-800-263-1136; 514-283-8300; STATCAN.infostats-infostats.STATCAN@canada.ca) or Media Relations (613-951-4636; STATCAN.mediahotline-ligneinfomedias.STATCAN@canada.ca).
- Date modified:


