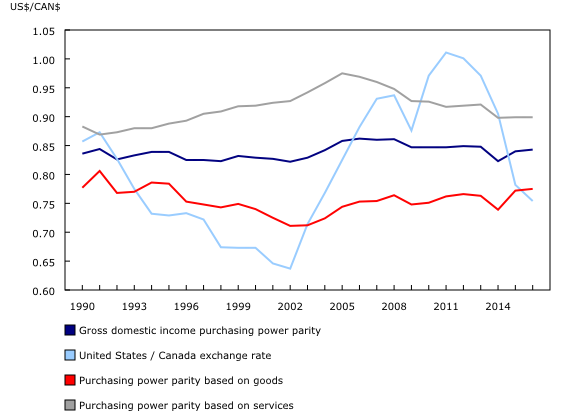
Purchasing power parities, 2016
Archived Content
Information identified as archived is provided for reference, research or recordkeeping purposes. It is not subject to the Government of Canada Web Standards and has not been altered or updated since it was archived. Please "contact us" to request a format other than those available.
Released: 2018-04-24
Purchasing power parities between Canada and the United States, 1990 to 2016
In 2016, the purchasing power of a Canadian dollar was US$0.84, up 0.4% from 2015. This signifies that the amount of goods and services that CAN$100 buys in Canada, would require US$84 to purchase in the United States.
Estimates of purchasing power parities (PPPs) reflect the relative prices of all products included in the gross domestic product (GDP) of each country. As such, PPP is a better metric of the relative purchasing power of incomes between two nations than the market exchange rate, which was US$0.75 in 2016.
Purchasing power parity hovers around US$0.84
From 1990 to 2016, average PPP was US$0.84, while the average market exchange rate was US$0.81. The PPP is more stable than the market exchange rate, which is determined by the demand and supply of currencies in the foreign exchange market.
Due to currency speculation and capital flows, the demand and supply of currencies can change rapidly. A sudden change in these factors, even to a non-trading partner, can have a substantial impact on the exchange rate between two trading nations.
Purchasing power parity facilitates regional comparisons
In 2016, the nominal GDP of the United States was US$18.6 trillion, while in Canada it was CAN$2.0 trillion. The PPP-adjusted GDP in the United States was close to 11 times larger than that of Canada. In 2016, the PPP adjusted per-capita income in Canada was US$47,300, compared with US$41,400 in 2010.
Because PPP-adjusted incomes better reflect the standard of living, international institutions—including the United Nations and the World Bank—use them to rank countries. In 2016, assuming Canada equals 100, actual individual consumption in the United States was 130—the largest contributor was health (197) and the smallest was purchases abroad (-42).
Goods more expensive in Canada, but services more similar in price
From 1990 to 2016, the average PPP of goods (such as cars and computers) was US$0.76, indicating that goods were relatively more expensive in Canada. In other words, the quantity of goods that US$76 in the United States could buy, would cost CAN$100 in Canada instead of CAN$93, the exchange rate converted price. Transportation, taxes, and trade margins are generally higher in Canada.
The PPP of services (such as health and education, after accounting for both private and public costs) has been higher in Canada compared with goods. From 1990 to 2016, the average PPP stemming from services was US$0.92.
Note to readers
In theory, purchasing power parities (PPPs) should be based on homogenous products (quantity and quality) between two countries. In practice, however, price ratios of all products included in the gross domestic product (GDP) are applied to calculate PPPs.
For each benchmark year, the latest being 2014, the Organisation of Economic Cooperation and Development (OECD) compiles price quotes of a large number of marketed and non-marketed products for each member country to estimate multi-lateral PPPs. The price of non-market products, such as health care and education, is derived using the input cost.
Benchmark estimates are made every three years for the multilateral exercise. The annual PPP series are estimated by linking the benchmark years, while post-benchmark year data are derived using implicit prices taken from nominal and real GDP. Statistics Canada gathers additional price quotes to improve the PPP between Canada and the United States.
Statistics Canada also applies real gross domestic income (GDI) instead of real GDP as weights. Real GDI deflates exports and imports, using the price index based on final domestic expenditure instead of their own prices, and thereby captures the impacts of terms of trade change.
For these reasons, the PPP between Canada and the United States disseminated through CANSIM tables 380-0057 and 380-0058 could differ from the OECD's multilateral PPP, which is available in CANSIM table 380-0037.
Products
The Latest Developments in the Canadian Economic Accounts (13-605-X) is available.
The User Guide: Canadian System of Macroeconomic Accounts (13-606-G) is also available. This publication will be updated to maintain its relevance.
The Methodological Guide: Canadian System of Macroeconomic Accounts (13-607-X) is available.
The System of Macroeconomic Accounts module features an up-to-date portrait of national and provincial economies and their structure.
Contact information
For more information, or to enquire about the concepts, methods or data quality of this release, contact us (toll-free 1-800-263-1136; 514-283-8300; STATCAN.infostats-infostats.STATCAN@canada.ca) or Media Relations (613-951-4636; STATCAN.mediahotline-ligneinfomedias.STATCAN@canada.ca).
- Date modified:


