Gross domestic product, income and expenditure, first quarter 2017
Archived Content
Information identified as archived is provided for reference, research or recordkeeping purposes. It is not subject to the Government of Canada Web Standards and has not been altered or updated since it was archived. Please "contact us" to request a format other than those available.
Released: 2017-05-31
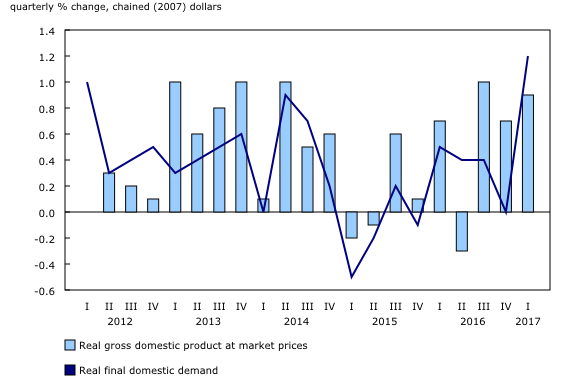
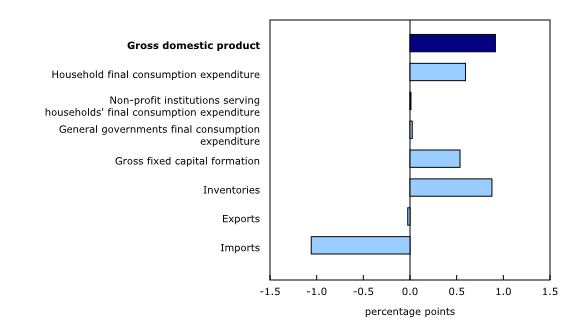
Real gross domestic product (GDP) rose 0.9% in the first quarter, following a 0.7% gain in the fourth quarter. Growth was led by final domestic demand (+1.2%) while exports edged down.
Household final consumption expenditure rose 1.1% following a 0.7% gain the previous quarter. Outlays on goods grew 1.5% as purchase of vehicles increased 2.3%. Outlays on services (+0.7%) also rose.
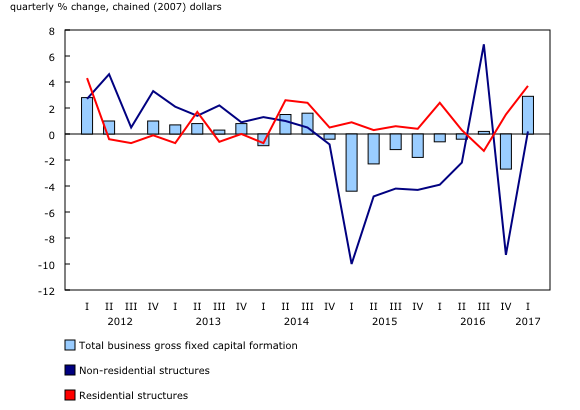
Business gross fixed capital formation rose 2.9% following declines in eight of the previous nine quarters. Growth was driven by housing investment (+3.7%) and investment in machinery and equipment (+5.8%).
Exports edged down 0.1% as services decreased 0.5%. Exports of goods were unchanged.
Imports of goods and services increased 3.3%, in tandem with strength in final domestic demand. This followed a 3.0% decline in imports the previous quarter.
Expressed at an annualized rate, real GDP rose 3.7% in the first quarter. In comparison, real GDP in the United States grew 1.2%.
Household consumption increases
Household final consumption expenditures increased 1.1% in the first quarter, following a 0.7% gain in the fourth quarter. Outlays on goods rose 1.5%, with increases in durable (+2.4%), semi-durable (+2.1%) and non-durable (+0.8%) goods. Spending on services rose 0.7%.
Transport (+1.5%) was the largest contributor to increased household spending. Purchase of vehicles rose 2.3%, contributing to higher imports of passenger cars and light trucks (+6.1%). Housing, water, electricity, gas and other fuels (+0.9%), recreation and culture (+1.3%) and clothing and footwear (+2.5%) also increased.
Housing growth accelerates
Business investment in residential structures grew 3.7%, following a 1.5% gain in the fourth quarter. New contruction investment increased 3.9% while ownership transfer costs grew 5.8%, largely due to strong resale activity in the Ontario market. Renovation activity increased 2.1%, a slightly faster pace than in the previous quarter (+1.9%).
Business non-residential investment rebounds
Business investment in machinery and equipment (+5.8%) rebounded following declines in four of the previous five quarters. The increase was concentrated in investment in industrial machinery and equipment (+4.7%), computers and computer peripheral equipment (+7.5%) and medium and heavy trucks, buses and other motor vehicles (+5.8%), which were reflected in rising imports for all of these goods.
Investment in intellectual property products increased 1.5% following two consecutive quarterly declines. Mineral exploration and evaluation (+13.7%) rose sharply following eight consecutive quarters of decline, primarily due to increased activity in oil and gas.
Business investment in non-residential structures increased 0.2% following a 9.3% decline the previous quarter. Engineering structures increased 0.7% after declining 11.6% in the fourth quarter. A large one-time investment in the Hebron offshore oil project in the third quarter of 2016 led to a 9.8% increase in investment in engineering structures in that quarter, followed by a decline in the fourth quarter. Non-residential building investment (-1.5%) continued to decline.
Overall, business gross fixed capital formation increased 2.9% in the first quarter. This was the second quarterly increase in 10 quarters and the largest since the first quarter of 2010.
Inventories build up
Businesses accumulated $12.2 billion in inventories in the first quarter, following a draw-down of $2.8 billion in the previous quarter.
Manufacturing added $6.1 billion to inventories, with stocks of durable goods increasing $5.3 billion and those of non-durable goods rising $811 million. Wholesalers accumulated $3.8 billion. Inventories of motor vehicles increased $2.1 billion. Retailers added $2.3 billion overall to inventories.
Farm inventories fell a further $524 million after a similar draw-down in the previous quarter.
The economy-wide stock-to-sales ratio edged up from 0.749 in the fourth quarter to 0.751 in the first quarter.
Exports edge down
Exports of goods and services edged down 0.1% in the first quarter following a 0.2% gain in the fourth quarter.
Exports of goods were unchanged overall, with increases in motor vehicles and parts (+3.8%) and farm, fishing and intermediate food products (+7.0%) offsetting declines in aircraft and other transportation equipment and parts (-11.7%) and metal ores and non-metallic minerals (-8.5%).
Exports of services were down 0.5%, mostly due to a 1.1% decline in commercial services. Higher exports of travel services (+0.9%) partially offset the decline.
Imports of goods and services rebounded with a 3.3% increase in the first quarter, offsetting a 3.0% decline in the fourth quarter. Increased imports of goods (+3.7%) offset a 3.7% decline in the fourth quarter. The import of the Hebron oil platform in the third quarter led to 1.2% growth in that quarter and the subsequent decline in the fourth. Imports of services rose 1.3% in the first quarter.
Household saving decreases
Compensation of employees grew 0.9% in the first quarter (nominal terms), after increasing 1.2% the previous quarter. Wages and salaries rose 1.0%, with increases in both goods (+1.4%) and services (+0.9%) producing industries.
Household final consumption expenditure (nominal terms) rose 1.4%, outpacing household disposable income (+0.4%). The household saving rate decreased to 4.3% in the first quarter.
The household debt service ratio (defined as household mortgage and non-mortgage payments divided by disposable income) increased from 14.13% in the fourth quarter to 14.17% in the first quarter as debt payments increased at a faster pace than disposable income.
Corporate earnings increase
The gross operating surplus of non-financial corporations grew 5.6% in the first quarter, following a 4.1% increase the previous quarter. Strong domestic demand contributed to gains in non-financial corporate earnings. The gross operating surplus of financial corporations grew 1.4%.
Real gross national income increased 1.3% as the terms of trade improved for a fourth consecutive quarter. Export prices increased 1.5% as energy prices rose, while import prices fell 0.6%.
Government fiscal positions improve
The net borrowing position of the overall government sector was reduced to $34.3 billion, following increases over the previous two quarters, as government revenues (+1.1%) grew at a faster pace than expenditures (+0.5%). Improvements in government fiscal positions were evidenced at both the federal and provincial levels.

In celebration of the country's 150th birthday, Statistics Canada is presenting snapshots from our rich statistical history.
Today, we look back at the evolution of business residential construction investment since 1926. Residential construction investment includes new construction, renovations and transfer costs (indicative of resale activity).
Business gross fixed capital formation in residential structures accounted for 29% of investment and 4% of gross domestic product (GDP) in 1926 and gradually progressed over 90 years to 41% of investment and 8% of GDP in 2016.
During this long time period, however, there has been some investment volatility. Residential construction reacts quickly to changes in employment, interest rates, inflation and consumer confidence. This can be noted over major economic events during the 1926 to 2016 period.
The Second World War not only had a large impact on GDP but also on investment in residential structures. In 1942, residential investment shrank 22% and subsequently rebounded 60% in 1944 with the relaxation of wartime construction controls and the introduction of the National Housing Act.
Double-digit mortgage lending rates and an economic recession drove down residential investment by 18% in 1982, one of the sharpest declines over the time series. Housing investment rebounded the following year, as rates dropped sharply by the end of 1982, making home ownership more affordable and spurring a period of growth for the remainder of the decade.
At the time of the global financial crisis of 2008, the housing market was more resilient. Residential investment shrank 3% in 2009, then rebounded 7% the following year.
Note to readers
For information on seasonal adjustment, see Seasonally adjusted data – Frequently asked questions.
Percentage changes for expenditure-based statistics (such as personal expenditures, investment, exports and imports) are calculated from volume measures that are adjusted for price variations. Percentage changes for income-based and flow-of-funds statistics (such as labour income, corporate profits, mortgage borrowing and total funds raised) are calculated from nominal values; that is, they are not adjusted for price variations.
There are two ways of expressing growth rates for gross domestic product (GDP) and other time series found in this release:
- Unless otherwise stated, the growth rates in this release represent the percentage change in the series from one quarter to the next, such as from the fourth quarter of 2016 to the first quarter of 2017.
- Quarterly growth can be expressed at an annual rate by using a compound growth formula, similar to the way in which a monthly interest rate can be expressed at an annual rate. Expressing growth at an annual rate facilitates comparisons with official GDP statistics from the United States. Both the quarterly growth rate and the annualized quarterly growth rate should be interpreted as an indication of the latest trend in GDP.
Revisions
Data on GDP for the first quarter of 2017 were released along with revised data from the first, second, third and fourth quarters of 2016. These data incorporate new and revised data, as well as updated data on seasonal trends.
Real-time CANSIM tables
Real-time CANSIM tables 380-8063 and 380-8064 will be updated on June 12. For more information, consult the document Real-time CANSIM tables.
Next release
Data on GDP by income and expenditure for the second quarter will be released on August 31.
Products
The document "Carbon Pricing in the Canadian System of Macroeconomic Accounts", which is part of Latest Developments in the Canadian Economic Accounts (13-605-X), is now available.
The System of Macroeconomic Accounts module, accessible from the Browse by key resource module of our website, features an up-to-date portrait of national and provincial economies and their structure.
The Methodological Guide: Canadian System of Macroeconomic Accounts (13-607-X) is also available.
The User Guide: Canadian System of Macroeconomic Accounts (13-606-G) is also available. This publication has been updated with Chapter 8. International accounts.
Contact information
For more information, or to enquire about the concepts, methods or data quality of this release, contact us (toll-free 1-800-263-1136; 514-283-8300; STATCAN.infostats-infostats.STATCAN@canada.ca) or Media Relations (613-951-4636; STATCAN.mediahotline-ligneinfomedias.STATCAN@canada.ca).
- Date modified:


