Police-reported hate crimes, 2012
Archived Content
Information identified as archived is provided for reference, research or recordkeeping purposes. It is not subject to the Government of Canada Web Standards and has not been altered or updated since it was archived. Please "contact us" to request a format other than those available.
Released: 2014-06-26
In 2012, police reported 1,414 criminal incidents motivated by hate in Canada, 82 more incidents than in 2011. These hate crimes represented 4.1 incidents per 100,000 population.
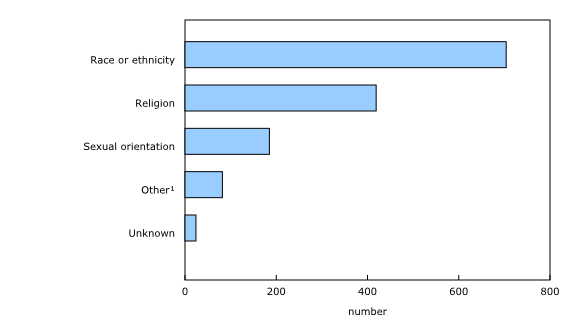
In 2012, about half of all hate crimes (704 incidents, or 51%) were motivated by hatred toward a race or ethnicity such as Black, Asian, Arab or Aboriginal populations. Another 419 incidents, or 30%, were motivated by hatred towards a particular religion, including hate crimes targeting Jewish, Muslim, Catholic and other religions.
An additional 13% (185 incidents) were motivated by sexual orientation, while the remaining 6% of hate crimes were motivated by language, mental or physical disability, sex, age or some other characteristic (such as occupation or political beliefs).
Among hate crimes motivated by race or ethnicity, black populations were the most frequently targeted (21% of hate crimes of all types). For hate crimes motivated by religion, hate crimes targeting Jewish populations were the most common (17% of hate crimes of all types).
Mischief is the most common police-reported hate crime
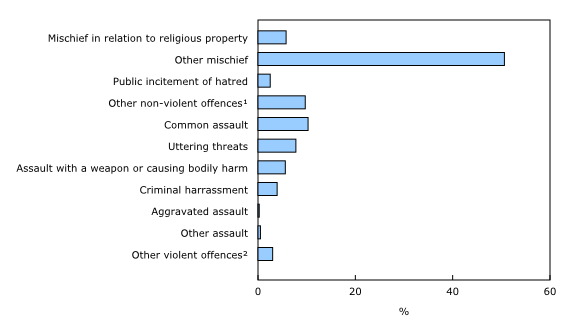
Overall, the majority (69%) of hate crimes reported by police involved non-violent offences. Mischief, which includes vandalism, graffiti and other destruction of property, was the most commonly reported offence among police-reported hate crimes, making up over half of all hate crime incidents in 2012: 6% were mischief motivated by hate in relation to religious property and 51% were other types of mischief.
Almost one-third (31%) of all police-reported hate crimes in 2012 involved violent offences, such as assault, uttering threats or criminal harassment. This differed, however, by type of motivation. For instance, two-thirds (67%) of hate crimes motivated by sexual orientation and one-third (32%) of hate crimes motivated by race/ethnicity involved a violent offence, while hate crimes motivated by religion were less likely to be violent (13%).
Both accused and victims of hate crime often young
Youth and young adults were the most likely to be either the accused or victim of a hate crime. Among persons accused of hate crimes in 2012, 57% were under the age of 25. Hate crimes motivated by sexual orientation had the highest proportion of accused under the age of 25 (66%).
Most of those accused of hate crimes (84%) were male. Specifically, young males under the age of 18 accounted for 31% of the accused persons.
In 2012, 40% of hate crime victims were under the age of 25. Victims of hate crimes motivated by sexual orientation tended to be younger, with 56% under the age of 25.
Most police-reported hate crimes occur in major cities
The majority (82%) of police-reported hate crimes in Canada occurred in major cities (census metropolitan areas, [CMAs]). Overall, the 10 largest CMAs in Canada, representing just over half of the population, accounted for 63% of police-reported hate crimes in 2012.
Toronto, Montréal and Vancouver, the three largest CMAs in Canada, accounted for 35% of police-reported hate crime incidents. These three CMAs, however, did not have the highest rates of police-reported hate crime once population size was taken into account. In 2012, the highest rates of police-reported hate crime per 100,000 population were in Hamilton, Thunder Bay and Peterborough.
It is important to recognize that, according to police services, higher rates of police-reported hate crime in certain jurisdictions may reflect differences or changes in the awareness, reporting and investigation of these incidents by police and community members.
Note to readers
Police-reported hate crimes refer to criminal incidents that, upon investigation by police, are determined to have been motivated by hate toward an identifiable group. The incident may target race, colour, national or ethnic origin, religion, sexual orientation, language, sex, age, mental or physical disability, or other factors such as occupation or political beliefs.
Police-reported hate crime data have been collected on an annual basis since 2006 and, as of 2010, cover 99% of the population of Canada.
Fluctuations in the annual number of incidents can be influenced by changes in local police service practices and community involvement, as well as the willingness of victims to report incidents to police. The number of hate crimes presented in this release represents those that were reported to police. Self-reported victimization data from the Canadian General Social Survey suggest that about one-third (34%) of incidents perceived by respondents to have been motivated by hate were reported to police.
The Juristat article "Police-reported hate crime in Canada, 2012" (Catalogue number85-002-X), is now available. From the Browse by key resource module of our website under Publications, choose All subjects, then Crime and Justice, and Juristat.
Data on hate crime for 2012 are now available for police services across Canada reporting to the Uniform Crime Reporting Survey.
Data are available upon request.
Contact information
For more information, or to enquire about the concepts, methods or data quality of this release, contact us (toll-free 1-800-263-1136; 514-283-8300; infostats@statcan.gc.ca) or Media Relations (613-951-4636; statcan.mediahotline-ligneinfomedias.statcan@canada.ca).
- Date modified:


