
Annual Demographic Estimates: Canada, Provinces and Territories
Analysis: Total Population

Archived Content
Information identified as archived is provided for reference, research or recordkeeping purposes. It is not subject to the Government of Canada Web Standards and has not been altered or updated since it was archived. Please "contact us" to request a format other than those available.
Skip to text
Text begins
The analysis in this publication is based mainly on preliminary data. Since these data will be revised next year, some trends illustrated in this publication may change slightly following this revision. Therefore, the data in this publication should be interpreted with caution.
This section presents the population estimates for Canada, the provinces and territories on July 1, 2017, along with a concise analysis of the various components of population growth.
The population of Canada continues to grow at a steady pace
On July 1, 2017, Canada’s population was estimated at 36,708,083, up 443,479 in the past year (2016/2017). The country’s population growth rate was 1.2%,Note 1 which remained unchanged from 2015/2016. In absolute numbers, Canada’s population growth in the past year was the largest since 1988/1989 (+485,034).
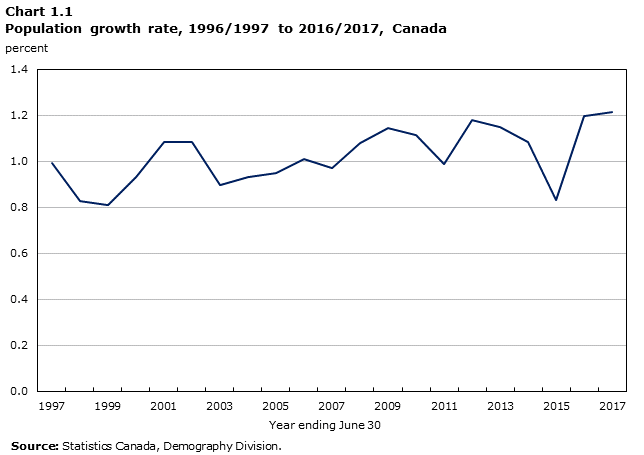
Data table for Chart 1.1
| Year ending June 30 | Percent |
|---|---|
| 1997 | 0.99 |
| 1998 | 0.83 |
| 1999 | 0.81 |
| 2000 | 0.93 |
| 2001 | 1.09 |
| 2002 | 1.08 |
| 2003 | 0.90 |
| 2004 | 0.93 |
| 2005 | 0.95 |
| 2006 | 1.01 |
| 2007 | 0.97 |
| 2008 | 1.08 |
| 2009 | 1.14 |
| 2010 | 1.11 |
| 2011 | 0.99 |
| 2012 | 1.18 |
| 2013 | 1.15 |
| 2014 | 1.08 |
| 2015 | 0.83 |
| 2016 | 1.20 |
| 2017 | 1.22 |
| Source: Statistics Canada, Demography Division. | |
Canada posts the strongest population growth among G7 countries
During the past year, population growth in Canada remained the highest out of all G7Note 2 countries, matching Germany’s growth (+1.2%). Canada’s population growth rate was ahead of the United Kingdom (+0.8%), the United States (+0.7%) and France (+0.4%), and contrasts with the negative growth (-0.1%) recorded in Italy and Japan. However, Canada’s population growth was not the highest among industrialized countries: it was lower than the increase posted in Australia (+1.5%) and New Zealand (+2.1%).Note 3
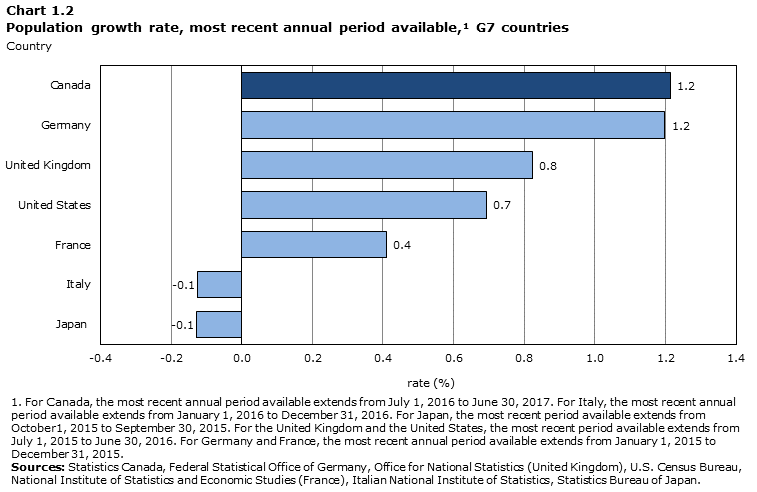
Data table for Chart 1.2
| Country | Rate (%) |
|---|---|
| Japan | -0.1 |
| Italy | -0.1 |
| France | 0.4 |
| United States | 0.7 |
| United Kingdom | 0.8 |
| Germany | 1.2 |
| Canada | 1.2 |
|
|
International migration accounts for most of the population growth
Population growth at the national level is based on two factors: natural increaseNote 4 and international migratory increase,Note 5 while provincial and territorial population estimates also factor in interprovincial migration. In the past year, natural increase totalled 111,411, or the difference between 389,912 births and 278,501 deaths, according to preliminary estimates. During the same period, net international migration was 332,068, the highest level recorded in Canada since the beginning of the period covered by the current demographic accounting system (July 1971).
Since 1995/1996, international migration has consistently been the main driver of population growth in Canada. Over the past year, the three-quarters of population growth stemmed from international migratory increase (74.9%), a level unmatched in recent history. By comparison, international migratory increase accounted for, on average, 38.3% of the population growth in the 1980s.
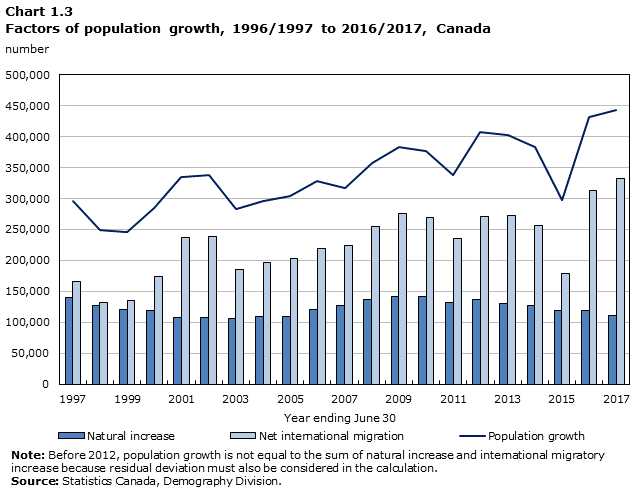
Data table for Chart 1.3
| Year ending June 30 | Natural increase | Net international migration | Population growth |
|---|---|---|---|
| number | |||
| 1997 | 140,092 | 165,616 | 295,730 |
| 1998 | 127,435 | 131,768 | 249,225 |
| 1999 | 120,663 | 135,427 | 246,113 |
| 2000 | 119,683 | 174,769 | 284,444 |
| 2001 | 107,993 | 236,700 | 334,866 |
| 2002 | 107,661 | 238,978 | 337,822 |
| 2003 | 106,618 | 185,410 | 283,212 |
| 2004 | 108,933 | 196,281 | 296,374 |
| 2005 | 109,364 | 203,810 | 304,360 |
| 2006 | 120,593 | 219,578 | 328,141 |
| 2007 | 127,091 | 224,650 | 317,423 |
| 2008 | 137,170 | 255,087 | 357,845 |
| 2009 | 141,582 | 275,532 | 382,798 |
| 2010 | 142,235 | 268,784 | 376,703 |
| 2011 | 131,983 | 234,952 | 337,506 |
| 2012 | 137,340 | 270,425 | 407,765 |
| 2013 | 129,951 | 271,874 | 401,825 |
| 2014 | 127,312 | 255,666 | 382,978 |
| 2015 | 118,694 | 178,471 | 297,165 |
| 2016 | 118,584 | 313,507 | 432,091 |
| 2017 | 111,411 | 332,068 | 443,479 |
|
Note: Before 2012, population growth is not equal to the sum of natural increase and international migratory increase because residual deviation must also be considered in the calculation. Source: Statistics Canada, Demography Division. |
|||
International migratory increase reaches a record high for the second consecutive year
In 2016/2017, Canada’s international migratory increase (+332,068) topped last year’s record (+313,507) by nearly 20,000 people. Record levels of international migratory increase were also observed in Prince Edward Island (+2,909), Quebec (+62,855) and the Northwest Territories (+293). The high levels of international migration observed in 2016/2017 have rarely been seen in the past across all provinces and territories, except in Alberta, British Columbia and Nunavut.
Last year’s record level of international migration is the result of strong immigration levels and the arrival of a significant number of non-permanent residents. Canada welcomed 272,666 immigrants last year, the second-highest number posted since the beginning of the period covered by the current demographic accounting system (July 1971). The record high was recorded in 2015/2016 (323,173 immigrants). Meanwhile, the number of non-permanent residents increased by 105,988 during the past year, compared with a gain of 36,785 in 2015/2016. As with immigration, the increase in the number of non-permanent residents observed last year was the second highest recorded since the beginning of the period covered by the current demographic accounting system (July 1971). The only higher increase was seen in 1988/1989 (140,748 non-permanent residents). This coincided with the introduction of the Immigration and Refugee Board of Canada and a new refugee determination system on January 1, 1989.
Various factors can affect international migration variations and trends. For example, Immigration, Refugees and Citizenship Canada (IRCC) is regularly called on to revise the brackets for immigration levels, in keeping with the framework set out in the Immigration and Refugee Protection Act (IRPA).Note 6 The recent rise in the number of immigrants is consistent with the levels established by the IRCC.Note 7 In addition, the number of non-permanent residents can fluctuate based on the economic and political climate in Canada and elsewhere in the world. There are three main categories of non-permanent residents: work permit holders, study permit holders, and refugee claimants. The number of work and study permit holders can rise or fall based on the economic context of the country of origin and the host country, as well as the directions of certain political programs in Canada. Meanwhile, the number of refugee claimants can vary based on the political context in their country of origin and on decisions made in Canada. Emigration trends are more closely linked to both the internal and external economic situation.
More than four out of five of Canadians live in four provinces
On July 1, 2017, more than 31.7 million Canadians (86.3%) resided in one of four provinces: Ontario (38.7%), Quebec (22.9%), British Columbia (13.1%) or Alberta (11.7%). Ontario remained the country’s most populated province, surpassing 14 million residents last year (14,193,384). The province with the smallest population was Prince Edward Island, with 152,021 residents. Quebec remained the second most populous province (8,394,034), followed by British Columbia (4,817,160) and Alberta (4,286,134).
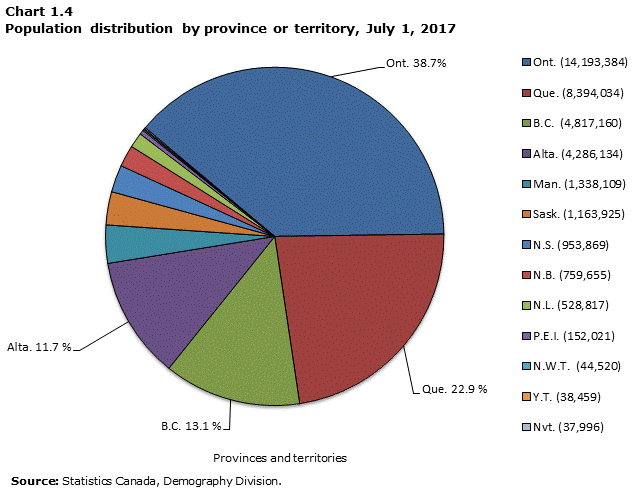
Data table for Chart 1.4
The pie chart has the following 13 sections:
| Provinces and territories | Proportion |
|---|---|
| N.L. | 38.7% |
| P.E.I. | 22.9% |
| N.S. | 13.1% |
| N.B. | 11.7% |
| Que. | 3.6% |
| Ont. | 3.2% |
| Man. | 2.6% |
| Sask. | 2.1% |
| Alta. | 1.4% |
| B.C. | 0.4% |
| Y.T. | 0.1% |
| N.W.T. | 0.1% |
| Nvt. | 0.1% |
| Source: Statistics Canada, Demography Division. | |
Population growth continues to slow in Alberta, but picks up in Ontario
Alberta’s population growth rate has been declining since 2012/2013. That year, the rate observed was 3.0%; in contrast, 2016/2017 saw a rate of 1.2%. The last time the province experienced a slower growth rate was in 1987/1988 (+0.6%).
The opposite was true in Ontario, which recorded a population growth rate of 1.5% in 2016/2017, the highest it has seen in 15 years. And for the first time since 1988/1989, Ontario’s population growth rate surpassed Alberta’s. This reversed trend can be partly explained by Ontario’s transition to positive interprovincial migration and Alberta’s negative interprovincial migration for the past two years. In addition, international migration accelerated in Ontario last year, but slowed in Alberta.
Population growth in the two other Prairie provinces remained higher than the rate for Canada (+1.2%). The period 2016/2017 marked the second consecutive year that Alberta’s population growth rate (+1.2%) was the lowest among the Prairie provinces, surpassed by Manitoba (+1.5%) and Saskatchewan (+1.3%).
British Columbia’s population growth rate (+1.2%) was equal to Canada’s, while Quebec’s (+0.9%) remained below the national rate for a sixth consecutive year.
According to preliminary population estimates, Newfoundland and Labrador (-0.3%) was the only province to post a population decline last year. Population growth continued to be positive in the other Atlantic provinces, though it was lower than in 2015/2016. Despite this slight slowdown, the population growth rates in Prince Edward Island (+1.7%), Nova Scotia (+0.6%) and New Brunswick (+0.3%) were higher in 2016/2017 than the average for the past 10 years.
Finally, in the territories, Nunavut (+2.2%) had the highest population growth rate in Canada, while the Northwest Territories (-0.2%) saw its population decrease and Yukon (+1.0%) experienced slightly slower growth than the country as a whole.
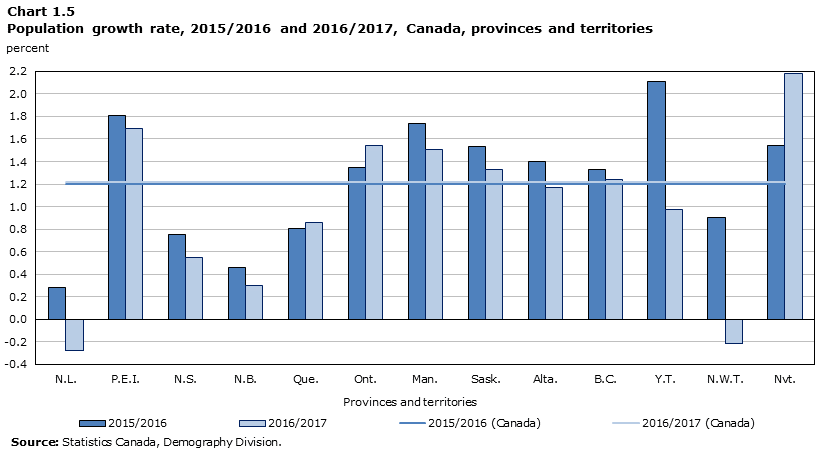
Data table for Chart 1.5
| Provinces and territories | 2015/2016 | 2016/2017 |
|---|---|---|
| percent | ||
| CanadaChart 1.5 Note 1 | 1.2 | 1.2 |
| N.L. | 0.3 | -0.3 |
| P.E.I. | 1.8 | 1.7 |
| N.S. | 0.7 | 0.6 |
| N.B. | 0.5 | 0.3 |
| Que. | 0.8 | 0.9 |
| Ont. | 1.3 | 1.5 |
| Man. | 1.7 | 1.5 |
| Sask. | 1.5 | 1.3 |
| Alta. | 1.4 | 1.2 |
| B.C. | 1.3 | 1.2 |
| Y.T. | 2.1 | 1.0 |
| N.W.T. | 0.9 | -0.2 |
| Nvt. | 1.5 | 2.2 |
|
||
All provinces experienced slower population growth, except Quebec and Ontario
Canada’s population growth rateNote 8 remained unchanged last year compared with 2015/2016, but variations were observed in all provinces and territories. In Ontario and Quebec, the two most populous provinces, the population grew faster last year than in 2015/2016. In Quebec, this gain was attributable to international migratory increase, whereas in Ontario, both international and interprovincial migratory increase were contributing factors.
In all other provinces and all territories except Nunavut, last year’s population growth was lower than in the previous period.
International migratory increase is the main driver of population growth in all provinces
According to preliminary population estimates, there were more deaths than births in all the Atlantic provinces, except Prince Edward Island. International migratory increase was the sole source of population growth in New Brunswick and the main contributor in Nova Scotia, where there were also slight gains due to interprovincial migration. In Newfoundland and Labrador, international migratory increase (+0.3%) was not enough to offset the decline resulting from natural decrease (-0.2%) and interprovincial migration losses (-0.4%).
Ontario and British Columbia were the only two provinces where each of the three growth factors contributed positively to population growth. Moreover, international migration was the main driver of population growth in these two provinces.
In Quebec and each of the Prairie provinces, more than half of their population growth was attributable to international migration. Natural increase was also positive; however, there were losses in interprovincial migration.
In the territories, natural increase was a more substantial source of population growth, primarily on account of higher fertility levels. Natural increase in Nunavut (+1.9%)—the highest in Canada—was behind most of this territory’s population growth. In the Northwest Territories, strong natural increase (+1.0%) and positive international migratory increase (+0.7%) were offset by considerably negative interprovincial migratory increase (-1.9%). Yukon was the only territory to post higher international migratory increase (+0.9%) than natural increase (+0.4%).
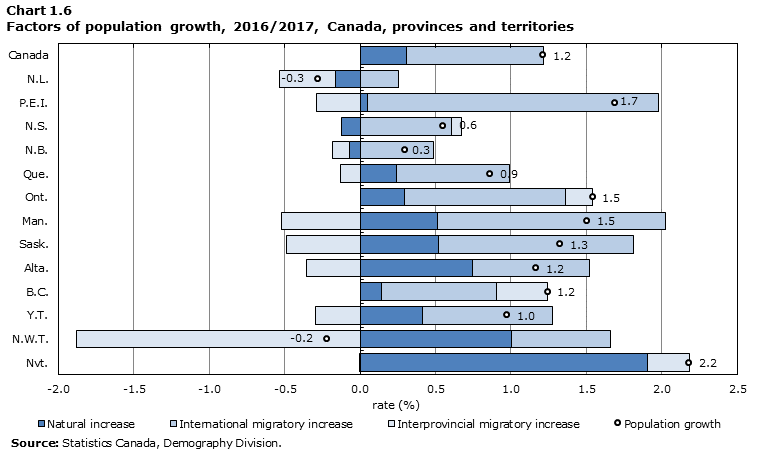
Data table for Chart 1.6
| Provinces and territories | Natural increase | International migratory increase | Interprovincial migratory increase | Population growth |
|---|---|---|---|---|
| rate (%) | ||||
| Canada | 0.3 | 0.9 | 0.0 | 1.2 |
| N.L. | -0.2 | 0.3 | -0.4 | -0.3 |
| P.E.I. | 0.1 | 1.9 | -0.3 | 1.7 |
| N.S. | -0.1 | 0.6 | 0.1 | 0.6 |
| N.B. | -0.1 | 0.5 | -0.1 | 0.3 |
| Que. | 0.2 | 0.8 | -0.1 | 0.9 |
| Ont. | 0.3 | 1.1 | 0.2 | 1.5 |
| Man. | 0.5 | 1.5 | -0.5 | 1.5 |
| Sask. | 0.5 | 1.3 | -0.5 | 1.3 |
| Alta. | 0.7 | 0.8 | -0.4 | 1.2 |
| B.C. | 0.1 | 0.8 | 0.3 | 1.2 |
| Y.T. | 0.4 | 0.9 | -0.3 | 1.0 |
| N.W.T. | 1.0 | 0.7 | -1.9 | -0.2 |
| Nvt. | 1.9 | 0.0 | 0.3 | 2.2 |
| Source: Statistics Canada, Demography Division. | ||||
A growing share of immigrants settle in the Prairie provinces
The geographic distribution of new immigrants continued to shift in favour of the Prairie provinces. In the past year, 27.2% of immigrants settled in one of the three Prairie provinces. This proportion is similar to the one in the last period (28.0%). However, this proportion was three times lower 20 years ago (8.7% in 1996/1997). The share of immigrants who settled in Canada’s central provinces (Quebec and Ontario) was 55.6% in 2016/2017, compared with 65.5% in 1996/1997.
The estimated number of immigrants is based on their intended province or territory of residence, as collected by the IRCC. This also applies to the calculation of international migratory increase and provincial and territorial population growth.
In the last year, the proportion of immigrants received by each western Canadian province exceeded their demographic weight. Among Canada’s other provinces, only Prince Edward Island was in the same situation. The proportion of immigrants who settled in the Atlantic provinces (4.1%) remained unchanged from the previous period. However, this level is twice as high as it was 20 years ago (2.0% in 1996/1997).
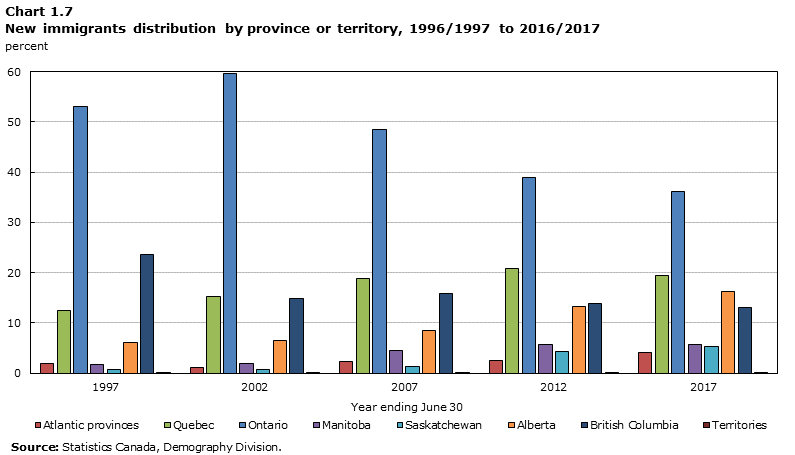
Data table for Chart 1.7
| Year ending June 30 | Atlantic provinces | Quebec | Ontario | Manitoba | Saskatchewan | Alberta | British Columbia | Territories |
|---|---|---|---|---|---|---|---|---|
| percent | ||||||||
| 1997 | 2.0 | 12.4 | 53.1 | 1.8 | 0.8 | 6.1 | 23.7 | 0.1 |
| 2002 | 1.1 | 15.3 | 59.6 | 1.9 | 0.7 | 6.5 | 14.8 | 0.1 |
| 2007 | 2.3 | 18.9 | 48.5 | 4.5 | 1.3 | 8.5 | 15.9 | 0.1 |
| 2012 | 2.6 | 20.9 | 38.9 | 5.8 | 4.4 | 13.3 | 13.9 | 0.2 |
| 2017 | 4.1 | 19.5 | 36.1 | 5.8 | 5.3 | 16.2 | 13.0 | 0.2 |
| Source: Statistics Canada, Demography Division. | ||||||||
Alberta posts interprovincial migration losses for a second consecutive year
At the provincial and territorial level, population growth is also the result of internal migration exchanges. For the second consecutive year, each of the three Prairie provinces posted interprovincial migration losses. In Alberta, this confirms a continuation in the trend reversal first noted in 2015/2016. After posting the highest interprovincial migration gains for five consecutive years from 2010/2011 to 2014/2015, Alberta saw the biggest losses in 2015/2016 (-15,108) and 2016/2017 (-15,131). In contrast, Ontario (+25,689) and British Columbia (+16,163) had the strongest interprovincial migration gains in 2016/2017. Alberta’s interprovincial migration losses were the highest observed in nearly 30 years (-23,223 in 1987/1988), while Ontario’s interprovincial migratory increase in 2016/2017 reached its highest level in this same period (+35,215 in 1987/1988).
The negative migration growth in Alberta was mainly due to the province’s reduced pull. Specifically, interprovincial migration losses in Alberta were primarily attributable to fewer in-migrants (down 25,879 compared with 2014/2015) rather to more out-migrants (up 10,846 compared with 2014/2015).
Elsewhere in Canada, Nova Scotia posted positive interprovincial migratory increase (+645) for a second straight year, while migration losses in New Brunswick (-849) were considerably lower than the recent levels from 2012/2013 to 2014/2015. Manitoba (-6,906) and Saskatchewan (-5,615) saw the biggest interprovincial migration losses since 2005/2006.
Population growth and economic growth are often related. For example, internal migratory flows can either be a cause or a consequence of the economic situation, including variations in employment, unemployment or the price of certain raw materials. Therefore, Alberta’s interprovincial migration losses in 2015/2016 and 2016/2017 could be related to the less favourable economic conditions recently seen in the province. In 2016, Alberta posted the highest unemployment rate in 20 years, as well as job and wage losses in most sectors.Note 9 In contrast, interprovincial migration gains in Ontario and British Columbia occurred while both provinces were the only ones (along with Quebec) to post a higher number of people working full-time in 2016.Note 10
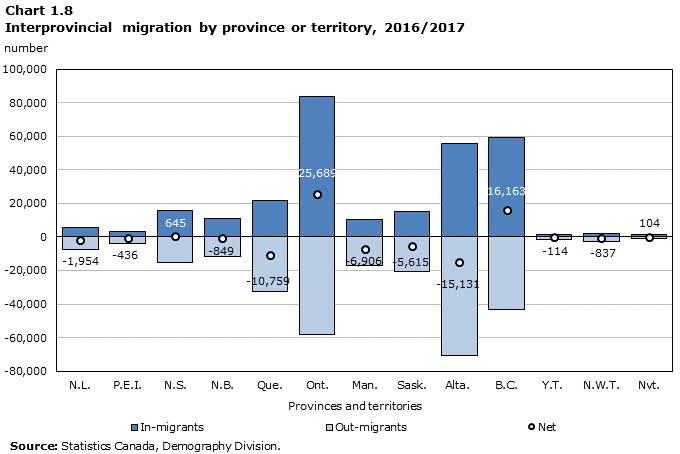
Data table for Chart 1.8
| Provinces and territories | In-migrants | Out-migrants | Net |
|---|---|---|---|
| number | |||
| N.L. | 5,755 | -7,709 | -1,954 |
| P.E.I. | 3,268 | -3,704 | -436 |
| N.S. | 15,616 | -14,971 | 645 |
| N.B. | 11,105 | -11,954 | -849 |
| Que. | 22,007 | -32,766 | -10,759 |
| Ont. | 83,913 | -58,224 | 25,689 |
| Man. | 10,336 | -17,242 | -6,906 |
| Sask. | 15,065 | -20,680 | -5,615 |
| Alta. | 55,661 | -70,792 | -15,131 |
| B.C. | 59,583 | -43,420 | 16,163 |
| Y.T. | 1,470 | -1,584 | -114 |
| N.W.T. | 1,833 | -2,670 | -837 |
| Nvt. | 1,320 | -1,216 | 104 |
| Source: Statistics Canada, Demography Division. | |||
The largest migration flows involve exchanges between Ontario, Alberta and British Columbia
The 30 largest migration flows are shown in the circular chartNote 11 below, in which each province or territory is assigned a colour. Origins and destinations are represented by the circle’s segments. Flows are the same colour as their origin, the width indicates their size and the arrow their direction.
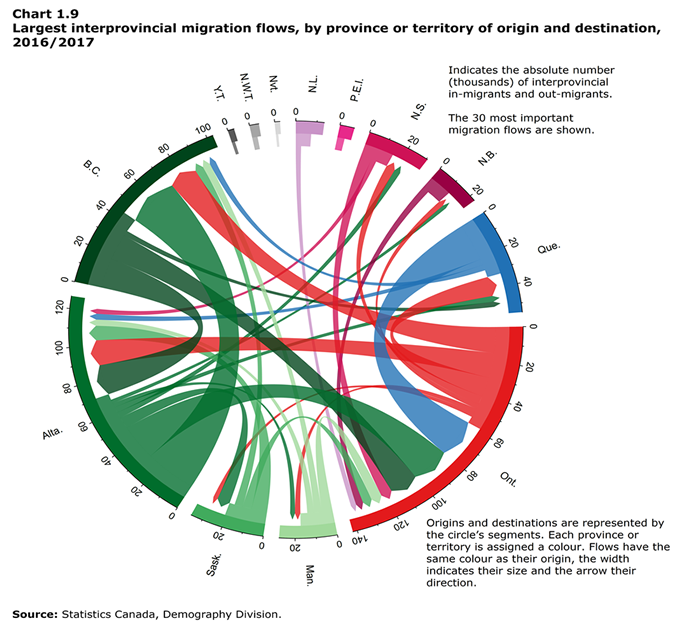
Description for Chart 1.9
Origins and destinations are represented by the circle’s segments. Each province or territory is assigned a colour. Flows have the same colour as their origin, the width indicates their size and the arrow their direction. Indicates the absolute number (thousands) of interprovincial in-migrants and out-migrants. The 30 most important flows are shown.
| Origin | N.L. | P.E.I. | N.S. | N.B. | Que. | Ont. | Man. | Sask. | Alta. | B.C. | Y.T. | N.W.T. | Nvt. |
|---|---|---|---|---|---|---|---|---|---|---|---|---|---|
| Destination | |||||||||||||
| N.L. | Note ...: not available for any reference period | 196 | 1,084 | 442 | 455 | 2,834 | 114 | 137 | 1,733 | 566 | 8 | 49 | 91 |
| P.E.I. | 97 | Note ...: not available for any reference period | 488 | 388 | 143 | 1,635 | 43 | 110 | 444 | 306 | 6 | 27 | 17 |
| N.S. | 575 | 513 | Note ...: not available for any reference period | 1,928 | 819 | 5,984 | 465 | 303 | 2,814 | 1,308 | 32 | 106 | 124 |
| N.B. | 462 | 411 | 2,166 | Note ...: not available for any reference period | 1,594 | 3,860 | 250 | 337 | 1,929 | 764 | 30 | 66 | 85 |
| Que. | 322 | 139 | 880 | 1,785 | Note ...: not available for any reference period | 21,825 | 465 | 321 | 3,436 | 3,343 | 51 | 78 | 121 |
| Ont. | 1,569 | 1,080 | 4,904 | 3,003 | 11,305 | Note ...: not available for any reference period | 2,857 | 2,432 | 14,645 | 15,219 | 359 | 335 | 516 |
| Man. | 152 | 49 | 493 | 258 | 554 | 5,803 | Note ...: not available for any reference period | 2,018 | 3,612 | 4,137 | 47 | 89 | 30 |
| Sask. | 72 | 22 | 307 | 179 | 481 | 4,881 | 1,618 | Note ...: not available for any reference period | 8,476 | 4,505 | 73 | 31 | 35 |
| Alta. | 1,952 | 513 | 3,374 | 2,233 | 3,339 | 20,715 | 2,604 | 6,846 | Note ...: not available for any reference period | 28,197 | 263 | 649 | 107 |
| B.C. | 351 | 267 | 1,590 | 771 | 3,051 | 15,234 | 1,709 | 2,219 | 17,481 | Note ...: not available for any reference period | 441 | 210 | 96 |
| Y.T. | 8 | 29 | 99 | 34 | 54 | 238 | 41 | 120 | 231 | 645 | Note ...: not available for any reference period | 85 | 0 |
| N.W.T. | 120 | 31 | 139 | 39 | 95 | 464 | 57 | 165 | 788 | 538 | 136 | Note ...: not available for any reference period | 98 |
| Nvt. | 75 | 18 | 92 | 45 | 117 | 440 | 113 | 57 | 72 | 55 | 24 | 108 | Note ...: not available for any reference period |
|
... not available for any reference period Source: Statistics Canada, Demography Division. |
|||||||||||||
Over the past year, the largest interprovincial migration flow was from Alberta to British Columbia (28,197 migrants). The flow in the other direction (British Columbia to Alberta) totalled 17,481 migrants; as a result, exchanges between these two provinces resulted in a gain of 10,716 people for British Columbia. These migration flows were key to interpreting the interprovincial migratory increase of each of these two provinces. On one hand, two-thirds of British Columbia’s interprovincial migration gains stemmed from its exchanges with Alberta. On the other, most of Alberta’s losses in interprovincial migration were due to its exchanges with British Columbia. The remainder of Alberta’s losses came primarily from migratory exchanges with Ontario. Over the last year, 20,715 migrants left Alberta for Ontario versus 14,645 migrants who moved from Ontario to Alberta, resulting in a loss of 6,070 people for Alberta. This was also the second consecutive year that Alberta posted migratory losses through exchanges with each of the Atlantic provinces. However, more people left Manitoba and Saskatchewan for Alberta than the opposite.
The second largest interprovincial migration flow in Canada was from Quebec to Ontario (21,825). The size of this flow is mostly due to the demographic weight of these two provinces, being the two most populous, and the fact that they share a border.
In relative terms expressed as rates,Note 12 the largest interprovincial migration flows were from Prince Edward Island to Ontario (+1.1%) and from Saskatchewan to Alberta and vice versa (+0.7% in both directions).
- Date modified: