Language practices of children in francophone families living in a minority linguistic environment
Chapter 3. Descriptive analyses
Archived Content
Information identified as archived is provided for reference, research or recordkeeping purposes. It is not subject to the Government of Canada Web Standards and has not been altered or updated since it was archived. Please "contact us" to request a format other than those available.
The results of our descriptive analyses in this chapter are presented in two sections. Initially, a series of descriptive charts is presented for the set of language practices of these children. This first series of descriptive results is focused more specifically on the predominant use of FrenchNote 1 or EnglishNote 2 by these children in the five personal, extracurricular or recreational activitiesNote 3 that represent their language practices. In the second part of the chapter, a detailed description of the children’s linguistic behaviour with regard to their reading habits is presented and compared against their television viewing habits.
3.1 Predominant use of French and English in children’s language practices
Children’s ages
Regardless of the children’s ages, they used more English than French in their personal, extracurricular or recreational activities. This increased use of English compared with French is illustrated in Chart 3.1 A using five solid lines showing the predominant use of English, which are above the dotted lines showing the predominant use of French. The predominant use of English when these children read, watch television or browse the Internet increased as they grew older while, as a consequence, the predominant use of French decreased accordingly for their language practices in these three areas as the children’s ages increased.
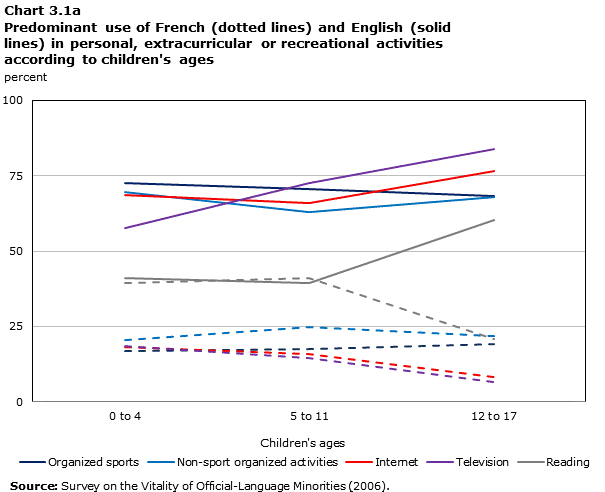
Description of Chart 3.1a
The title of the graph is "Chart 3.1a Predominant use of French (dotted lines) and English (solid lines) in personal, extracurricular or recreational activities according to children's ages."
This is a line chart.
There are in total 3 categories in the horizontal axis. The vertical axis starts at 0 and ends at 100 with ticks every 25 points.
There are 10 series in this graph.
The vertical axis is "percent."
The horizontal axis is "Children's ages."
The title of series 1 is "Organized sports."
The minimum value is 68.2 and it corresponds to "12 to 17."
The maximum value is 72.5 and it corresponds to "0 to 4."
The title of series 2 is "Non-sport organized activities."
The minimum value is 63.1 and it corresponds to "5 to 11."
The maximum value is 69.5 and it corresponds to "0 to 4."
The title of series 3 is "Internet."
The minimum value is 65.8 and it corresponds to "5 to 11."
The maximum value is 76.4 and it corresponds to "12 to 17."
The title of series 4 is "Television."
The minimum value is 57.5 and it corresponds to "0 to 4."
The maximum value is 83.7 and it corresponds to "12 to 17."
The title of series 5 is "Reading."
The minimum value is 39.4 and it corresponds to "5 to 11."
The maximum value is 60.2 and it corresponds to "12 to 17."
The title of series 6 is "Organized sports."
The minimum value is 16.9 and it corresponds to "0 to 4."
The maximum value is 19.2 and it corresponds to "12 to 17."
The title of series 7 is "Non-sport organized activities."
The minimum value is 20.4 and it corresponds to "0 to 4."
The maximum value is 24.7 and it corresponds to "5 to 11."
The title of series 8 is "Internet."
The minimum value is 8.3 and it corresponds to "12 to 17."
The maximum value is 18.2 and it corresponds to "0 to 4."
The title of series 9 is "Television."
The minimum value is 6.6 and it corresponds to "12 to 17."
The maximum value is 18.5 and it corresponds to "0 to 4."
The title of series 10 is "Reading."
The minimum value is 20.9 and it corresponds to "12 to 17."
The maximum value is 40.9 and it corresponds to "5 to 11."
| Organized sports | Non-sport organized activities | Internet | Television | Reading | Organized sports | Non-sport organized activities | Internet | Television | Reading | |
|---|---|---|---|---|---|---|---|---|---|---|
| percentage | ||||||||||
| 0 to 4 | 72.5 | 69.5 | 68.5 | 57.5 | 41.1 | 16.9 | 20.4 | 18.2 | 18.5 | 39.5 |
| 5 to 11 | 70.7 | 63.1 | 65.8 | 72.6 | 39.4 | 17.6 | 24.7 | 15.8 | 14.4 | 40.9 |
| 12 to 17 | 68.2 | 68.0 | 76.4 | 83.7 | 60.2 | 19.2 | 21.8 | 8.3 | 6.6 | 20.9 |
| Source: Survey on the Vitality of Official-Language Minorities (2006). | ||||||||||
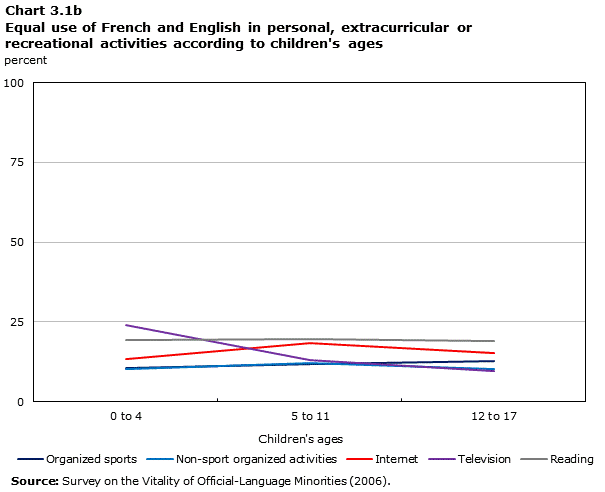
Description of Chart 3.1b
The title of the graph is "Chart 3.1b Equal use of French and English in personal, extracurricular or recreational acitivities according to children's ages."
This is a line chart.
There are in total 3 categories in the horizontal axis. The vertical axis starts at 0 and ends at 100 with ticks every 25 points.
There are 5 series in this graph.
The vertical axis is "percent."
The horizontal axis is "Children's ages."
The title of series 1 is "Organized sports."
The minimum value is 10.6 and it corresponds to "0 to 4."
The maximum value is 12.6 and it corresponds to "12 to 17."
The title of series 2 is "Non-sport organized activities."
The minimum value is 10.1 and it corresponds to "0 to 4."
The maximum value is 12.2 and it corresponds to "5 to 11."
The title of series 3 is "Internet."
The minimum value is 13.3 and it corresponds to "0 to 4."
The maximum value is 18.4 and it corresponds to "5 to 11."
The title of series 4 is "Television."
The minimum value is 9.7 and it corresponds to "12 to 17."
The maximum value is 24.0 and it corresponds to "0 to 4."
The title of series 5 is "Reading."
The minimum value is 18.9 and it corresponds to "12 to 17."
The maximum value is 19.7 and it corresponds to "5 to 11."
| Organized sports | Non-sport organized activities | Internet | Television | Reading | |
|---|---|---|---|---|---|
| percentage | |||||
| 0 to 4 | 10.6 | 10.1 | 13.3 | 24.0 | 19.4 |
| 5 to 11 | 11.7 | 12.2 | 18.4 | 13.0 | 19.7 |
| 12 to 17 | 12.6 | 10.2 | 15.3 | 9.7 | 18.9 |
| Source: Survey on the Vitality of Official-Language Minorities (2006). | |||||
The dark grey lines in the middle portion of Chart 3.1 A illustrate the distinct nature of the language used for reading compared with the language practices relating to the other activities. At a young age (i.e., 11 or under), the proportions relating to the predominant use of French are similar to those for English. However, the gap widens considerably in favour of the use of English for children aged 12 to 17. This change in the language used by the children for reading can partly be explained by the fact that they were attending school. Corbeil and Lafrenière (2010) in fact showed that in many cases the transition from elementary school to secondary school also signifies a transition from French school to English school. This shift towards English-language schooling could thus explain the increase in reading in English and the decrease in reading in French starting at age 12. With regard to the children’s language practices in the other activities, Chart 3.1 A shows that the predominant use of French never exceeds 25%, while the use of English is very prevalent. As well, Charts 3.1 A and B show that as the children grew older they were more likely to watch television in English, while the predominant use of French and of both languages equally decreased at the same time. Lastly, it is worth noting that, as Chart 3.1 B shows, the equal use of French and English remained stable, at between 10% and 20%, at all ages and for all activities in the study, except in the case of television, as noted earlier.
Mother tongue and language spoken at home by these children
The results illustrated in Charts 3.2 A, B and C indicate that there was little change in the use of French and English in the personal, extracurricular or recreational activities of these children depending on whether the mother tongue or the language spoken most often at home was taken into account; in other words, the variation in their language practices is similar for the two variables being studied. The following charts show that the children were more likely to use English rather than French in their activities. This observation is particularly relevant for those whose mother tongue was English or who spoke English most often at home. Their level of use of English was generally above 90% (Chart 3.2 B), while the level for the use of French was below 3% (Chart 3.2 A).
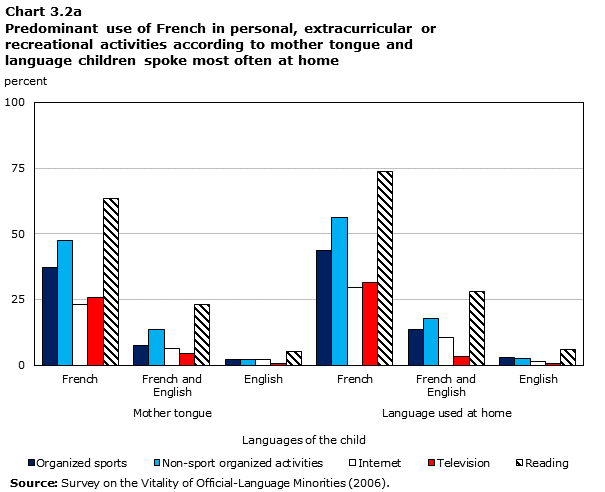
Description of Chart 3.2a
The title of the graph is "Chart 3.2a Predominant use of French in personal, extracurricular or recreational activities according to mother tongue and language children spoke most often at home."
This is a column clustered chart.
There are in total 6 categories in the horizontal axis. The vertical axis starts at 0 and ends at 100 with ticks every 25 points.
There are 5 series in this graph.
The vertical axis is "percent."
The horizontal axis is "Languages of the child."
The title of series 1 is "Organized sports."
The minimum value is 2.3 and it corresponds to "Mother tongue English."
The maximum value is 43.5 and it corresponds to "Language used at home French."
The title of series 2 is "Non-sport organized activities."
The minimum value is 2.0 and it corresponds to "Mother tongue English."
The maximum value is 56.2 and it corresponds to "Language used at home French."
The title of series 3 is "Internet."
The minimum value is 1.3 and it corresponds to "Language used at home English."
The maximum value is 29.5 and it corresponds to "Language used at home French."
The title of series 4 is "Television."
The minimum value is 0.5 and it corresponds to "Language used at home English."
The maximum value is 31.5 and it corresponds to "Language used at home French."
The title of series 5 is "Reading."
The minimum value is 5.2 and it corresponds to "Mother tongue English."
The maximum value is 73.7 and it corresponds to "Language used at home French."
| Organized sports | Non-sport organized activities | Internet | Television | Reading | |
|---|---|---|---|---|---|
| percentage | |||||
| Mother tongue French | 43.5 | 35.1 | 48.6 | 51.8 | 15.7 |
| Mother tongue French and English | 77.9 | 71.8 | 74.2 | 77.2 | 34.1 |
| Mother tongue English | 92.9 | 93.4 | 92.4 | 95.5 | 82.1 |
| Language used at home French | 35.6 | 25.6 | 38.8 | 42.0 | 7.8 |
| Language used at home French and English | 67.6 | 59.2 | 67.4 | 74.7 | 26.0 |
| Language used at home English | 91.7 | 93.0 | 92.3 | 95.5 | 78.2 |
| Source: Survey on the Vitality of Official-Language Minorities (2006). | |||||
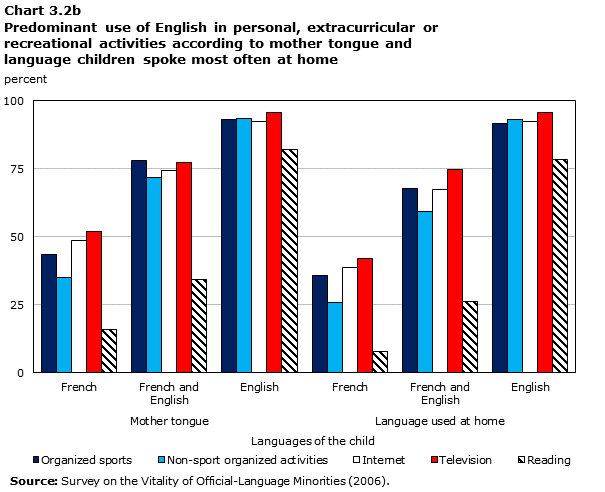
Description of Chart 3.2b
The title of the graph is "Chart 3.2b Predominant use of English in personal, extracurricular or recreational activities according to mother tongue and language children spoke most often at home."
This is a column clustered chart.
There are in total 6 categories in the horizontal axis. The vertical axis starts at 0 and ends at 100 with ticks every 25 points.
There are 5 series in this graph.
The vertical axis is "percent."
The horizontal axis is "Language of the child."
The title of series 1 is "Organized sports."
The minimum value is 2.3 and it corresponds to "Mother tongue English."
The maximum value is 43.5 and it corresponds to "Language used at home French."
The title of series 2 is "Non-sport organized activities."
The minimum value is 2.0 and it corresponds to "Mother tongue English."
The maximum value is 56.2 and it corresponds to "Language used at home French."
The title of series 3 is "Internet."
The minimum value is 1.3 and it corresponds to "Language used at home English."
The maximum value is 29.5 and it corresponds to "Language used at home French."
The title of series 4 is "Television."
The minimum value is 0.5 and it corresponds to "Language used at home English."
The maximum value is 31.5 and it corresponds to "Language used at home French."
The title of series 5 is "Reading."
The minimum value is 5.2 and it corresponds to "Mother tongue English."
The maximum value is 73.7 and it corresponds to "Language used at home French."
| Organized sports | Non-sport organized activities | Internet | Television | Reading | |
|---|---|---|---|---|---|
| percentage | |||||
| Mother tongue French | 37.2 | 47.3 | 23.2 | 25.8 | 63.4 |
| Mother tongue French and English | 7.3 | 13.7 | 6.3 | 4.3 | 22.9 |
| Mother tongue English | 2.3 | 2.0 | 2.1 | 0.6 | 5.2 |
| Language used at home French | 43.5 | 56.2 | 29.5 | 31.5 | 73.7 |
| Language used at home French and English | 13.6 | 17.8 | 10.4 | 3.4 | 28.1 |
| Language used at home English | 2.7 | 2.4 | 1.3 | 0.5 | 5.9 |
| Source: Survey on the Vitality of Official-Language Minorities (2006). | |||||
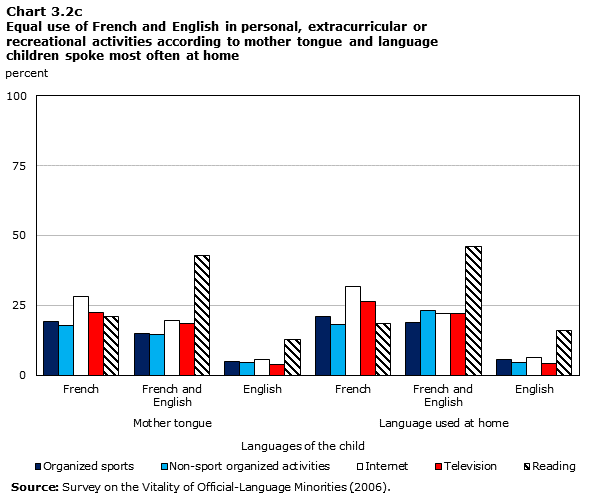
Description of Chart 3.2c
The title of the graph is "Chart 3.2c Equal use of French and English in personal, extracurricular or recreational activities according to mother tongue and language children spoke most often at home
."
This is a column clustered chart.
There are in total 6 categories in the horizontal axis. The vertical axis starts at 0 and ends at 100 with ticks every 25 points.
There are 5 series in this graph.
The vertical axis is "percent."
The horizontal axis is "Languages of the child."
The title of series 1 is "Organized sports."
The minimum value is 4.8 and it corresponds to "Mother tongue English."
The maximum value is 20.9 and it corresponds to "Language used at home French."
The title of series 2 is "Non-sport organized activities."
The minimum value is 4.6 and it corresponds to "Mother tongue English and Language used at home English."
The maximum value is 23.0 and it corresponds to "Language used at home French and English."
The title of series 3 is "Internet."
The minimum value is 5.5 and it corresponds to "Mother tongue English."
The maximum value is 31.7 and it corresponds to "Language used at home French."
The title of series 4 is "Television."
The minimum value is 3.9 and it corresponds to "Mother tongue English."
The maximum value is 26.5 and it corresponds to "Language used at home French."
The title of series 5 is "Reading."
The minimum value is 12.7 and it corresponds to "Mother tongue English."
The maximum value is 45.9 and it corresponds to "Language used at home French and English."
| Organized sports | Non-sport organized activities | Internet | Television | Reading | |
|---|---|---|---|---|---|
| percentage | |||||
| Mother tongue French | 19.3 | 17.6 | 28.2 | 22.4 | 20.9 |
| Mother tongue French and English | 14.8 | 14.5 | 19.5 | 18.5 | 43.0 |
| Mother tongue English | 4.8 | 4.6 | 5.5 | 3.9 | 12.7 |
| Language used at home French | 20.9 | 18.2 | 31.7 | 26.5 | 18.5 |
| Language used at home French and English | 18.8 | 23.0 | 22.2 | 21.9 | 45.9 |
| Language used at home English | 5.6 | 4.6 | 6.4 | 4.0 | 15.9 |
| Source: Survey on the Vitality of Official-Language Minorities (2006). | |||||
Charts 3.2 A, B and C show that children who had French as their mother tongue or as the language spoken most often at home did not systematically use more French than English in their personal, extracurricular or recreational activities. They nonetheless had a stronger tendency to use French in their activities rather than English, particularly for reading and while participating in sports and non-sports-related activities. The percentages relating to the predominant use of French for reading by children who had French as their mother tongue or who spoke French most often at home are 63.4% and 73.7% respectively. In comparison, the use of English was at a level of 15.7% for children who had French as their mother tongue and 7.8% for those who spoke French more often at home. At the same time, the francophone children in the studyNote 4 used French more than English when they participated in organized sports and non-sports-related activities. We note, moreover, that English was more commonly used than French when these children watched television or browsed the Internet, regardless of their mother tongue or the language spoken most often at home.
For children who did not have French as their mother tongue or as the language used most often at home, only the language used for reading differs from that used in the other activities. Although the predominant use of English among such children was more prevalent than the use of French, the use of English for reading overall was at a lower level than for the other language practice variables. For example, the percentages relating to the use of English for reading are 82.1% and 78.2% respectively for children who had English as their mother tongue or as the language spoken at home, while the percentages associated with their language practices in the other activities are higher than 90% (Chart 3.2 B). Conversely, the proportions relating to the predominant use of French for reading are 5.2% and 5.9% respectively for children who had English as their mother tongue or as the language spoken most often at home, while the proportions for the use of French are less than 3% for their language practices in the other activities (Chart 3.2 A). Chart 3.2 C shows that children deemed to be anglophone (based on the mother tongue or the language used most often at home) were more likely to use both languages equally for reading rather than just French or in relation to the other personal, extracurricular or recreational activities of the children in the study. For example, 12.7% of children whose mother tongue was English used French and English equally when they read, while the proportions relating to the use of both languages equally range from 3.9% to 5.5% for the other activities. A similar pattern exists for children whose language spoken most often at home is English.Note 5 In short, not surprisingly, children who had at least one parent who was part of the francophone minority and who had English as their mother tongue or who spoke English most often at home used significantly more English than French for reading, but to a lesser degree compared with the other personal, extracurricular or recreational activities.
Children’s linguistic trajectory with their friends
The children’s language practices in their activities are tied to their linguistic trajectories with their friends, and Charts 3.3 A and B illustrate the strength and direction of those connections. The predominant use of French in activities, as shown in Chart 3.3 A, is very low for children who had an anglophone trajectory with their friends, while it is slightly higher for those who had a bilingual trajectoryNote 6 and significantly higher for those who had a francophone trajectory with their friends. For example, the proportions relating to the use of French range from 0.9% to 5.2% for children who had an anglophone trajectory with their friends but from 39.2% to 80.0% for those who had a francophone trajectory. A comparable phenomenon is seen in Chart 3.3 B with regard to the predominant use of English. The chart shows that the use of English in activities is low for those children who had a francophone trajectory with their friends (between 3.2% and 34.8%) but slightly higher for children who had a bilingual trajectoryNote 7 and much higher for those who had an anglophone trajectory (between 81.2% and 94.1%).
The language used for reading stands out from the other personal, extracurricular or recreational activities of these children when it is considered in relation to the linguistic trajectory with friends. Chart 3.3 A reveals that the proportions relating to the children’s use of French for reading are systematically higher than the other proportions relating to the use of French, regardless of the language of the trajectory with friends. As a corollary, Chart 3.3 B shows that the proportions relating to the use of English when children read are invariably lower than the other proportions relating to the use of English, regardless of the language of the trajectory with friends. Finally, we note that, for those who had a bilingual trajectoryNote 8 with their friends, the proportion relating to the use of French for reading is higher than the proportion relating to the use of English (38.5% (Chart 3.3 A) compared with 29.8% (Chart 3.3 B)), while these children are much more likely to use English than French in their other activities.
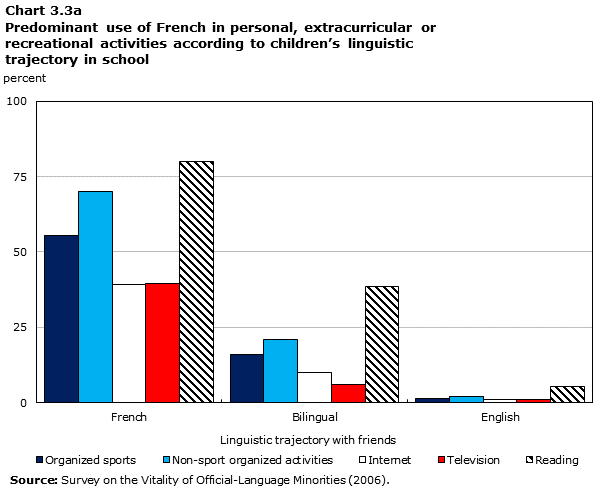
Description of Chart 3.3a
The title of the graph is "Chart 3.3a Predominant use of French in personal, extracurricular or recreational activities according to children's linguistic trajectory in school."
This is a column clustered chart.
There are in total 3 categories in the horizontal axis. The vertical axis starts at 0 and ends at 100 with ticks every 25 points.
There are 5 series in this graph.
The vertical axis is "percent."
The horizontal axis is "Linguistic trajectory with friends."
The title of series 1 is "Organized sports."
The minimum value is 1.4 and it corresponds to "English."
The maximum value is 55.5 and it corresponds to "French."
The title of series 2 is "Non-sport organized activities."
The minimum value is 1.9 and it corresponds to "English."
The maximum value is 70.0 and it corresponds to "French."
The title of series 3 is "Internet."
The minimum value is 0.9 and it corresponds to "English."
The maximum value is 39.2 and it corresponds to "French."
The title of series 4 is "Television."
The minimum value is 0.9 and it corresponds to "English."
The maximum value is 39.4 and it corresponds to "French."
The title of series 5 is "Reading."
The minimum value is 5.2 and it corresponds to "English."
The maximum value is 80.0 and it corresponds to "French."
| Organized sports | Non-sport organized activities | Internet | Television | Reading | |
|---|---|---|---|---|---|
| percentage | |||||
| French | 55.5 | 70.0 | 39.2 | 39.4 | 80.0 |
| Bilingual | 15.9 | 21.1 | 9.9 | 6.0 | 38.5 |
| English | 1.4 | 1.9 | 0.9 | 0.9 | 5.2 |
| Source: Survey on the Vitality of Official-Language Minorities (2006). | |||||
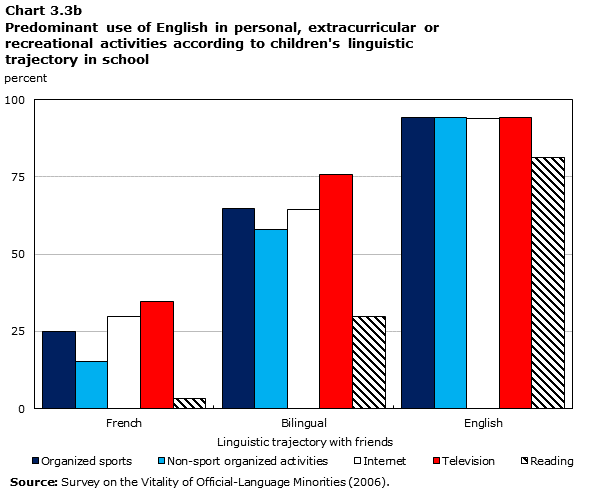
Description of Chart 3.3b
The title of the graph is "Chart 3.3b Predominant use of English in personal, extracurricular or recreational activities according to children's linguistic trajectory in school."
This is a column clustered chart.
There are in total 3 categories in the horizontal axis. The vertical axis starts at 0 and ends at 100 with ticks every 25 points.
There are 5 series in this graph.
The vertical axis is "percent."
The horizontal axis is "Linguistic trajectory with friends."
The title of series 1 is "Organized sports."
The minimum value is 25.0 and it corresponds to "French."
The maximum value is 94.1 and it corresponds to "English."
The title of series 2 is "Non-sport organized activities."
The minimum value is 15.2 and it corresponds to "French."
The maximum value is 94.1 and it corresponds to "English."
The title of series 3 is "Internet."
The minimum value is 29.8 and it corresponds to "French."
The maximum value is 94.0 and it corresponds to "English."
The title of series 4 is "Television."
The minimum value is 34.8 and it corresponds to "French."
The maximum value is 94.1 and it corresponds to "English."
The title of series 5 is "Reading."
The minimum value is 3.2 and it corresponds to "French."
The maximum value is 81.2 and it corresponds to "English."
| Organized sports | Non-sport organized activities | Internet | Television | Reading | |
|---|---|---|---|---|---|
| percentage | |||||
| French | 25.0 | 15.2 | 29.8 | 34.8 | 3.2 |
| Bilingual | 64.8 | 58.0 | 64.5 | 75.9 | 29.8 |
| English | 94.1 | 94.1 | 94.0 | 94.1 | 81.2 |
| Source: Survey on the Vitality of Official-Language Minorities (2006). | |||||
Children’s linguistic trajectory in school
As we saw earlier with regard to these children’s linguistic trajectories with their friends, there is an apparent connection between their linguistic trajectories in school and their linguistic behaviour in their personal, extracurricular or recreational activities. Charts 3.4 A and B show that those who had an anglophone trajectory in school used mainly English in their activities and used very little French. The proportions relating to their use of English range from 93.5% to 98.1%, and the proportions associated with their use of French are 1% or under. Children who had a bilingual school trajectoryNote 9 also used more English than French in their language practices (between 67.9% and 91.7% for the use of English compared with 10% or under for the use of French). The use of English by children who had a bilingual school trajectory,Note 10 in contrast with those who had an anglophone school trajectory, are slightly lower, and the proportions relating to the use of French are slightly higher. Children who had a bilingual school trajectoryNote 11 were more likely to use French and English equally in their activities rather than French only, particularly for reading, while the proportion of use for both languages equally is 22%.Note 12
Children who had a francophone trajectory in school used mostly English in their activities, except in the case of reading. While just over half of those who had a francophone trajectory in school used primarily French when they read (53.2%), and one-fifth of them used English, the proportions relating to the use of English in the other activities were higher (sometimes significantly so) than the use of French. The following charts illustrate the predominant use of English compared with French in activities, irrespective of the language of the child’s linguistic trajectory in school. Although the predominant use of French is higher when the child had a francophone trajectory in school,Note 13 the use of English continued to dominate, except in the case of reading and, to a lesser extent, organized non-sports-related activities.
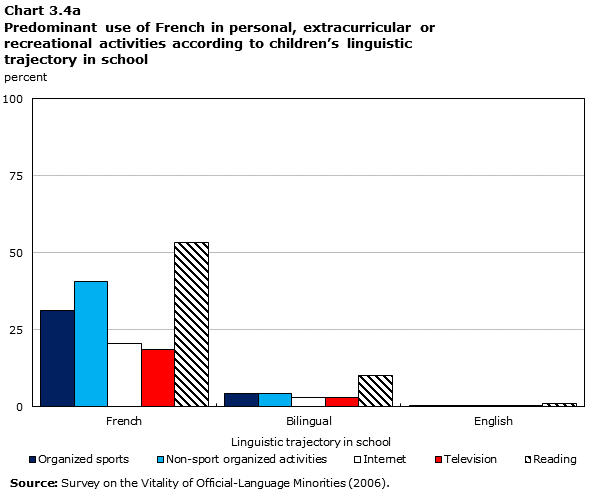
Description of Chart 3.4a
The title of the graph is "Chart 3.4a Predominant use of French in personal, extracurricular or recreational activities according to children's linguistic trajectory in school."
This is a column clustered chart.
There are in total 3 categories in the horizontal axis. The vertical axis starts at 0 and ends at 100 with ticks every 25 points.
There are 5 series in this graph.
The vertical axis is "percent."
The horizontal axis is "Linguistic trajectory in school."
The title of series 1 is "Organized sports."
The minimum value is 0.2 and it corresponds to "English."
The maximum value is 31.3 and it corresponds to "French."
The title of series 2 is "Non-sport organized activities."
The minimum value is 0.4 and it corresponds to "English."
The maximum value is 40.8 and it corresponds to "French."
The title of series 3 is "Internet."
The minimum value is 0.4 and it corresponds to "English."
The maximum value is 20.5 and it corresponds to "French."
The title of series 4 is "Television."
The minimum value is 0.2 and it corresponds to "English."
The maximum value is 18.4 and it corresponds to "French."
The title of series 5 is "Reading."
The minimum value is 1.0 and it corresponds to "English."
The maximum value is 53.2 and it corresponds to "French."
| Organized sports | Non-sport organized activities | Internet | Television | Reading | |
|---|---|---|---|---|---|
| percentage | |||||
| French | 31.3 | 40.8 | 20.5 | 18.4 | 53.2 |
| Bilingual | 4.2 | 4.1 | 2.8 | 2.8 | 10.1 |
| English | 0.2 | 0.4 | 0.4 | 0.2 | 1.0 |
| Source: Survey on the Vitality of Official-Language Minorities (2006). | |||||
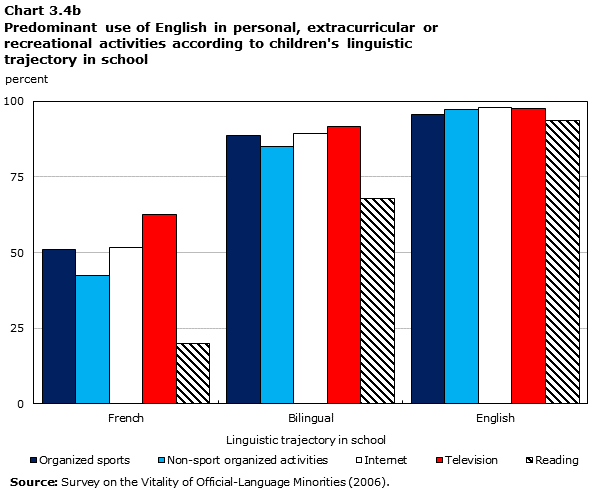
Description of Chart 3.4b
The title of the graph is "Chart 3.4b Predominant use of English in personal, extracurricular or recreational activities according to children's linguistic trajectory in school."
This is a column clustered chart.
There are in total 3 categories in the horizontal axis. The vertical axis starts at 0 and ends at 100 with ticks every 25 points.
There are 5 series in this graph.
The vertical axis is "percent."
The horizontal axis is "Linguistic trajectory in school."
The title of series 1 is "Organized sports."
The minimum value is 51.1 and it corresponds to "French."
The maximum value is 95.7 and it corresponds to "English."
The title of series 2 is "Non-sport organized activities."
The minimum value is 42.4 and it corresponds to "French."
The maximum value is 97.4 and it corresponds to "English."
The title of series 3 is "Internet."
The minimum value is 51.7 and it corresponds to "French."
The maximum value is 98.1 and it corresponds to "English."
The title of series 4 is "Television."
The minimum value is 62.7 and it corresponds to "French."
The maximum value is 97.5 and it corresponds to "English."
The title of series 5 is "Reading."
The minimum value is 20.0 and it corresponds to "French."
The maximum value is 93.5 and it corresponds to "English."
| Organized sports | Non-sport organized activities | Internet | Television | Reading | |
|---|---|---|---|---|---|
| percentage | |||||
| French | 51.1 | 42.4 | 51.7 | 62.7 | 20.0 |
| Bilingual | 88.6 | 85.1 | 89.3 | 91.7 | 67.9 |
| English | 95.7 | 97.4 | 98.1 | 97.5 | 93.5 |
| Source: Survey on the Vitality of Official-Language Minorities (2006). | |||||
Language composition of couple composed of child’s biological parentsNote 14
The family language environment in which children have been immersed since birth influences their language choices in their personal, extracurricular or recreational activities. Children born to parents who compose an endogamous francophone couple have language behaviours that differ from those whose parents compose other types of couples from a language perspective. The following charts, 3.5 A and B, also show that the preferred language for reading is different from that for the other activities. These results are consistent with what has been seen in the existing literature on this subject. For example, Chart 3.5 B shows that children whose parents composed a linguistically exogamous couple in which the mother was francophone were somewhat less likely to use English as the predominant language than children from linguistically exogamous couples in which the father was francophone, except with regard to reading. This finding is in line with those that emerged from the studies by Bouchard-Coulombe (2011) and Vézina and Houle (2014), which revealed that the mother plays a decisive role in language transmission. The fact that the language used for reading constitutes an exception can be explained by the fact that reading is probably more strongly influenced by the language used at school, the region of residence and the linguistic context of the community in which a child lives.
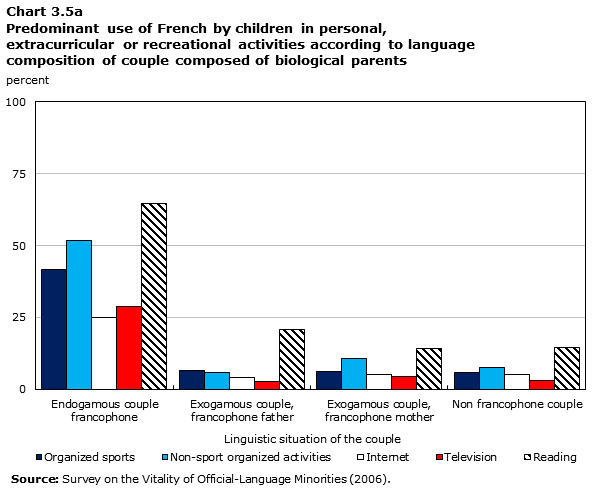
Description of Chart 3.5a
The title of the graph is "Chart 3.5a Predominant use of French by children in personal, extracurricular or recreational activities according to language composition of couple composed of biological parents."
This is a column clustered chart.
There are in total 4 categories in the horizontal axis. The vertical axis starts at 0 and ends at 100 with ticks every 25 points.
There are 5 series in this graph.
The vertical axis is "percent."
The horizontal axis is "Linguistic situation of the couple."
The title of series 1 is "Organized sports."
The minimum value is 5.8 and it corresponds to "Non francophone couple."
The maximum value is 41.8 and it corresponds to "Endogamous couple francophone."
The title of series 2 is "Non-sport organized activities."
The minimum value is 5.8 and it corresponds to "Exogamous couple, francophone father."
The maximum value is 51.7 and it corresponds to "Endogamous couple francophone."
The title of series 3 is "Internet."
The minimum value is 4.2 and it corresponds to "Exogamous couple, francophone father."
The maximum value is 25.0 and it corresponds to "Endogamous couple francophone."
The title of series 4 is "Television."
The minimum value is 2.7 and it corresponds to "Exogamous couple, francophone father."
The maximum value is 28.7 and it corresponds to "Endogamous couple francophone."
The title of series 5 is "Reading."
The minimum value is 14.1 and it corresponds to "Exogamous couple, francophone mother."
The maximum value is 64.5 and it corresponds to "Endogamous couple francophone."
| Organized sports | Non-sport organized activities | Internet | Television | Reading | |
|---|---|---|---|---|---|
| percentage | |||||
| Endogamous couple francophone | 41.8 | 51.7 | 25.0 | 28.7 | 64.5 |
| Exogamous couple, francophone father | 6.7 | 5.8 | 4.2 | 2.7 | 20.7 |
| Exogamous couple, francophone mother | 6.3 | 10.7 | 5.3 | 4.5 | 14.1 |
| Non francophone couple | 5.8 | 7.7 | 5.2 | 3.0 | 14.7 |
| Source: Survey on the Vitality of Official-Language Minorities (2006). | |||||
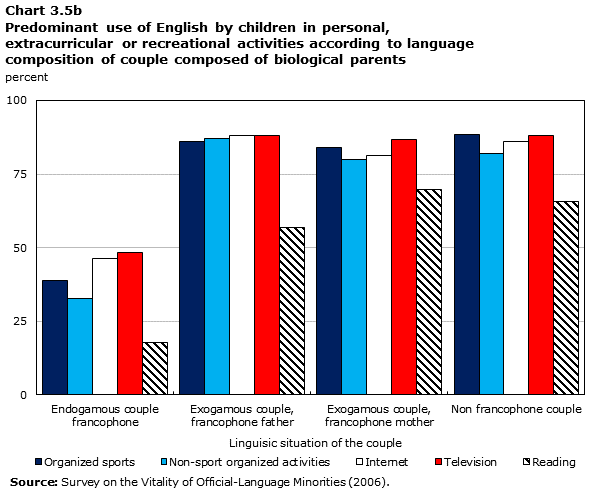
Description of Chart 3.5b
The title of the graph is "Chart 3.5b Predominant use of English by children in personal, extracurricular or recreational activities according to language composition of couple composed of biological parents."
This is a column clustered chart.
There are in total 4 categories in the horizontal axis. The vertical axis starts at 0 and ends at 100 with ticks every 25 points.
There are 5 series in this graph.
The vertical axis is "percent."
The horizontal axis is "Linguisic situation of the couple."
The title of series 1 is "Organized sports."
The minimum value is 38.8 and it corresponds to "Endogamous couple francophone."
The maximum value is 88.3 and it corresponds to "Non francophone couple."
The title of series 2 is "Non-sport organized activities."
The minimum value is 32.9 and it corresponds to "Endogamous couple francophone."
The maximum value is 87.1 and it corresponds to "Exogamous couple, francophone father."
The title of series 3 is "Internet."
The minimum value is 46.5 and it corresponds to "Endogamous couple francophone."
The maximum value is 88.0 and it corresponds to "Exogamous couple, francophone father."
The title of series 4 is "Television."
The minimum value is 48.4 and it corresponds to "Endogamous couple francophone."
The maximum value is 88.1 and it corresponds to "Exogamous couple, francophone father."
The title of series 5 is "Reading."
The minimum value is 17.7 and it corresponds to "Endogamous couple francophone."
The maximum value is 69.9 and it corresponds to "Exogamous couple, francophone mother."
| Organized sports | Non-sport organized activities | Internet | Television | Reading | |
|---|---|---|---|---|---|
| percentage | |||||
| Endogamous couple francophone | 38.8 | 32.9 | 46.5 | 48.4 | 17.7 |
| Exogamous couple, francophone father | 86.0 | 87.1 | 88.0 | 88.1 | 56.8 |
| Exogamous couple, francophone mother | 84.0 | 80.1 | 81.5 | 86.9 | 69.9 |
| Non francophone couple | 88.3 | 82.0 | 86.1 | 88.0 | 65.7 |
| Source: Survey on the Vitality of Official-Language Minorities (2006). | |||||
The language behaviours of children born to parents comprising an endogamous francophone couple differ from those of children whose parents compose other types of couples from a linguistic perspective, because they use more French in their personal, extracurricular or recreational activities. Chart 3.5 A reveals that children born to parents comprising an endogamous francophone couple use French more for reading and in organized sports and non-sports-related activities than children of parents comprising another type of couple. Generally speaking, the proportions relating to their use of French exceed 25% (sometimes by a wide margin), while the use of French by children whose parents compose other linguistic types of couples is never greater than 20%.
Chart 3.5 A also reveals that watching television and browsing the Internet differ from the other activities for these children whose parents compose an endogamous francophone couple. These children are in fact more likely to use English as the predominant language rather than French when they watch television (48.3% for English versus 28.8% for French) and when they browse the Internet (46.2% for English versus 25.1% for French). In fact, irrespective of the couple’s language composition, the previous charts indicate that the language behaviours of these children when watching television or browsing the Internet differ from those associated with the other activities in that the use of English tends to be high and the use of French particularly low.
Finally, it can be seen that the linguistic behaviour of these children for reading differs from the behaviours associated with the other activities. The use of English for reading is in fact systematically lower than for the other activities, irrespective of the couple’s language composition.
Highest level of education attained by children’s parents
Charts 3.6 A and B (mother’s education) as well as the charts in Appendix 4 (father’s education) reveal that there are no significant differences between the effect of the mother’s education and the father’s education on these children’s language practices. The trends observed in Charts 3.6 A and B and the charts in Appendix 4 are very similar.
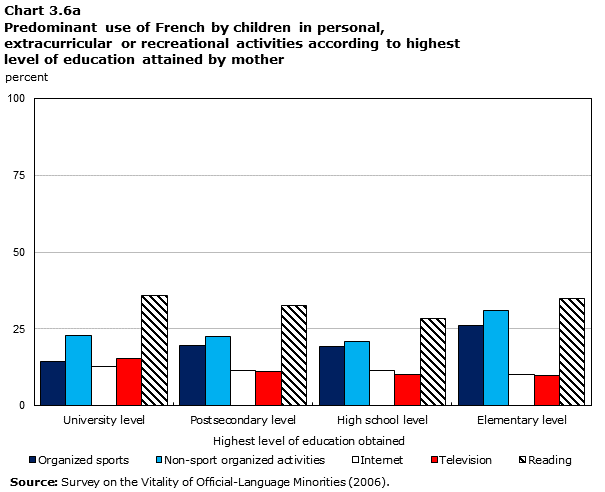
Description of Chart 3.6a
The title of the graph is "Chart 3.6a Predominant use of French by children in personal, extracurricular or recreational activities according to highest level of education attained by mother."
This is a column clustered chart.
There are in total 4 categories in the horizontal axis. The vertical axis starts at 0 and ends at 100 with ticks every 25 points.
There are 5 series in this graph.
The vertical axis is "percent."
The horizontal axis is "Highest level of education obtained."
The title of series 1 is "Organized sports."
The minimum value is 14.5 and it corresponds to "University level."
The maximum value is 26.0 and it corresponds to "Elementary level."
The title of series 2 is "Non-sport organized activities."
The minimum value is 20.8 and it corresponds to "High school level."
The maximum value is 31.1 and it corresponds to "Elementary level."
The title of series 3 is "Internet."
The minimum value is 10.3 and it corresponds to "Elementary level."
The maximum value is 12.7 and it corresponds to "University level."
The title of series 4 is "Television."
The minimum value is 10.0 and it corresponds to "High school level and Elementary level."
The maximum value is 15.2 and it corresponds to "University level."
The title of series 5 is "Reading."
The minimum value is 28.5 and it corresponds to "High school level."
The maximum value is 35.9 and it corresponds to "University level."
| Organized sports | Non-sport organized activities | Internet | Television | Reading | |
|---|---|---|---|---|---|
| percentage | |||||
| University level | 14.5 | 22.8 | 12.7 | 15.2 | 35.9 |
| Postsecondary level | 19.5 | 22.4 | 11.4 | 11.1 | 32.5 |
| High school level | 19.3 | 20.8 | 11.4 | 10.0 | 28.5 |
| Elementary level | 26.0 | 31.1 | 10.3 | 10.0 | 34.9 |
| Source: Survey on the Vitality of Official-Language Minorities (2006). | |||||
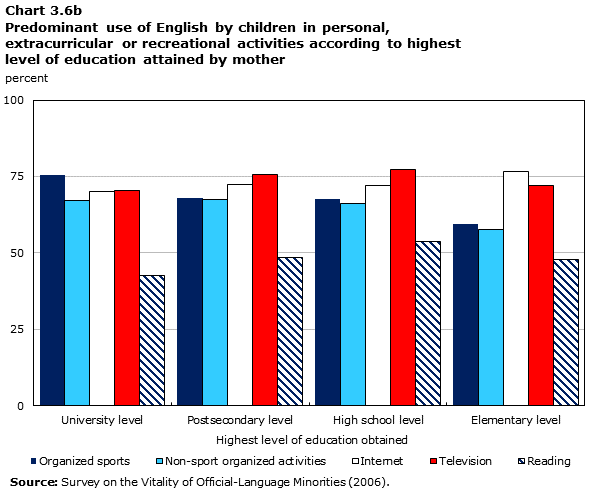
Description of Chart 3.6b
The title of the graph is "Chart 3.6b Predominant use of English by children in personal, extracurricular or recreational activities according to highest level of education attained by mother."
This is a column clustered chart.
There are in total 4 categories in the horizontal axis. The vertical axis starts at 0 and ends at 100 with ticks every 25 points.
There are 5 series in this graph.
The vertical axis is "percent."
The horizontal axis is "Highest level of education obtained."
The title of series 1 is "Organized sports."
The minimum value is 59.5 and it corresponds to "Elementary level."
The maximum value is 75.4 and it corresponds to "University level."
The title of series 2 is "Non-sport organized activities."
The minimum value is 57.7 and it corresponds to "Elementary level."
The maximum value is 67.3 and it corresponds to "Postsecondary level."
The title of series 3 is "Internet."
The minimum value is 70.1 and it corresponds to "University level."
The maximum value is 76.6 and it corresponds to "Elementary level."
The title of series 4 is "Television."
The minimum value is 70.3 and it corresponds to "University level."
The maximum value is 77.4 and it corresponds to "High school level."
The title of series 5 is "Reading."
The minimum value is 42.6 and it corresponds to "University level."
The maximum value is 53.7 and it corresponds to "High school level."
| Organized sports | Non-sport organized activities | Internet | Television | Reading | |
|---|---|---|---|---|---|
| percentage | |||||
| University level | 75.4 | 67.2 | 70.1 | 70.3 | 42.6 |
| Postsecondary level | 68.0 | 67.3 | 72.4 | 75.8 | 48.6 |
| High school level | 67.5 | 66.0 | 72.0 | 77.4 | 53.7 |
| Elementary level | 59.5 | 57.7 | 76.6 | 72.1 | 47.8 |
| Source: Survey on the Vitality of Official-Language Minorities (2006). | |||||
Children’s region of residence
Not surprisingly, and in keeping with the earlier findings reported in the literature,Note 15 those children who lived in New Brunswick showed the highest proportions for the predominant use of French in Canada outside Quebec. New Brunswick is the only region in which these children used more French than English for three of the five personal, extracurricular or recreational activities considered here. For those three activities (reading, organized sports and non-sports-related activities), the proportions relating to the predominant use of French are greater than 60%, as shown in Chart 3.7 A. Browsing the Internet and watching television are nonetheless done more in English than in French across Canada, even in New Brunswick. The proportions for the predominant use of French are nonetheless much higher in New Brunswick than elsewhere in Canada.
The two Ontario regions also present disparities that are worth mentioning. Chart 3.7 B shows that English is in greater use by children who live in the southern part of the province compared with those who live in the eastern and northern parts. As a corollary, children who live in northern and eastern Ontario are more likely to use French and to use both languages equally in their personal, extracurricular and recreational activities than those who live in the southern part of the province (Charts 3.7 A and C). These results thus confirm the findings of Corbeil et al. (2007) and show that the predominant use of French is largely concentrated in certain parts of New Brunswick and Ontario that are close to Quebec.
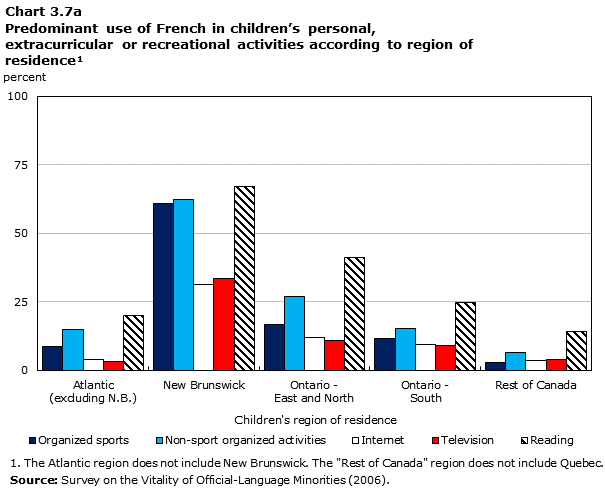
Description of Chart 3.7a
The title of the graph is "Chart 3.7a Predominant use of French in children's personal, extracurricular or recreational activities according to region of residenceChart A - note 1."
This is a column clustered chart.
There are in total 5 categories in the horizontal axis. The vertical axis starts at 0 and ends at 100 with ticks every 25 points.
There are 5 series in this graph.
The vertical axis is "percent."
The horizontal axis is "Children's region of residence."
The title of series 1 is "Organized sports."
The minimum value is 2.9 and it corresponds to "Rest of Canada."
The maximum value is 61.0 and it corresponds to "New Brunswick."
The title of series 2 is "Non-sport organized activities."
The minimum value is 6.5 and it corresponds to "Rest of Canada."
The maximum value is 62.3 and it corresponds to "New Brunswick."
The title of series 3 is "Internet."
The minimum value is 3.8 and it corresponds to "Rest of Canada."
The maximum value is 31.2 and it corresponds to "New Brunswick."
The title of series 4 is "Television."
The minimum value is 3.1 and it corresponds to "Atlantic(excluding N.B.)."
The maximum value is 33.6 and it corresponds to "New Brunswick."
The title of series 5 is "Reading."
The minimum value is 14.0 and it corresponds to "Rest of Canada."
The maximum value is 67.0 and it corresponds to "New Brunswick."
| Organized sports | Non-sport organized activities | Internet | Television | Reading | |
|---|---|---|---|---|---|
| percentage | |||||
| Atlantic(excluding N.B.) | 8.8 | 15.0 | 4.0 | 3.1 | 20.1 |
| New Brunswick | 61.0 | 62.3 | 31.2 | 33.6 | 67.0 |
| Ontario – East and North | 16.9 | 26.9 | 12.1 | 10.8 | 41.1 |
| Ontario – South | 11.7 | 15.4 | 9.3 | 9.1 | 24.6 |
| Rest of Canada | 2.9 | 6.5 | 3.8 | 4.0 | 14.0 |
|
|||||
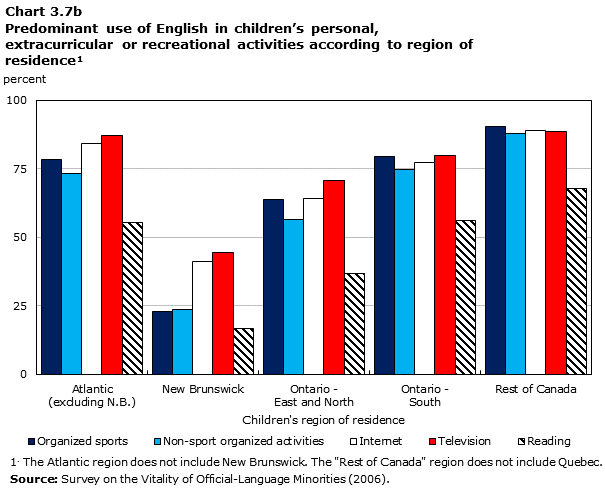
Description of Chart 3.7b
The title of the graph is "Chart 3.7b Predominant use of French in children's personal, extracurricular or recreational activities according to region of residenceChart B - note 1."
This is a column clustered chart.
There are in total 5 categories in the horizontal axis. The vertical axis starts at 0 and ends at 100 with ticks every 25 points.
There are 5 series in this graph.
The vertical axis is "percent."
The horizontal axis is "Children's region of residence."
The title of series 1 is "Organized sports."
The minimum value is 23.0 and it corresponds to "New Brunswick."
The maximum value is 90.6 and it corresponds to "Rest of Canada."
The title of series 2 is "Non-sport organized activities."
The minimum value is 23.8 and it corresponds to "New Brunswick."
The maximum value is 87.8 and it corresponds to "Rest of Canada."
The title of series 3 is "Internet."
The minimum value is 41.1 and it corresponds to "New Brunswick."
The maximum value is 89.1 and it corresponds to "Rest of Canada."
The title of series 4 is "Television."
The minimum value is 44.3 and it corresponds to "New Brunswick."
The maximum value is 88.6 and it corresponds to "Rest of Canada."
The title of series 5 is "Reading."
The minimum value is 16.8 and it corresponds to "New Brunswick."
The maximum value is 68.0 and it corresponds to "Rest of Canada."
| Organized sports | Non-sport organized activities | Internet | Television | Reading | |
|---|---|---|---|---|---|
| percentage | |||||
| Atlantic (excluding N.B.) | 78.3 | 73.2 | 84.2 | 87.2 | 55.5 |
| New Brunswick | 23.0 | 23.8 | 41.1 | 44.3 | 16.8 |
| Ontario – East and North | 63.7 | 56.5 | 64.3 | 70.6 | 36.7 |
| Ontario – South | 79.7 | 74.9 | 77.3 | 79.8 | 56.3 |
| Rest of Canada | 90.6 | 87.8 | 89.1 | 88.6 | 68.0 |
|
|||||
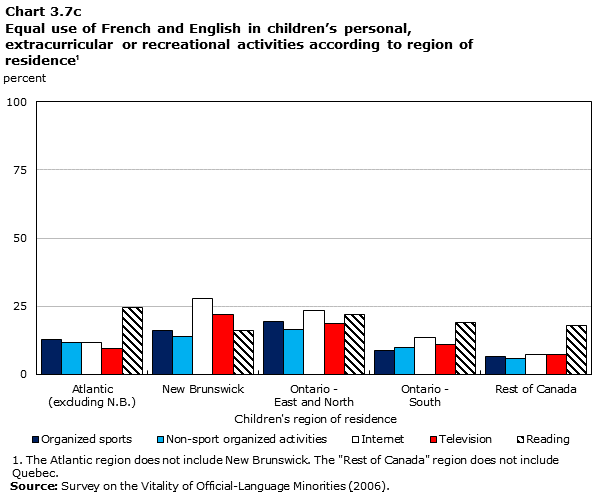
Description of Chart 3.7c
The title of the graph is "Chart 3.7c Equal use of French and English in children's personal, extracurricular or recreational activities according to region of residenceChart C - note 1."
This is a column clustered chart.
There are in total 5 categories in the horizontal axis. The vertical axis starts at 0 and ends at 100 with ticks every 25 points.
There are 5 series in this graph.
The vertical axis is "percent."
The horizontal axis is "Children's region of residence."
The title of series 1 is "Organized sports."
The minimum value is 6.5 and it corresponds to "Rest of Canada."
The maximum value is 19.4 and it corresponds to "Ontario - East and North."
The title of series 2 is "Non-sport organized activities."
The minimum value is 5.7 and it corresponds to "Rest of Canada."
The maximum value is 16.6 and it corresponds to "Ontario - East and North."
The title of series 3 is "Internet."
The minimum value is 7.1 and it corresponds to "Rest of Canada."
The maximum value is 27.7 and it corresponds to "New Brunswick."
The title of series 4 is "Television."
The minimum value is 7.4 and it corresponds to "Rest of Canada."
The maximum value is 22.1 and it corresponds to "New Brunswick."
The title of series 5 is "Reading."
The minimum value is 16.2 and it corresponds to "New Brunswick."
The maximum value is 24.4 and it corresponds to "Atlantic(excluding N.B.)."
| Organized sports | Non-sport organized activities | Internet | Television | Reading | |
|---|---|---|---|---|---|
| percentage | |||||
| Atlantic (excluding N.B.) | 12.9 | 11.9 | 11.8 | 9.6 | 24.4 |
| New Brunswick | 15.9 | 13.9 | 27.7 | 22.1 | 16.2 |
| Ontario – East and North | 19.4 | 16.6 | 23.6 | 18.6 | 22.1 |
| Ontario – South | 8.7 | 9.8 | 13.4 | 11.1 | 19.1 |
| Rest of Canada | 6.5 | 5.7 | 7.1 | 7.4 | 18.0 |
|
|||||
For the other regions of Canada, namely the Atlantic region (excluding New Brunswick), southern Ontario and the rest of Canada, the predominant use of English by these children in their activities is very prevalent. As we indicated earlier, our study nonetheless shows that the predominant use of English is less pronounced for reading, a finding that illustrates the distinct nature of the language practices associated with this activity compared with those used in the children’s other activities.
Linguistic context of community
The following two explanatory factors (i.e., the degree of concentration of the French-language minority within a CSD and the proportion of children whose FOLS is French within the CD) illustrate the strong connections between the linguistic context of the community and the language practices of these children. Overall, the subsequent analyses show that, the higher the concentration index of the francophone minority or the greater the proportion of children in the CD whose FOLS is French, the lower the rates of the predominant use of English and the higher the rates of the use of French.
As illustrated in Charts 3.8 A and B, the concentration index for the francophone minority leads to a grouping of CSDs in Canada in three categories according to their relative weight and the distribution of the francophone minority population within the municipality compared with its total population. Chart 3.8 A shows that, when the concentration of the francophone population is high in the CSD of residence, these children use more French than English in their personal, extracurricular or recreational activities. We note as well that the proportions for the predominant use of French increase and the proportions for the use of English decrease as the francophone minority concentration increases. The charts in Appendix 5 point to a similar trend in which children who lived in a CD in which more than 25% of them had French as an FOLS used much more French in their personal, extracurricular or recreational activities than those who lived in a CD in which fewer than one-quarter of the children had French as their FOLS. Watching television and browsing the Internet are exceptions, however. The proportions relating to their use of FrenchNote 16 increase more slowly than those relating to the other activities as the concentration index for the francophone minority and the proportion of children in the CD whose FOLS is French increase. Therefore, their proportions relating to the predominant use of French remain lower than those relating to the use of English, even when the linguistic minority concentration index is "high" and the proportion of children in the CD whose FOLS was French exceeded 25%.
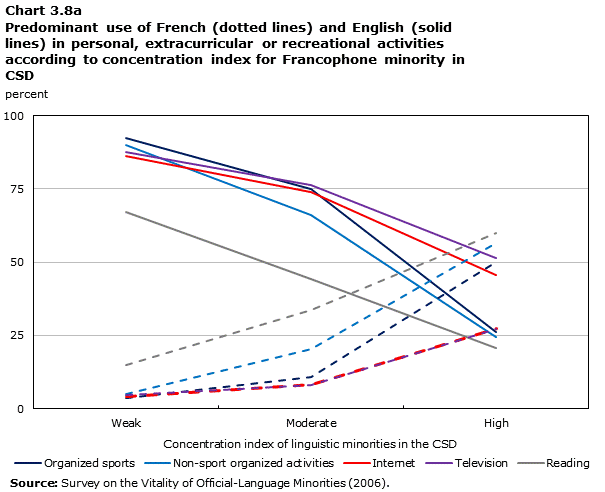
Description of Chart 3.8a
The title of the graph is "Chart 3.8a Predominant use of French (dotted lines) and English (solid lines) in personal, extracurricular or recreational activities according to concentration index for Francophone minority in CSD."
This is a line chart.
There are in total 3 categories in the horizontal axis. The vertical axis starts at 0 and ends at 100 with ticks every 25 points.
There are 10 series in this graph.
The vertical axis is "percent."
The horizontal axis is "Concentration index of linguistic minorities in the CSD."
The title of series 1 is "Organized sports."
The minimum value is 26.1 and it corresponds to "High."
The maximum value is 92.5 and it corresponds to "Weak."
The title of series 2 is "Non-sport organized activities."
The minimum value is 24.4 and it corresponds to "High."
The maximum value is 90.1 and it corresponds to "Weak."
The title of series 3 is "Internet."
The minimum value is 45.7 and it corresponds to "High."
The maximum value is 86.2 and it corresponds to "Weak."
The title of series 4 is "Television."
The minimum value is 51.4 and it corresponds to "High."
The maximum value is 87.6 and it corresponds to "Weak."
The title of series 5 is "Reading."
The minimum value is 20.7 and it corresponds to "High."
The maximum value is 67.2 and it corresponds to "Weak."
The title of series 6 is "Organized sports."
The minimum value is 3.7 and it corresponds to "Weak."
The maximum value is 50.1 and it corresponds to "High."
The title of series 7 is "Non-sport organized activities."
The minimum value is 5.1 and it corresponds to "Weak."
The maximum value is 56.4 and it corresponds to "High."
The title of series 8 is "Internet."
The minimum value is 4.2 and it corresponds to "Weak."
The maximum value is 27.3 and it corresponds to "High."
The title of series 9 is "Television."
The minimum value is 4.7 and it corresponds to "Weak."
The maximum value is 27.2 and it corresponds to "High."
The title of series 10 is "Reading."
The minimum value is 15.0 and it corresponds to "Weak."
The maximum value is 59.8 and it corresponds to "High."
| Organized sports | Non-sport organized activities | Internet | Television | Reading | Organized sports | Non-sport organized activities | Internet | Television | Reading | |
|---|---|---|---|---|---|---|---|---|---|---|
| percentage | ||||||||||
| Weak | 92.5 | 90.1 | 86.2 | 87.6 | 67.2 | 3.7 | 5.1 | 4.2 | 4.7 | 15.0 |
| Moderate | 74.8 | 66.2 | 73.8 | 76.4 | 44.3 | 10.7 | 20.3 | 8.4 | 8.0 | 33.8 |
| High | 26.1 | 24.4 | 45.7 | 51.4 | 20.7 | 50.1 | 56.4 | 27.3 | 27.2 | 59.8 |
| Source: Survey on the Vitality of Official-Language Minorities (2006). | ||||||||||
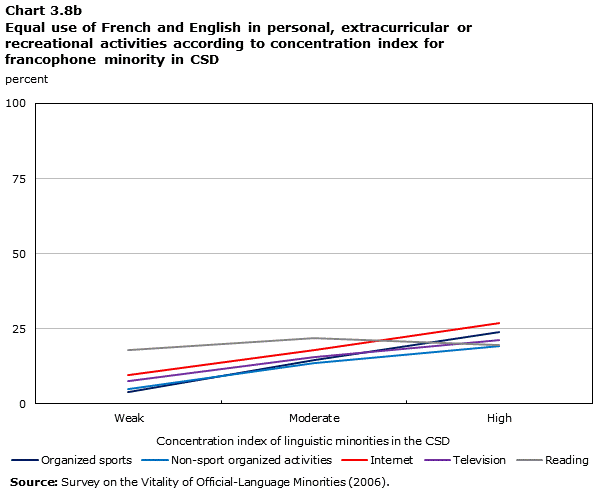
Description of Chart 3.8b
The title of the graph is "Chart 3.8b Equal use of French and English in personal, extracurricular or recreational activities according to concentration index for francophone minority in CSD."
This is a line chart.
There are in total 3 categories in the horizontal axis. The vertical axis starts at 0 and ends at 100 with ticks every 25 points.
There are 5 series in this graph.
The vertical axis is "percent."
The horizontal axis is "Concentration index of linguistic minorities in the CSD."
The title of series 1 is "Organized sports."
The minimum value is 3.8 and it corresponds to "Weak."
The maximum value is 23.8 and it corresponds to "High."
The title of series 2 is "Non-sport organized activities."
The minimum value is 4.8 and it corresponds to "Weak."
The maximum value is 19.2 and it corresponds to "High."
The title of series 3 is "Internet."
The minimum value is 9.6 and it corresponds to "Weak."
The maximum value is 27.0 and it corresponds to "High."
The title of series 4 is "Television."
The minimum value is 7.7 and it corresponds to "Weak."
The maximum value is 21.4 and it corresponds to "High."
The title of series 5 is "Reading."
The minimum value is 17.8 and it corresponds to "Weak."
The maximum value is 21.9 and it corresponds to "Moderate."
| Organized sports | Non-sport organized activities | Internet | Television | Reading | |
|---|---|---|---|---|---|
| percentage | |||||
| Weak | 3.8 | 4.8 | 9.6 | 7.7 | 17.8 |
| Moderate | 14.5 | 13.5 | 17.8 | 15.6 | 21.9 |
| High | 23.8 | 19.2 | 27.0 | 21.4 | 19.5 |
| Source: Survey on the Vitality of Official-Language Minorities (2006). | |||||
Chart 3.8 A and the charts in Appendix 5 also show that most of the increase in the predominant use of French and of the decrease in the use of English in the activities is observed between children who lived in a CSD in which the francophone minority concentration was "moderate" and those who lived in a CSD in which the concentration is "high"; or between children who lived in a CD in which the proportion of these children whose FOLS is French is 25% or less and those who lived in a CD in which this proportion is higher than 25%. These charts also reveal that the equal use of French and English in fact remains low, despite the fact that this practice increases slowly as the indicators of the presence of French in the community increase.
Ultimately, Charts 3.8 A and B as well as the charts in Appendix 5 show that these children’s language practices are strongly tied to indicators of the presence of the French language within the community, as a number of previous studies have previously shown.Note 17
3.2 Factors that help determine language used for reading and watching television
As the descriptive analyses presented thus far have shown, the use of English is often more prevalent than the use of French in the personal, extracurricular or recreational activities of these children. These analyses also revealed that the language behaviours of these children with regard to reading tended to differ from their other language practices in that the predominant use of French was present in higher proportions. The series of charts that follow provide a more detailed look at the language behaviours these children adopt when reading according to a number of key factors that may be associated with them. These six factors are the child’s age, the language spoken most often at home, the linguistic trajectory with friends, the linguistic trajectory in school, the couple’s language composition and the proportion of children under 18 years of age in the CD of residence whose FOLS is French.
With a view to clarifying the specific nature of the use of official languages in reading, the latter is compared against the language used for watching television. Watching television and reading are much more common activities for these children compared with the other activities (using the Internet and participating in sports and non-sports-related activities),Note 18 and are therefore amenable to comparison. One of the characteristics of the variable describing the linguistic behaviour with regard to reading is that another member of the household (one of the two parents in most cases) read to the children when they were young, whereas later on the children read on their own.Note 19 For more than 90% of these children aged four and under, a member of the household read to them, while after age five the children read by themselves in over 90% of cases.
The level of predominant use of either of the two official languages in these children’s personal, extracurricular or recreational activities was looked at in detail in the previous pages. This section focuses more on the use of a single language or the concomitant use of both languages, since many children use both in their different activities to varying degrees. As Table 2.5 shows, 51.1% of these children read or are read to in both languages, while close to 50% watch television in both languages.Note 20 However, this expression of bilingualism does not necessarily mean that English and French are used equally; in many cases one language is favoured over the other. The use of a single language, in the case of watching television in particular, therefore points to a number of situations that are worthy of mention.
Children’s ages
We will begin by considering the effect of the children’s ages on their language behaviours when reading and watching television. As they grew older, the children tended to use more English for watching television but not for reading.Note 21 In fact, the proportions relating to the use of English only for reading are higher for children aged 4 and under than for those aged 5 to 11 (29.7 versus 23.4%). For these older children (12 to 17), the rate of use of English only for reading is 35.1%. When those who used more English than French are added to this percentage, it can be seen that approximately 60% of these children aged 12 to 17 used primarily English for reading. For watching television, English is more prominent. Between the ages of 12 and 17, the majority of these children (55.5%) watched television only in English, and over 80% of all such children watched television primarily in English.
Looking at the situation from the opposite perspective, there is little difference in terms of the predominant use of French for reading between the children aged 4 and under (39.9% in Chart 3.9 A) and those aged 5 to 11 (41.2%). However, it is lower for the older children (20.9% for those aged 12 to 17). A progressive decrease in French-only reading is nonetheless observed between the children aged 4 and under and those aged 5 to 11 (29.6% at age 4 or less, 22.6% for the 5-to-11 age group and 9.4% for those aged 12 to 17). With regard to watching television, Chart 3.9 B reveals that the use of French decreases with age, whether as the only language or as the main language for watching television.
With regard to the equal use of both languages for reading, an increase in the practice of bilingualism is observed as these children grow older, that increase being more pronounced between the 4-and-under and the 5-to-11 age groups. Close to 20% of the children aged 4 and under used English and French equally for reading, while just over 40% of them used both official languages, whether equally or not. Between the ages of 5 and 11, an increase in this type of bilingualism is observed owing to a rise in bilingualism in which French is predominant and in which English is predominant. These ages correspond to the period in which a child attends elementary school, and the increased use of both official languages in such activities therefore seems to be tied to the time when a child must start attending school. It seems that between the ages of 12 and 17 English progressively replaces French as the main language for reading, while the practice of bilingualism remains at around 55%.
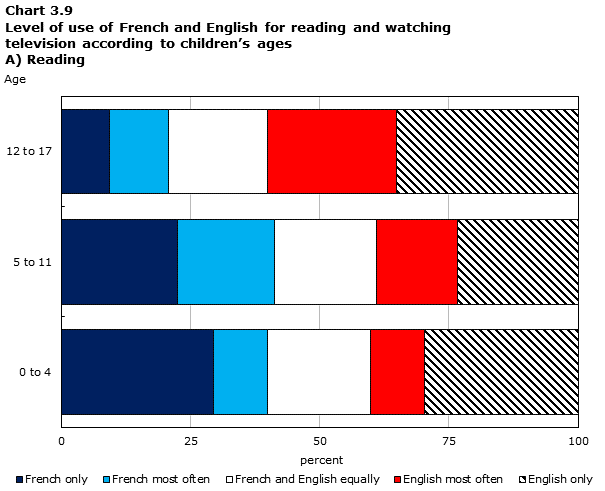
Description of Chart 3.9 A) Reading
The title of the graph is "Chart 3.9 Level of use of French and English for reading and watching television according to children's ages A) Reading."
This is a stacked bar chart.
This is a horizontal bar graph, so categories are on the vertical axis and values on the horizontal axis.
There are in total 3 categories in the vertical axis. The horizontal axis starts at 0 and ends at 100 with ticks every 25 points.
There are 5 series in this graph.
The horizontal axis is "Age."
The vertical axis is "Age."
The title of series 1 is "French only."
The minimum value is 9.4 and it corresponds to "12 to 17."
The maximum value is 29.6 and it corresponds to "0 to 4."
The title of series 2 is "French most often."
The minimum value is 10.3 and it corresponds to "0 to 4."
The maximum value is 18.6 and it corresponds to "5 to 11."
The title of series 3 is "French and English equally."
The minimum value is 19.0 and it corresponds to "12 to 17."
The maximum value is 19.9 and it corresponds to "0 to 4 and 5 to 11."
The title of series 4 is "English most often."
The minimum value is 10.5 and it corresponds to "0 to 4."
The maximum value is 25.0 and it corresponds to "12 to 17."
The title of series 5 is "English only."
The minimum value is 23.4 and it corresponds to "5 to 11."
The maximum value is 35.1 and it corresponds to "12 to 17."
| French only | French most often | French and English equally | English most often | English only | |
|---|---|---|---|---|---|
| percentage | |||||
| 0 to 4 | 29.6 | 10.3 | 19.9 | 10.5 | 29.7 |
| 5 to 11 | 22.6 | 18.6 | 19.9 | 15.5 | 23.4 |
| 12 to 17 | 9.4 | 11.5 | 19.0 | 25.0 | 35.1 |
| Source: Survey on the Vitality of Official-Language Minorities (2006). | |||||
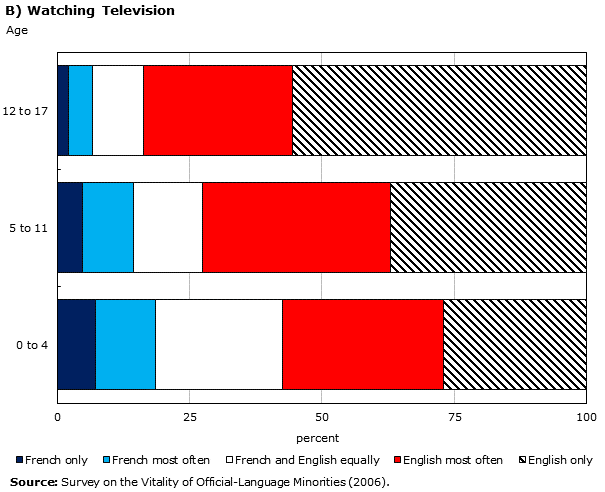
Description of Chart 3.9 B) Watching television
The title of the graph is "Chart 3.9b Watching television."
This is a stacked bar chart.
This is a horizontal bar graph, so categories are on the vertical axis and values on the horizontal axis.
There are in total 3 categories in the vertical axis. The horizontal axis starts at 0 and ends at 100 with ticks every 25 points.
There are 5 series in this graph.
The horizontal axis is "percent."
The vertical axis is "Age."
The title of series 1 is "French only."
The minimum value is 2.1 and it corresponds to "12 to 17."
The maximum value is 7.1 and it corresponds to "0 to 4."
The title of series 2 is "French most often."
The minimum value is 4.5 and it corresponds to "12 to 17."
The maximum value is 11.4 and it corresponds to "0 to 4."
The title of series 3 is "French and English equally."
The minimum value is 9.7 and it corresponds to "12 to 17."
The maximum value is 24.0 and it corresponds to "0 to 4."
The title of series 4 is "English most often."
The minimum value is 28.2 and it corresponds to "12 to 17."
The maximum value is 35.6 and it corresponds to "5 to 11."
The title of series 5 is "English only."
The minimum value is 27.0 and it corresponds to "0 to 4."
The maximum value is 55.5 and it corresponds to "12 to 17."
| French only | French most often | French and English equally | English most often | English only | |
|---|---|---|---|---|---|
| percentage | |||||
| 0 to 4 | 7.1 | 11.4 | 24.0 | 30.5 | 27.0 |
| 5 to 11 | 4.7 | 9.7 | 12.9 | 35.6 | 37.0 |
| 12 to 17 | 2.1 | 4.5 | 9.7 | 28.2 | 55.5 |
| Source: Survey on the Vitality of Official-Language Minorities (2006). | |||||
With regard to watching television, the finding is clear: English was progressively used exclusively or predominantly in combination with French as the children grew older. Between 12 and 17, watching television in French (either as the main language or equally with English) became a minority practice that applied to fewer than 20% of these children. With regard to the concomitant use of both languages for watching television, this is also a practice that decreases with age: before age 5, 66% of these children watched television in both official languages; this proportion drops to 58% for children between the ages of 5 and 11 and to 42% for the 12-to-17 age group. It is clear that the bilingualism that was observed is predominantly English, starting at age 5 in particular. This differs from the bilingualism practiced for reading, which is characterized more by the equal use of both languages.
Linguistic characteristics
The linguistic variables (language spoken most often at home, linguistic trajectory with friends and linguistic trajectory in school) have a significant influence on the language practices of children with at least one francophone parent (Charts 3.10 to 3.12).
Charts 3.10 to 3.12 A indicate that the proportions associated with the use of French only for reading are high for children who spoke French most often at home or whose trajectories with their friends or in school were francophone. The proportions relating to the use of French are in fact between 28% and 45%. If children who used more French than English are added in, more than half of the children primarily used French for reading. The proportions range from 53.2% for children whose school trajectory was francophone to 75.0% for those who followed a francophone trajectory with their friends. Conversely, the use of French tended to be not very prevalent for watching television, even among children who were more exposed to French. For children whose language spoken most often at home was French, more than 70% used primarily French for reading, but a mere 30% for watching television. Watching television in French only was something that was done by less than 15% of the children whose language spoken most often at home was French or whose trajectories at school or with their friends were francophone.
An assessment of the effect of these variables on the language behaviours of these children indicates that the use of English as the only language in which a child reads or watches television is very prevalent for those who spoke English most often at home or whose trajectories with their friends or in school were anglophone. Chart 3.10 A shows that the proportion of children who spoke English most often at home and who used only English for reading was 52%, while for children whose trajectory with their friends was anglophone this proportion was 58% (Chart 3.11 A). Furthermore, among children whose school trajectory was anglophone, this proportion is 71% (Chart 3.12 A). The level of predominant use of English for reading by these childrenNote 22 is 78.1% (Chart 3.10 A) for children who spoke English most often at home and 93.5% (Chart 3.12 A) for those who followed an anglophone trajectory in school.
As for watching television, the majority of these children did so in English only. When all cases in which English predominates are taken into account, the proportions are more than 90% (Charts 3.10 to 3.12 B).
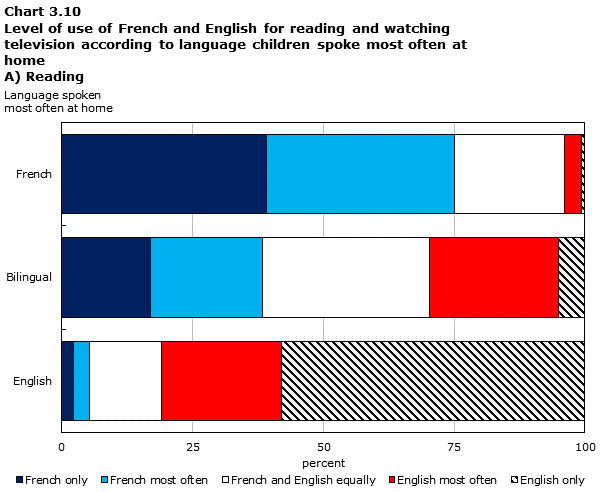
Description of Chart 3.10 A) Reading
The title of the graph is "Chart 3.10 Level of use of French and English for reading and watching television according to language children spoke most often at home A) Reading."
This is a stacked bar chart.
This is a horizontal bar graph, so categories are on the vertical axis and values on the horizontal axis.
There are in total 3 categories in the vertical axis. The horizontal axis starts at 0 and ends at 100 with ticks every 25 points.
There are 5 series in this graph.
The horizontal axis is "Language spoken
most often at home."
The vertical axis is "Language spoken
most often at home."
The title of series 1 is "French only."
The minimum value is 2.3 and it corresponds to "English."
The maximum value is 39.2 and it corresponds to "French."
The title of series 2 is "French most often."
The minimum value is 2.9 and it corresponds to "English."
The maximum value is 35.8 and it corresponds to "French."
The title of series 3 is "French and English equally."
The minimum value is 13.9 and it corresponds to "English."
The maximum value is 31.8 and it corresponds to "Bilingual."
The title of series 4 is "English most often."
The minimum value is 3.3 and it corresponds to "French."
The maximum value is 24.6 and it corresponds to "Bilingual."
The title of series 5 is "English only."
The minimum value is 0.6 and it corresponds to "French."
The maximum value is 58.0 and it corresponds to "English."
| French only | French most often | French and English equally | English most often | English only | |
|---|---|---|---|---|---|
| percentage | |||||
| English | 2.3 | 2.9 | 13.9 | 22.9 | 58.0 |
| Bilingual | 17.0 | 21.5 | 31.8 | 24.6 | 5.1 |
| French | 39.2 | 35.8 | 21.1 | 3.3 | 0.6 |
| Source: Survey on the Vitality of Official-Language Minorities (2006). | |||||
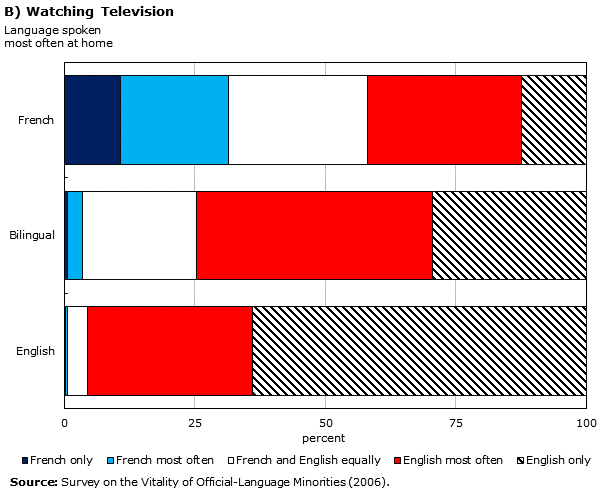
Description of Chart 3.10 B) Watching television
The title of the graph is "Chart 3.10b Watching Television."
This is a stacked bar chart.
This is a horizontal bar graph, so categories are on the vertical axis and values on the horizontal axis.
There are in total 3 categories in the vertical axis. The horizontal axis starts at 0 and ends at 100 with ticks every 25 points.
There are 5 series in this graph.
The horizontal axis is "percent."
The vertical axis is "Language spoken most often at home."
The title of series 1 is "French only."
The minimum value is 0.2 and it corresponds to "English."
The maximum value is 10.7 and it corresponds to "French."
The title of series 2 is "French most often."
The minimum value is 0.3 and it corresponds to "English."
The maximum value is 20.8 and it corresponds to "French."
The title of series 3 is "French and English equally."
The minimum value is 3.9 and it corresponds to "English."
The maximum value is 26.5 and it corresponds to "French."
The title of series 4 is "English most often."
The minimum value is 29.5 and it corresponds to "French."
The maximum value is 45.2 and it corresponds to "Bilingual."
The title of series 5 is "English only."
The minimum value is 12.5 and it corresponds to "French."
The maximum value is 63.9 and it corresponds to "English."
| French only | French most often | French and English equally | English most often | English only | |
|---|---|---|---|---|---|
| percentage | |||||
| English | 0.2 | 0.3 | 3.9 | 31.6 | 63.9 |
| Bilingual | 0.5 | 2.9 | 21.9 | 45.2 | 29.5 |
| French | 10.7 | 20.8 | 26.5 | 29.5 | 12.5 |
| Source: Survey on the Vitality of Official-Language Minorities (2006). | |||||
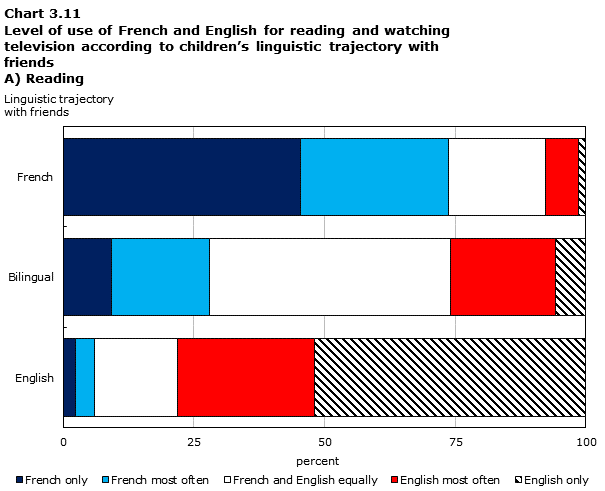
Description of Chart 3.11 A) Reading
The title of the graph is "Chart 3.11 Level of use of French and English for reading and watching television according to children's linguistic trajectory with friends A) Reading."
This is a stacked bar chart.
This is a horizontal bar graph, so categories are on the vertical axis and values on the horizontal axis.
There are in total 3 categories in the vertical axis. The horizontal axis starts at 0 and ends at 100 with ticks every 25 points.
There are 5 series in this graph.
The horizontal axis is "Linguistic trajectory with friends."
The vertical axis is "Linguistic trajectory with friends."
The title of series 1 is "French only."
The minimum value is 2.3 and it corresponds to "English."
The maximum value is 45.4 and it corresponds to "French."
The title of series 2 is "French most often."
The minimum value is 3.7 and it corresponds to "English."
The maximum value is 28.3 and it corresponds to "French."
The title of series 3 is "French and English equally."
The minimum value is 16.0 and it corresponds to "English."
The maximum value is 46.0 and it corresponds to "Bilingual."
The title of series 4 is "English most often."
The minimum value is 6.4 and it corresponds to "French."
The maximum value is 26.2 and it corresponds to "English."
The title of series 5 is "English only."
The minimum value is 1.4 and it corresponds to "French."
The maximum value is 51.9 and it corresponds to "English."
| French only | French most often | French and English equally | English most often | English only | |
|---|---|---|---|---|---|
| percentage | |||||
| English | 2.3 | 3.7 | 16.0 | 26.2 | 51.9 |
| Bilingual | 9.3 | 18.7 | 46.0 | 20.2 | 5.8 |
| French | 45.4 | 28.3 | 18.6 | 6.4 | 1.4 |
| Source: Survey on the Vitality of Official-Language Minorities (2006). | |||||
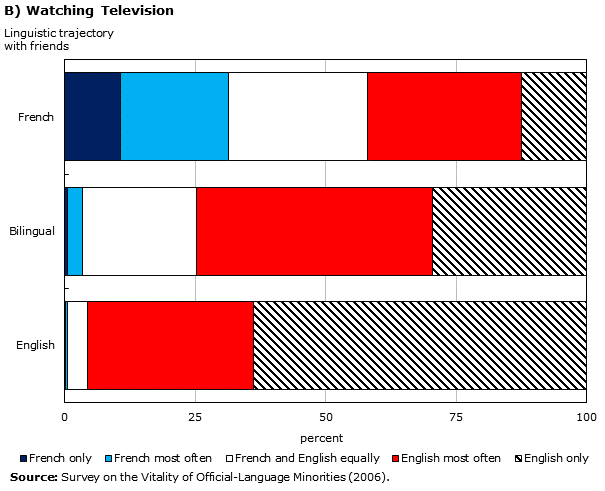
Description of Chart 3.11 B) Watching television
The title of the graph is "Chart 3.11b Watching Television."
This is a stacked bar chart.
This is a horizontal bar graph, so categories are on the vertical axis and values on the horizontal axis.
There are in total 3 categories in the vertical axis. The horizontal axis starts at 0 and ends at 100 with ticks every 25 points.
There are 5 series in this graph.
The horizontal axis is "percent."
The vertical axis is "Linguistic trajectory
with friends."
The title of series 1 is "French only."
The minimum value is 0.2 and it corresponds to "English."
The maximum value is 10.7 and it corresponds to "French."
The title of series 2 is "French most often."
The minimum value is 0.3 and it corresponds to "English."
The maximum value is 20.8 and it corresponds to "French."
The title of series 3 is "French and English equally."
The minimum value is 3.9 and it corresponds to "English."
The maximum value is 26.5 and it corresponds to "French."
The title of series 4 is "English most often."
The minimum value is 29.5 and it corresponds to "French."
The maximum value is 45.2 and it corresponds to "Bilingual."
The title of series 5 is "English only."
The minimum value is 12.5 and it corresponds to "French."
The maximum value is 63.9 and it corresponds to "English."
| French only | French most often | French and English equally | English most often | English only | |
|---|---|---|---|---|---|
| percentage | |||||
| English | 0.2 | 0.3 | 3.9 | 31.6 | 63.9 |
| Bilingual | 0.5 | 2.9 | 21.9 | 45.2 | 29.5 |
| French | 10.7 | 20.8 | 26.5 | 29.5 | 12.5 |
| Source: Survey on the Vitality of Official-Language Minorities (2006). | |||||
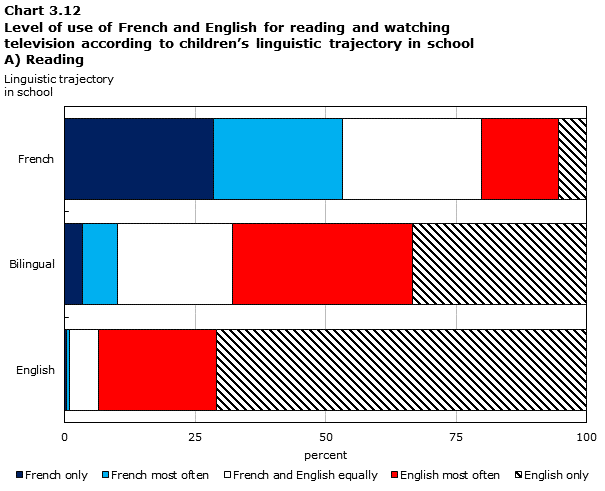
Description of Chart 3.12 A) Reading
The title of the graph is "Chart 3.12 Level of use of French and English for reading and watching television according to children's linguistic trajectory in school A) Reading."
This is a stacked bar chart.
This is a horizontal bar graph, so categories are on the vertical axis and values on the horizontal axis.
There are in total 3 categories in the vertical axis. The horizontal axis starts at 0 and ends at 100 with ticks every 25 points.
There are 5 series in this graph.
The horizontal axis is "Linguistic trajectory in school."
The vertical axis is "Linguistic trajectory in school."
The title of series 1 is "French only."
The minimum value is 0.3 and it corresponds to "English."
The maximum value is 28.5 and it corresponds to "French."
The title of series 2 is "French most often."
The minimum value is 0.7 and it corresponds to "English."
The maximum value is 24.7 and it corresponds to "French."
The title of series 3 is "French and English equally."
The minimum value is 5.6 and it corresponds to "English."
The maximum value is 26.8 and it corresponds to "French."
The title of series 4 is "English most often."
The minimum value is 14.7 and it corresponds to "French."
The maximum value is 34.6 and it corresponds to "Bilingual."
The title of series 5 is "English only."
The minimum value is 5.3 and it corresponds to "French."
The maximum value is 70.9 and it corresponds to "English."
| French only | French most often | French and English equally | English most often | English only | |
|---|---|---|---|---|---|
| percentage | |||||
| English | 0.3 | 0.7 | 5.6 | 22.6 | 70.9 |
| Bilingual | 3.4 | 6.7 | 22.1 | 34.6 | 33.3 |
| French | 28.5 | 24.7 | 26.8 | 14.7 | 5.3 |
| Source: Survey on the Vitality of Official-Language Minorities (2006). | |||||
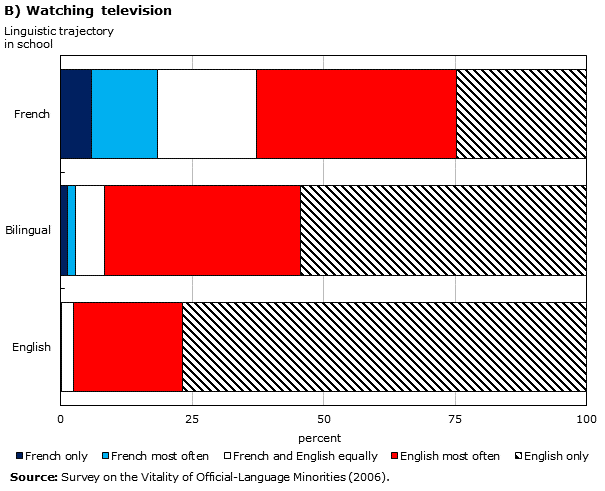
Description of Chart 3.12 B) Watching television
The title of the graph is "Chart 3.12b Watching television."
This is a stacked bar chart.
This is a horizontal bar graph, so categories are on the vertical axis and values on the horizontal axis.
There are in total 3 categories in the vertical axis. The horizontal axis starts at 0 and ends at 100 with ticks every 25 points.
There are 5 series in this graph.
The horizontal axis is "percent."
The vertical axis is "Linguistic trajectory
in school."
The title of series 1 is "French only."
The minimum value is 0.1 and it corresponds to "English."
The maximum value is 5.9 and it corresponds to "French."
The title of series 2 is "French most often."
The minimum value is 0.1 and it corresponds to "English."
The maximum value is 12.5 and it corresponds to "French."
The title of series 3 is "French and English equally."
The minimum value is 2.4 and it corresponds to "English."
The maximum value is 18.9 and it corresponds to "French."
The title of series 4 is "English most often."
The minimum value is 20.6 and it corresponds to "English."
The maximum value is 37.9 and it corresponds to "French."
The title of series 5 is "English only."
The minimum value is 24.8 and it corresponds to "French."
The maximum value is 76.9 and it corresponds to "English."
| French only | French most often | French and English equally | English most often | English only | |
|---|---|---|---|---|---|
| percentage | |||||
| English | 0.1 | 0.1 | 2.4 | 20.6 | 76.9 |
| Bilingual | 1.3 | 1.5 | 5.6 | 37.3 | 54.4 |
| French | 5.9 | 12.5 | 18.9 | 37.9 | 24.8 |
| Source: Survey on the Vitality of Official-Language Minorities (2006). | |||||
Children who were reported as having both French and English as the languages spoken most often at home or whose linguistic trajectory in school or with friends was bilingual tended to use both languages, either equally or not, for reading. For example, of children who spoke French and English equally at home, 84.9% used both languages for reading, 46% of them equally. For watching television, the use of English remains more prevalent than the use of French: between 70% and 90% of children who had both English and French as the languages spoken most often at home or as the languages used with their friends or in school watched television mostly in English. Of the latter, approximately half did so in English only.
A comparison of the three series of charts reveals that having a school trajectory in French has less of an effect on the use of French for reading and for watching television versus having a francophone trajectory with friends or speaking French most often at home. There are a number of underlying factors (parents’ choices, number of schools attended, programs available in schools attended) that no doubt account for this situation.
Table 3.1 presents the proportions relating to the use of English and French for reading according to the language spoken most often at home and the age group of these children. This table highlights the probable effect of the children’s ages on the language used for reading, according to the linguistic context within the family.
An increase in the use of both languages for reading is observed between the children aged 4 and under and those aged 5 to 11 who spoke French or English at home. These two groups in fact represent more than 90% of the children in our study. The proportion relating to the use of both languages for reading rises from 30% to 49% for children who spoke mostly French at home, and from 37% to 53% for those who spoke mostly English at home. The use of both languages for reading continues to increase until age 12 to 17 for children who used mostly French at home, to a level of 72%. However, the opposite trend is observed for children who spoke mostly English at home: a 10% decrease in the use of both languages for reading is observed between the children aged 5 to 11 and those aged 12 to 17 (53% to 43%).
The fact that those children who spoke French most often at home increasingly used both official languages for reading as they grew older is the result of two separate trends. First, the increase in the use of both languages between the children aged 4 and under and those aged 5 to 11 is largely tied to a rise in the level of French-predominant bilingualism. Second, the increase in the use of both languages between the children aged 5 to 11 and those aged 12 to 17 is the combined result of greater use of both languages equally or of both languages with a predominance of English. For those two categories combined, the proportion rises from 13.5% for children aged 5 to 11 to 44% for those aged 12 to 17, while predominantly-French bilingualism decreases, from 35% to 28%.
Another consequence of the increase in the use of both languages for reading among children who spoke French at home is the progressive reduction in the exclusive use of French as they grew older, from 70% before age 5 to 25% for those aged 12 to 17.
For children who spoke English at home, the situation with regard to bilingualism appears to be less complex where reading is concerned. Bilingualism in reading involves either the equal use of English and French or a predominance of English among the three age groups. For the 12-to-17 age group, there is a strong tendency for English to predominate where there is bilingualism in reading (30.7%).
For children for whom the language spoken most often at home is English and French equally, bilingualism in reading is prevalent among all three age groups, with proportions in the order of 85%. Furthermore, between 40% and 50% of these children, regardless of age, use English and French equally for reading.
| Age group | |||
|---|---|---|---|
| 0 to 4 years | 5 to 11 years | 12 to 17 years | |
| percentage | |||
| French spoken most often at home | |||
| Language used for reading | |||
| French only | 69.5 | 50.6 | 24.8 |
| French most often | 16.3 | 35.4 | 28.1 |
| French and English equally | 12.8 | 11.3 | 29.8 |
| English most often | 1.1 | 2.2 | 14.1 |
| English only | 0.3 | 0.4 | 3.2 |
| Total | 100.0 | 100.0 | 100.0 |
| Both languagesTable 3.1 - Note 1 | 30.2 | 48.9 | 72.0 |
| English spoken most often at home | |||
| Language used for reading | |||
| French only | 3.5 | 5.5 | 2.1 |
| French most often | 1.9 | 4.0 | 0.9 |
| French and English equally | 16.8 | 22.1 | 10.1 |
| English most often | 17.2 | 25.3 | 30.7 |
| English only | 60.7 | 43.1 | 56.2 |
| Total | 100.0 | 100.0 | 100.0 |
| Both languagesTable 3.1 - Note 1 | 37.5 | 52.9 | 42.9 |
| French and English spoken equally at home | |||
| Language used for reading | |||
| French only | 18.2 | 28.4 | 8.9 |
| French most often | 8.0 | 16.7 | 2.5 |
| French and English equally | 51.6 | 43.4 | 43.8 |
| English most often | 17.7 | 11.4 | 31.7 |
| English only | 4.4 | 0.1 | 13.1 |
| Total | 100.0 | 100.0 | 100.0 |
| Both languagesTable 3.1 - Note 1 | 87.5 | 83.2 | 84.4 |
|
|||
Couple’s language composition
Charts 3.13 A and B present these children’s language practices in terms of reading and watching television according to the language composition of the couple composed of their biological parents. For children born to exogamous couples (in which one parent has French as the mother tongue and the other does not), the predominant use of English for reading and for watching television surpasses the use of French. In these exogamous situations, the fact of having a francophone mother exerts a small amount of upward pressure on the presence of French in the children’s language practices compared with exogamous couples in which the father is francophone. However, even in the case of couples in which the mother is francophone and the father non-francophone, the predominant use of English characterizes the majority of children: 56.9% for reading and over 85% for watching television.
The language behaviours of children born to non-francophone couplesNote 23 according to the criterion of mother tongue are similar to those of children from exogamous couples. The predominant use of English pertains to the majority of such children: 69.8% for reading and 88.0% for watching television. Close to half of these children from non-francophone couples (43.8%) use only English for reading.
For children living with endogamous francophone couples, the predominant use of French is more prevalent than the predominant use of English for reading, but French is less prevalent than English for watching television. A strong variation in language use among children from endogamous francophone couples is in fact observed when they practice these two activities, and thus the exclusive use of French never characterizes the majority.
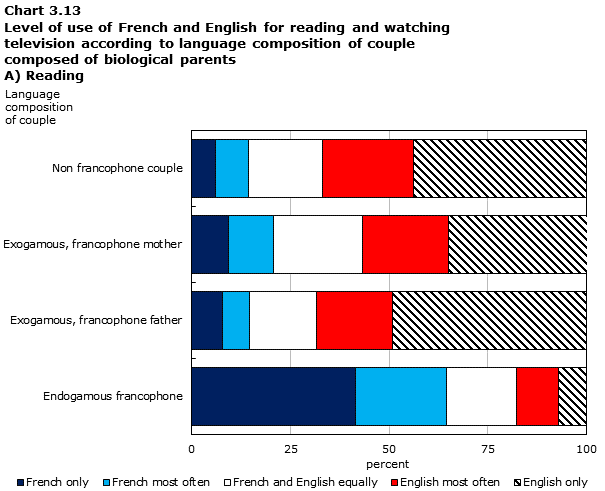
Description of Chart 3.13 A) Reading
The title of the graph is "Chart 3.13 Level of use of French and English for reading and watching television according to language composition of couple composed of biological parents A) Reading."
This is a stacked bar chart.
This is a horizontal bar graph, so categories are on the vertical axis and values on the horizontal axis.
There are in total 4 categories in the vertical axis. The horizontal axis starts at 0 and ends at 100 with ticks every 25 points.
There are 5 series in this graph.
The horizontal axis is "Language composition of couple."
The vertical axis is "Language composition of couple."
The title of series 1 is "French only."
The minimum value is 6.0 and it corresponds to "Non francophone couple."
The maximum value is 41.4 and it corresponds to "Endogamous francophone."
The title of series 2 is "French most often."
The minimum value is 6.9 and it corresponds to "Exogamous, francophone father."
The maximum value is 23.1 and it corresponds to "Endogamous francophone."
The title of series 3 is "French and English equally."
The minimum value is 16.9 and it corresponds to "Exogamous, francophone father."
The maximum value is 22.5 and it corresponds to "Exogamous, francophone mother."
The title of series 4 is "English most often."
The minimum value is 10.7 and it corresponds to "Endogamous francophone."
The maximum value is 23.0 and it corresponds to "Non francophone couple."
The title of series 5 is "English only."
The minimum value is 7.0 and it corresponds to "Endogamous francophone."
The maximum value is 49.2 and it corresponds to "Exogamous, francophone father."
| French only | French most often | French and English equally | English most often | English only | |
|---|---|---|---|---|---|
| percentage | |||||
| Endogamous francophone | 41.4 | 23.1 | 17.7 | 10.7 | 7.0 |
| Exogamous, francophone father | 7.8 | 6.9 | 16.9 | 19.2 | 49.2 |
| Exogamous, francophone mother | 9.3 | 11.4 | 22.5 | 21.7 | 35.2 |
| Non francophone couple | 6.0 | 8.3 | 18.9 | 23.0 | 43.8 |
| Source: Survey on the Vitality of Official-Language Minorities (2006). | |||||
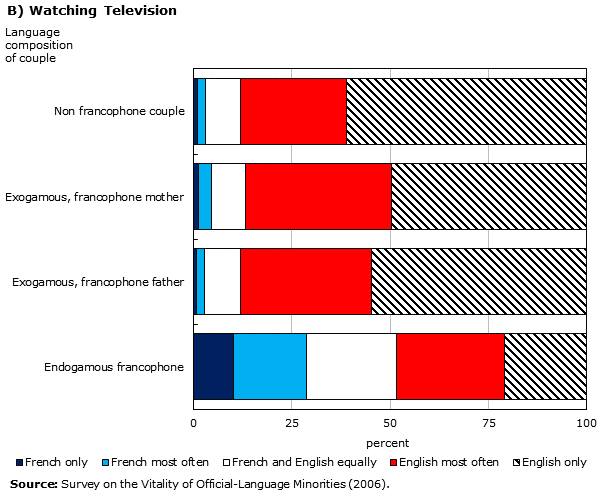
Description of Chart 3.13 B) Watching television
The title of the graph is "Chart 3.13b Watching Television."
This is a stacked bar chart.
This is a horizontal bar graph, so categories are on the vertical axis and values on the horizontal axis.
There are in total 4 categories in the vertical axis. The horizontal axis starts at 0 and ends at 100 with ticks every 25 points.
There are 5 series in this graph.
The horizontal axis is "percent."
The vertical axis is "Language composition of couple."
The title of series 1 is "French only."
The minimum value is 0.9 and it corresponds to "Exogamous, francophone father."
The maximum value is 10.1 and it corresponds to "Endogamous francophone."
The title of series 2 is "French most often."
The minimum value is 1.8 and it corresponds to "Exogamous, francophone father."
The maximum value is 18.5 and it corresponds to "Endogamous francophone."
The title of series 3 is "French and English equally."
The minimum value is 8.6 and it corresponds to "Exogamous, francophone mother."
The maximum value is 22.9 and it corresponds to "Endogamous francophone."
The title of series 4 is "English most often."
The minimum value is 26.9 and it corresponds to "Non francophone couple."
The maximum value is 37.2 and it corresponds to "Exogamous, francophone mother."
The title of series 5 is "English only."
The minimum value is 20.8 and it corresponds to "Endogamous francophone."
The maximum value is 61.1 and it corresponds to "Non francophone couple."
| French only | French most often | French and English equally | English most often | English only | |
|---|---|---|---|---|---|
| percentage | |||||
| Endogamous francophone | 10.1 | 18.5 | 22.9 | 27.6 | 20.8 |
| Exogamous, francophone father | 0.9 | 1.8 | 9.3 | 33.2 | 54.8 |
| Exogamous, francophone mother | 1.3 | 3.2 | 8.6 | 37.2 | 49.7 |
| Non francophone couple | 1.0 | 2.0 | 9.0 | 26.9 | 61.1 |
| Source: Survey on the Vitality of Official-Language Minorities (2006). | |||||
As shown in the previous charts, the equal use of French and English remains a common practice for reading and for watching television, both for children living with exogamous couples and those living with endogamous francophone couples. Such bilingualism, which characterizes between 44% and 70% of children, is predominantly English for children from exogamous couples. It is predominantly English as well for children of endogamous francophone couples with regard to watching television. Among the latter, it is nonetheless predominantly French in the case of reading.
Linguistic context
Charts 3.14 A and B illustrate the connection between the language used for reading and for watching television and the contextual variables, specifically with the proportion of children under 18 whose FOLS is French in the CD. The use of English for these two activities decreases as the value of this indicator increases. The exclusive use of English for reading drops from 49.8% when fewer than 2% of children in the CD had French as an FOLS to 7.5% when that indicator is 25% or more. As a corollary, the use of French in these two activities increases. For example, the exclusive use of French for reading rises from 7.1% to 42.9% between those two categories of the indicator.
Chart 3.14 B reveals that just under 90% of children living in a CD in which fewer than 2% of children had French as an FOLS watched television primarily in English, with 58.4% watching exclusively in English. For children living in a CD in which more than 25% of children had French as their FOLS, language practices associated with watching television are more varied. Watching television only in French nonetheless remains the less prevalent practice, accounting for only 12% of children compared with 18.6% who watch exclusively in English.
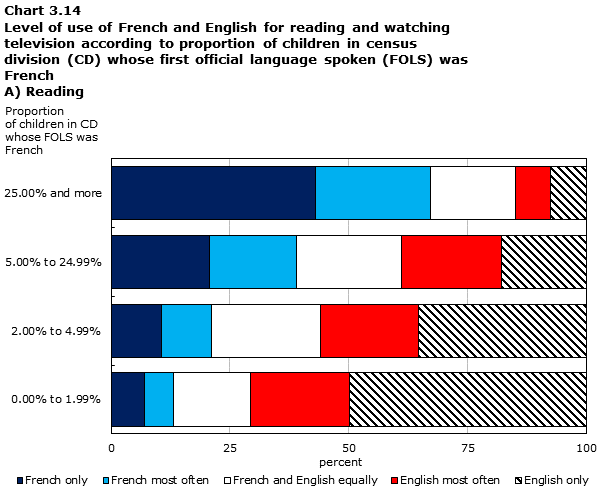
Description of Chart 3.14 A) Reading
The title of the graph is "Chart 3.14 Level of use of French and English for reading and watching television according to proportion of children in census division (CD) whose first official language spoken (FOLS) was French A) Reading."
This is a stacked bar chart.
This is a horizontal bar graph, so categories are on the vertical axis and values on the horizontal axis.
There are in total 4 categories in the vertical axis. The horizontal axis starts at 0 and ends at 100 with ticks every 25 points.
There are 5 series in this graph.
The horizontal axis is "percentage"
The vertical axis is "Proportion of children in CD whose FOLS was French."
The title of series 1 is "French only."
The minimum value is 7.1 and it corresponds to "0.00% to 1.99%."
The maximum value is 42.9 and it corresponds to "25.00% and more."
The title of series 2 is "French most often."
The minimum value is 6.1 and it corresponds to "0.00% to 1.99%."
The maximum value is 24.2 and it corresponds to "25.00% and more."
The title of series 3 is "French and English equally."
The minimum value is 16.2 and it corresponds to "0.00% to 1.99%."
The maximum value is 22.8 and it corresponds to "2.00% to 4.99%."
The title of series 4 is "English most often."
The minimum value is 7.4 and it corresponds to "25.00% and more."
The maximum value is 21.0 and it corresponds to "5.00% to 24.99%."
The title of series 5 is "English only."
The minimum value is 7.5 and it corresponds to "25.00% and more."
The maximum value is 49.8 and it corresponds to "0.00% to 1.99%."
| French only | French most often | French and English equally | English most often | English only | |
|---|---|---|---|---|---|
| percentage | |||||
| 0.00% to 1.99% | 7.1 | 6.1 | 16.2 | 20.8 | 49.8 |
| 2.00% to 4.99% | 10.6 | 10.5 | 22.8 | 20.7 | 35.3 |
| 5.00% to 24.99% | 20.8 | 18.2 | 22.1 | 21.0 | 17.9 |
| 25.00% and more | 42.9 | 24.2 | 18.0 | 7.4 | 7.5 |
| Source: Survey on the Vitality of Official-Language Minorities (2006). | |||||
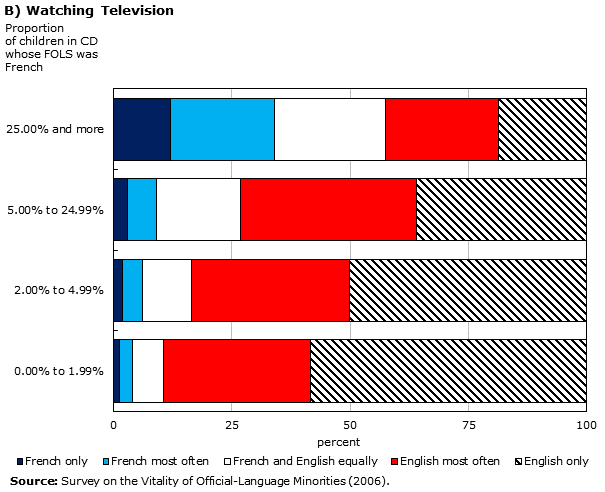
Description of Chart 3.14 B) Watching television
The title of the graph is "Chart 3.14b Watching Television."
This is a stacked bar chart.
This is a horizontal bar graph, so categories are on the vertical axis and values on the horizontal axis.
There are in total 4 categories in the vertical axis. The horizontal axis starts at 0 and ends at 100 with ticks every 25 points.
There are 5 series in this graph.
The horizontal axis is "percent."
The vertical axis is "Proportion of children in CD whose FOLS was French."
The title of series 1 is "French only."
The minimum value is 1.3 and it corresponds to "0.00% to 1.99%."
The maximum value is 12.0 and it corresponds to "25.00% and more."
The title of series 2 is "French most often."
The minimum value is 2.6 and it corresponds to "0.00% to 1.99%."
The maximum value is 21.9 and it corresponds to "25.00% and more."
The title of series 3 is "French and English equally."
The minimum value is 6.7 and it corresponds to "0.00% to 1.99%."
The maximum value is 23.4 and it corresponds to "25.00% and more."
The title of series 4 is "English most often."
The minimum value is 24.1 and it corresponds to "25.00% and more."
The maximum value is 37.3 and it corresponds to "5.00% to 24.99%."
The title of series 5 is "English only."
The minimum value is 18.6 and it corresponds to "25.00% and more."
The maximum value is 58.4 and it corresponds to "0.00% to 1.99%."
| French only | French most often | French and English equally | English most often | English only | |
|---|---|---|---|---|---|
| percentage | |||||
| 0.00% to 1.99% | 1.3 | 2.6 | 6.7 | 31.0 | 58.4 |
| 2.00% to 4.99% | 2.0 | 4.1 | 10.3 | 33.4 | 50.2 |
| 5.00% to 24.99% | 2.9 | 6.2 | 17.6 | 37.3 | 36.0 |
| 25.00% and more | 12.0 | 21.9 | 23.4 | 24.1 | 18.6 |
| Source: Survey on the Vitality of Official-Language Minorities (2006). | |||||
Charts 3.14 A and B also indicate that the weight of the francophone children in a CD has little effect on the practice of bilingualism, for both reading and watching television, except when that weight is lower than 2%. In reading, for example, 43.1% of children living in this type of CD used both languages. However, in CDs in which the weight of francophone children was higher than 2%, more than half of them used both languages for reading. It is nonetheless necessary to make a distinction between the types of bilingualism practiced for reading: only children who lived in a CD in which the weight of francophone children was higher than 25% practiced a form of bilingualism in which French surpassed English (24.2% for bilingualism in which French was the predominant language compared with 6.1% for bilingualism in which English was the predominant language).
English remains dominant for watching television, although the use of both languages characterized a significant proportion – between 40% and 70% – of these children.
The children’s language practices with regard to reading differ from those related to the other activities in that they entailed a greater use of French. However, in most of the situations that were looked at, this does not translate into greater use of French for reading compared with English. This is true of children whose day-to-day lives did not take place mostly in French, such as children whose language spoken most often at home was English or English and French, or whose school trajectory was anglophone or bilingual.
The children from more francophone settings (as defined, for example, by the language spoken most often at home, the couple’s linguistic situation or the language composition of the local population) are characterized by a wide diversity of language practices, whether for reading, watching television or one of the other three personal, extracurricular or recreational activities referred to earlier. The contrast is especially striking between the children from endogamous francophone couples and those from other types of couples. The use of French only for reading and in organized sports and non-sports-related activities is a practice that characterizes up to 40% of these children. For watching television and browsing the Internet, the use of French only is associated with only about 10% of the children from more francophone settings.
The use of both languages by these children in their activities is prevalent. The bilingualism of children whose linguistic orientation is English (for example, when English is the language spoken most often at home), the predominant language was English. It is more strongly characterized by the equal use of both languages or a predominance of French for children whose linguistic orientation is French. For watching television, more than for the other personal, extracurricular or recreational activities in which these children participate, the use of both languages is heavily inclined towards English.
- Date modified:
