
Perceptions of gender-based violence and gender equality, identity and expression in Canada, 2025
by Marta Burczycka and Adam Cotter
Highlights
- According to the 2025 Survey of Safety in Public and Private Spaces, most people felt that violence between intimate partners was unacceptable, that women face obstacles that make it harder for them to get ahead, that same-sex partners should have the same rights to adopt children as opposite-sex partners, and that everyone should be free to express their gender however they choose. Women were generally more likely to hold these opinions than men.
- Attitudes shifted slightly from 2018 to 2025, toward less agreement with statements that excuse or legitimize gender-based violence. For example, in 2025 smaller proportions of women (13%) and men (18%) agreed that it is understandable that someone would react violently if they suspected their partner of having an affair, compared to 2018 (16% and 20%).
- Fewer people agreed that individuals should be free to express their gender however they choose in 2025 compared with 2018. Among women, the proportion who agreed decreased from 85% in 2018 to 77% in 2025. Among men, the decrease was from 78% to 70%.
- Agreement that people should be able to express their gender was higher among First Nations women (82%) than non-Indigenous women (77%). Among racialized women, proportions who supported gender expression among Filipina women (82%) and Southeast Asian women (79%) were similar to non-racialized, non-Indigenous women (80%).
- LGB+ people (i.e. persons whose reported sexual orientation is lesbian, gay, bisexual, or another sexual orientation that is not heterosexual) were more likely to agree that women face more obstacles to getting ahead than men, among both women (89%, versus 74% of heterosexual women) and men (76% versus 51%).
- The proportion of gender-diverse individuals who agreed with statements supporting gender expression or gender equality was larger than it was among cisgender women and cisgender men. For example, the vast majority (97%) of gender-diverse people felt that people should be able to express their gender however they choose, compared with 77% of cisgender women and 69% of cisgender men.
- When asked if they thought women face significant obstacles to getting ahead, agreement was highest among younger women aged 15 to 24 (78%) and 25 to 34 (78%). This was a departure from what was noted in 2018, when the highest levels of agreement were among women aged 55 and older (77%).
- In 2025, women and men who had experienced intimate partner violence, sexual assault or unwanted sexualized behaviours were generally the most likely to disagree with statements that legitimize or excuse gender-based violence.
People’s perceptions of gender, gender expression and gender equality can reflect broader social structures and norms, which may legitimize gender-based violence and inequality and make them seem acceptable, inevitable or normal (Jewkes et al. 2014; Fleming et al. 2015). In 2025, Statistics Canada conducted the Survey of Safety in Public and Private Spaces (SSPPS) for the second time. In addition to providing a measure of people’s experiences of gender-based violence, the survey included questions aimed at measuring people’s attitudes toward gender-based and intimate partner violence, gender equality, and gender expression in Canada.
Using data from both the 2025 SSPPS and the survey’s first iteration in 2018, this Juristat article examines perceptions of gender equality, gender identity, gender expression, and gender-based violence. This article examines these perceptions with a particular focus on shifts in attitudes since 2018. Characteristics associated with perceptions are also explored, including gender, age, sexual orientation, geographic location, Indigenous identity, racialized group, and experiences of gender-based violence.
Start of text box 1
Text box 1
Measuring perceptions of gender-based violence, gender expression and gender
equality with the Survey of Safety in Public and Private Spaces
In both its 2018 and 2025 cycles, the Survey of Safety in Public and Private Spaces (SSPPS) used a series of eight statements to measure people’s perceptions (i.e., attitudes) of gender-based violence, gender expression and gender equality. Respondents were asked whether they strongly agreed, agreed, neither agreed nor disagreed, disagreed or strongly disagreed with each statement.
Of the eight statements, four aimed to measure people’s attitudes toward the perceived acceptability of intimate partner violence in certain contexts, acceptance of controlling behaviour in intimate relationships, and the credibility of allegations of sexual assault:
- Violence between partners can be excused if people get so angry they lose control
- It is understandable that someone would react violently if they suspect their partner of having an affair
- People have the right to check who their partner has been calling or texting at all times
- People who report sexual assault are almost always telling the truth
The remaining four statements touched on gender equality, gender identity and expression, and the rights of LGB+ people (i.e. persons whose reported sexual orientation is lesbian, gay, bisexual, or another sexual orientation that is not heterosexual):
- There are significant obstacles that make it harder for women to get ahead than men
- Same-sex and opposite-sex couples should have the same rights to adopt children
- People should be able to express their gender however they choose
- I would support a family member if they came out as transgender
All but one of these statements were the same in both the 2018 and 2025 versions of the survey, enabling direct comparisons and analysis of change over time. In 2025, the statement “I would support a family member if they came out as transgender” was reworded from its 2018 version, “If a family member of mine came out as transgender, I would not be able to support them.” Because of this change, analysis of change over time for this statement specifically should be done with caution.
End of text box 1
Section 1: Trends in perceptions of gender-based violence and gender equality, identity and expression
In 2025, as in 2018, most women and menNote in Canada felt that violence between intimate partners was unacceptable, that women face ongoing inequality, that same-sexNote partners should have the same rights as opposite-sex partners to adopt children, and that all people have the right to gender expression (Table 1). Additionally, the proportions of women who held these opinions continued to be larger than the proportions of men. Between 2018 and 2025, these attitudes showed little change—though some subtle differences were noted.
Slight shifts in attitudes about gender-based violence among women and men
The SSPPS measures people’s attitudes toward gender-based violence through four questions specific to intimate partner violence and sexual assault (see Text box 1). In 2025, as in 2018, the majority of people 15 years of age and older in Canada disagreed with statements that accept, excuse or legitimize behaviours related to these types of violence. Additionally, compared to 2018, a slightly larger proportion of people disagreed with most of these statements in 2025. In both 2018 and 2025, women were generally more likely than men to hold opinions that reject the legitimacy of gender-based violence.
In 2025, almost nine in ten people disagreedNote with the idea that violence between partners can be excused if people get so angry they lose control, with marginally higher disagreement among women (88%) than men (85%) (Table 1).Note Among women, this proportion was unchanged from 2018. Among men, a slightly larger proportion disagreed with the statement in 2025, compared with 2018 (83%). In addition, slightly fewer men agreed or strongly agreed with this statement in 2025 (7%) compared to 2018 (9%).
Women and men were also asked if they felt that it is understandable that someone would react violently if they suspected their partner of having an affair. In 2025, as in 2018, women were less likely than men to agree with this statement. Among both women and men, the proportions who agreed with this statement decreased slightly from 2018 to 2025. Among women, the proportion declined from 16% in 2018 to 13% in 2025, while among men, it decreased from 20% to 18%.
In addition to questions on losing control and reactions to infidelity, the SSPPS also asked respondents if they thought partners have the right to check who their partner has been calling or texting at all times—a scenario potentially illustrative of coercive control in relationships (Mayhill & Hohl, 2019). Here, patterns differed somewhat from other statements on intimate partner violence. Unlike other statements, a slightly larger proportion of women (18%) than men (17%) agreed with this statement. Additionally, the proportions who disagreed with the statement decreased slightly from 2018 to 2025, among both women (from 58% to 56%) and men (from 60% to 57%).
Sexual assault is an especially gendered form of violence, with women making up the vast majority of victims according to both self-reported and police-reported data (Cotter, 2024; Cotter & Burczycka, 2026). Victims often choose not to seek help or report their experiences to police for fear of not being believed, especially in the face of prevailing myths and stereotypes surrounding sexual assault (Office of the Federal Ombudsperson for Victims of Crime, 2025). When asked whether they thought people who report sexual assault are almost always telling the truth, considerably more women (67%) than men (50%) agreed, the largest gap noted among all statements related to gender-based violence in 2025. Among both women and men, the proportion who agreed with the statement increased from 2018 (from 62% of women and 47% of men in 2018). Relatively large proportions of both women and men stated that they neither agreed nor disagreed with this statement, in both 2018 and 2025 (Chart 1).
Chart 1 start
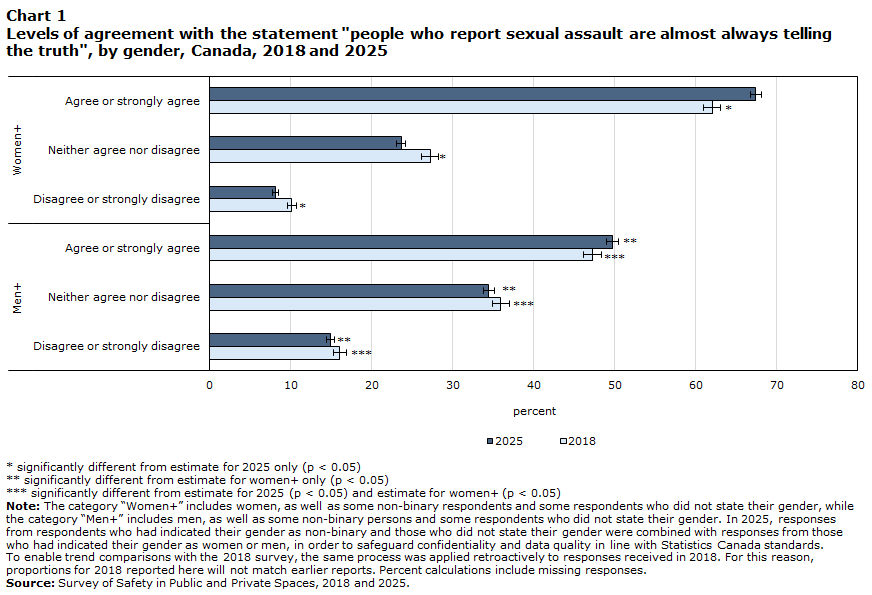
Data table for Chart 1
| 2018 | 2025 | |||||
|---|---|---|---|---|---|---|
| percent | 95% confidence interval | percent | 95% confidence interval | |||
| from | to | from | to | |||
Source: Survey of Safety in Public and Private Spaces, 2018 and 2025. |
||||||
| Women+ | ||||||
| Agree or strongly agree | 62.1 Data table for chart 1 Note * | 61.0 | 63.1 | 67.5 | 66.8 | 68.1 |
| Neither agree nor disagree | 27.2 Data table for chart 1 Note * | 26.2 | 28.3 | 23.6 | 23.1 | 24.2 |
| Disagree or strongly disagree | 10.1 Data table for chart 1 Note * | 9.6 | 10.8 | 8.2 | 7.8 | 8.5 |
| Men+ | ||||||
| Agree or strongly agree | 47.3 Data table for chart 1 Note *** | 46.2 | 48.4 | 49.8 Data table for chart 1 Note ** | 49.0 | 50.5 |
| Neither agree nor disagree | 36.0 Data table for chart 1 Note *** | 34.9 | 37.0 | 34.5 Data table for chart 1 Note ** | 33.8 | 35.1 |
| Disagree or strongly disagree | 16.1 Data table for chart 1 Note *** | 15.3 | 16.9 | 14.9 Data table for chart 1 Note ** | 14.4 | 15.5 |
Chart 1 end
Attitudes about gender expression show move toward less acceptance
As was the case in 2018, a considerably larger proportion of women than men held opinions supportive of transgender people and gender expression. Among both women and men, however, perceptions moved toward less acceptance between 2018 and 2025.
In both 2018 and 2025, people were asked whether they thought that everyone should be able to express their gender however they choose. While the majority of both women and men agreed with this statement, the proportions who did so were notably smaller in 2025 than in 2018 (Table 1, Chart 2). Among women, the proportion who agreed decreased from 85% in 2018 to 77% in 2025. Among men, the decrease was from 78% to 70%. For both women and men, these changes were the most substantial among all eight gender-based violence, gender expression and gender equality statements included in the survey.
Chart 2 start

Data table for Chart 2
| 2018 | 2025 | |||||
|---|---|---|---|---|---|---|
| percent | 95% confidence interval | percent | 95% confidence interval | |||
| from | to | from | to | |||
Source: Survey of Safety in Public and Private Spaces, 2018 and 2025. |
||||||
| Women+ | ||||||
| Agree or strongly agree | 84.8 Data table for chart 2 Note * | 84.0 | 85.5 | 77.4 | 76.9 | 78.0 |
| Neither agree nor disagree | 10.2 Data table for chart 2 Note * | 9.6 | 10.8 | 14.2 | 13.7 | 14.6 |
| Disagree or strongly disagree | 4.8 Data table for chart 2 Note * | 4.3 | 5.2 | 7.9 | 7.6 | 8.3 |
| Men+ | ||||||
| Agree or strongly agree | 78.4 Data table for chart 2 Note *** | 77.5 | 79.3 | 69.6 Data table for chart 2 Note ** | 68.9 | 70.3 |
| Neither agree nor disagree | 13.6 Data table for chart 2 Note *** | 12.9 | 14.4 | 17.1 Data table for chart 2 Note ** | 16.6 | 17.7 |
| Disagree or strongly disagree | 7.7 Data table for chart 2 Note *** | 7.2 | 8.3 | 12.8 Data table for chart 2 Note ** | 12.3 | 13.2 |
Chart 2 end
Similarly, changes were noted among both women and men when it came to whether they would support a family member if they came out as transgender. Notably, the wording of this statement changed from 2018 to 2025 and so comparisons must be made with caution (see Text box 1). However, results appear to align with those from the other statement about gender expression discussed above: while 80% of women agreed with this position in 2018, the proportion declined to 77% in 2025. Among men, 72% were in agreement in 2018, while in 2025, the proportion who agreed decreased to 65%.
Notably, these shifts in attitudes in Canada have coincided with a period of animated public discourse on the rights of gender diverse (i.e. transgender and non-binary) people. At the same time that these rights are being further recognized by the Canadian federal government (e.g., through the 2022 Federal 2SLGBTQI+ Action Plan, Women and Gender Equality Canada, 2022), some provinces have enacted policies that limit the rights of transgender and non-binary people (Khonina & Salway, 2025). Concurrently, while the visibility and public support for the rights of gender diverse people grew in the 2010s, an increasingly vocal public discourse which aims to legitimize transphobic perspectives has been observed by some (Fish & Russell, 2022; Moore & Lopuck, 2025).
In contrast to changing attitudes toward gender expression, individuals’ perceptions of whether same-sex and opposite-sex couples should have the same rights to adopt children were unchanged. In 2025, more women (80%) than men (71%) agreed with this position, proportions that were statistically the same as in 2018 (79% and 70%, respectively). The rights of same-sex couples to adopt children have been entrenched in Canadian law since the 2005 Civil Marriage Act (MacIntosh et.al., 2010).
Slight increase in women, decrease in men who feel women face significant obstacles to get ahead
In addition to statements about their perceptions of gender-based violence and the rights of transgender and LGB+ people,Note respondents to the SSPPS were asked whether they believe that there are significant obstacles that make it harder for women to get ahead than men. In 2025, women (75%) were considerably more likely to agree with this statement than men (52%) (Table 1). Additionally, small changes were noted in the perceptions of both women and men: slightly more women agreed with this statement in 2025 than in 2018 (72%), while among men the change moved in the opposite direction, with a smaller proportion agreeing in 2025 than seven years prior (55%). Among men, this reflected a higher proportion stating that they neither agree nor disagree in 2025 (24%) compared to 2018 (22%).
Start of text box 2
Text box 2
Perceptions of gender-based violence, gender equality, gender identity and
gender expression among the gender-diverse population
The Survey of Safety in Public and Private Spaces (SSPPS) collects information on both sex at birth and gender, which includes the option for respondents to specify their gender. The term “cisgender” refers to people whose reported gender corresponds to their reported sex at birth, while the term “transgender” refers to people whose reported gender does not correspond to their reported sex at birth. In the present article, the term “non-binary” is used to describe all genders that are neither exclusively man nor woman, although individuals might self-identify with other terms. The gender-diverse population is relatively small, accounting for about 0.3% of the population 15 years of age and older as of the 2021 Census (Statistics Canada, 2022).
This Juristat article focuses on the perceptions of women (including cisgender and transgender women) and men (including cisgender and transgender women), with non-binary respondents randomly recoded into one of these categories during the data production process. This is done in order to maintain privacy and confidentiality, and also to permit disaggregation by other individual characteristics, given the relatively small population.Note That said, it is possible to broadly examine the perceptions of transgender and non-binary people as a combined group.
Without exception, the proportion of gender diverse individuals who agreed with statements supporting gender expression or gender equality was higher than it was among cisgender women and cisgender men (Chart 3). For example, the vast majority (97%) of gender diverse people felt that people should be able to express their gender however they choose, compared with 77% of cisgender women and 69% of cisgender men. Small proportions of gender diverse people indicated that they do either do not agree that people should be able to express their gender however they choose (1.4%) or that they neither agree nor disagree (1.4%).
More than nine in ten (94%) gender diverse people stated that they would support a family member who came out as transgender. Again, this proportion was considerably larger than among cisgender women (76%) and cisgender men (65%).
Chart 3 start
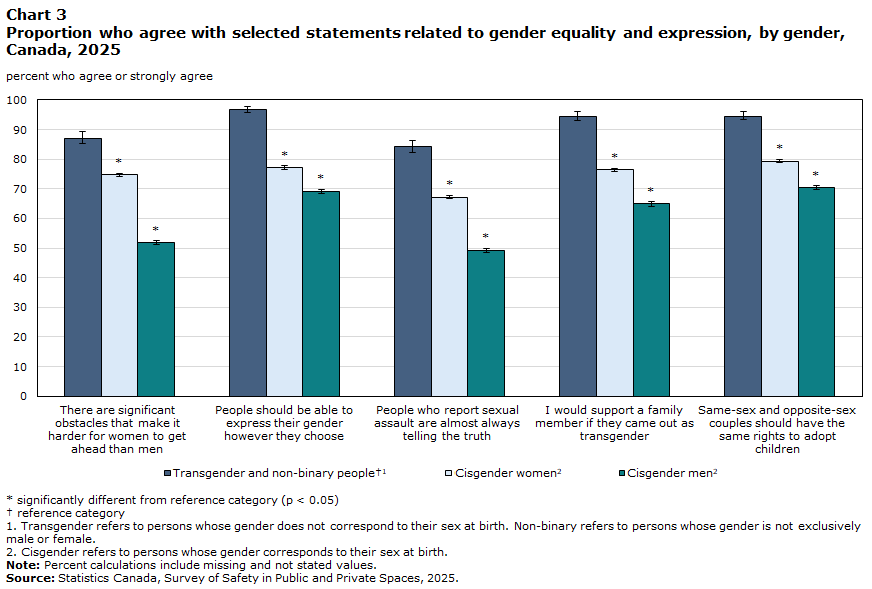
Data table for Chart 3
| Transgender and non-binary people Data table for chart 3 Note † Data table for chart 3 Note 1 | Cisgender women Data table for chart 3 Note 2 | Cisgender men Data table for chart 3 Note 2 | |||||||
|---|---|---|---|---|---|---|---|---|---|
| percent who agree or strongly agree | 95% confidence interval | percent who agree or strongly agree | 95% confidence interval | percent who agree or strongly agree | 95% confidence interval | ||||
| from | to | from | to | from | to | ||||
Source: Statistics Canada, Survey of Safety in Public and Private Spaces, 2025. |
|||||||||
| There are significant obstacles that make it harder for women to get ahead than men | 87 | 85 | 89 | 75 Data table for chart 3 Note * | 74 | 75 | 52 Data table for chart 3 Note * | 51 | 53 |
| People should be able to express their gender however they choose | 97 | 96 | 98 | 77 Data table for chart 3 Note * | 77 | 78 | 69 Data table for chart 3 Note * | 69 | 70 |
| People who report sexual assault are almost always telling the truth | 84 | 82 | 86 | 67 Data table for chart 3 Note * | 67 | 68 | 49 Data table for chart 3 Note * | 49 | 50 |
| I would support a family member if they came out as transgender | 94 | 93 | 96 | 76 Data table for chart 3 Note * | 76 | 77 | 65 Data table for chart 3 Note * | 64 | 66 |
| Same-sex and opposite-sex couples should have the same rights to adopt children | 95 | 93 | 96 | 79 Data table for chart 3 Note * | 79 | 80 | 70 Data table for chart 3 Note * | 70 | 71 |
Chart 3 end
Large differences were noted between gender-diverse individuals and cisgender men when it came to the proportion who agreed that there are significant obstacles that make it harder for women to get ahead than men (87% versus 52%) and that victims of sexual assault are almost always telling the truth (84% versus 49%).
When it came to whether they thought that same-sex and opposite-sex couples should have the same rights to adopt children, 95% of gender diverse people were in agreement. Proportions were smaller among both cisgender women (79%) and cisgender men (70%).
Though the magnitude of the gaps was smaller compared to other statements included in the survey, a higher proportion of gender-diverse people disagreed with statements that could legitimize or excuse intimate partner violence, when compared with cisgender women and men. For instance, 93% of gender-diverse people disagreed that violence between partners can be excused if someone gets so angry they lose control, compared with 88% of cisgender women and 85% of cisgender men.
End of text box 2
Section 2: Perceptions of gender expression and gender equality among population groups
For a deeper understanding of attitudes about issues related to gender-based violence and gender expression in 2025, two of the eight perceptions questions were selected for more detailed analysis: “People should be able to express their gender however they choose” and “There are significant obstacles that make it harder for women to get ahead than men”. These statements were selected because they reflect the changes in attitudes measured by the SSPPS relative to 2018, as well as the largest gap between the perceptions of women and men.
Respondents’ levels of agreement with these statements were examined according to various sociodemographic characteristics, providing a more nuanced view of how different groups tend to perceive gender-related issues and how they may differ across identities. With few exceptions, a larger proportion of women than men supported individuals’ ability to express their gender and agreed that women face greater barriers to get ahead than men.
Overall, most people in Canada supported the position that individuals should be able to express their gender however they choose, with almost eight in ten (77%) women and seven in ten (70%) men agreeing with this statement in 2025 (Table 1). Additionally, opinions on gender expression also differed among some demographic groups in Canada. Within most of these groups, women remained more likely than men to support people’s ability to express their gender.
Younger women more likely than older women to support people’s gender expression
In general, younger people were more likely than their older counterparts to agree that people should be able to express their gender however they choose. This was very much the case among women, with about eight in ten women 15 to 24 years (82%) and 25 to 34 years (81%) in agreement. These proportions were higher than among older women (Table 2). The pattern was somewhat different among men: while those most likely to agree that people could freely express their gender were aged 24 to 35 (73%), the youngest men (aged 15 to 24) were considerably less likely to agree (68%) and more in line with older age groups. Notably, the difference between women and men aged 15 to 24 when it came to support for gender expression was the largest difference across all demographic characteristics where women and men were compared in this study (a difference of 14 percentage points).
Closely related to individuals’ ages is their marital status, with younger people more likely to report being single (never married). In 2025, women who were single were considerably more likely (82%) to support people’s gender expression when compared to women who were married or in a common-law relationship (75%) and those who were separated, divorced or widowed (76%) (Table 2). Among men, however, no differences were noted in the proportions who supported people’s gender expression when it came to marital status.
Agreement with gender expression higher among university-educated people
Support for people’s ability to express their gender however they choose varied considerably by level of education. Agreement was highest among those with a university education, for both women (81%) and men (74%) (Table 2). Among women, those with an education that was below the high school level (72%) were least likely to agree that others should be able to express their gender. Among men, however, similar proportions of those with an education that was lower than high school (65%) or at the high school (68%) or trade school/college level (68%) supported people’s gender expression.
Unlike with education, employment status did not appear to have a strong link to people’s attitudes towards gender expression. Among women, those who had been employed in the previous year were slightly more likely to support people’s gender expression than those who had not been employed (79% versus 75%) (Table 2). Among men, there was no statistically significant difference between those who had and had not been employed when it came to support for gender expression (69% versus 70%).
Larger proportions of women with higher incomes support others’ right to express their gender
Whether or not a person supported people’s right to express their gender varied among income groups, though differences were seen among women only. Among women, those whose before-tax personal income was $60,000 a year or more were more likely to support gender expression, compared to those whose earnings were less than $20,000 annually.Note Among women earning $60,000 to $79,999, 79% supported others’ gender expression; proportions were similar among those earning $80,000 to $99,999 (80%), $100,000 to $119,999 (82%), and $120,000 or more (83%). In comparison, 76% of women earning less than $20,000 annually supported gender expression.
First Nations women more likely to support people’s gender expression
A larger proportion of First Nations women (82%) than non-Indigenous women (77%) supported people’s right to express their gender (Table 2).Note In contrast, no statistically significant differences in levels of agreement were found between non-Indigenous women and Métis women (77%) or Inuit women (74%). Similarly, no significant differences were noted between non-Indigenous men and First Nations men, Métis men and Inuit men when it came to support for people’s rights to gender expression.
Agreement with people’s right to express their gender however they choose varied among other population groups in Canada. For example, among women, statistically similar proportions of Filipina women (82%) and non-racialized, non-Indigenous women (80%) supported gender expression (Table 2). The proportion of Filipina women in support was higher than that of Filipino men (75%), and the latter was as likely to support gender expression when compared to non-racialized, non-Indigenous men (71%). Southeast Asian women (79%) were also as likely to support gender expression as non-racialized, non-Indigenous women, and the same was true for Southeast Asian men (77%) compared to non-racialized, non-Indigenous men. These groups were the exception, however, as overall, racialized women (71%) and men (67%) were less likely than non-racialized, non-Indigenous women and men to support gender expression.
People born in Canada were more likely to agree that individuals should be able to express their gender however they choose when compared to those born elsewhere. This was the case among women, among whom 80% of those born in Canada agreed (versus 70% of women born elsewhere), and among men, among whom 71% of those born in Canada agreed (versus 67%) (Table 2).
LGB+ people most likely to support gender expression
Support for people’s ability to express their gender however they choose was high among LGB+Note people in Canada. Compared to heterosexual women (76%), 96% of LGB+ women (including 96% of lesbian women and 96% of bisexualNote women) were in support of people’s right to express their gender (Table 2). This pattern was similar among men, with 93% of LGB+ men supporting gender expression (versus 68% of heterosexual men). High proportions of both gay men (93%) and bisexual men (93%) agreed that people should be free to express their gender however they choose.
Support for gender expression higher among women who identify as having a disability
The 2025 SSPPS asked respondents whether they considered themselves to be a person with a disability: that is, whether they have a long-term difficulty or condition, such as vision, hearing, mobility, flexibility, dexterity, pain, learning, developmental, memory or mental health-related impairments, that limit their daily activities. Women who identified as a person with a disability were more likely to support people’s gender expression (81%, versus 77% of women who did not identify this way) (Table 2). Among men, those who self-identified as a person with a disability were also more likely than those who did not to support people’s gender expression (73% and 69%).
Lower proportions of men in the Prairie provinces and Ontario support gender expression
Regardless of the province or territory in which they lived, the majority of people agreed that individuals should be able to express their gender however they choose. The proportion of women who lived in Nova Scotia (84%), Newfoundland and Labrador (82%), and Quebec (82%) who agreed was higher compared with the rest of the country, while lower proportions were observed among women in Ontario (76%), Alberta (73%), Nunavut (72%), and Saskatchewan (69%) (Table 4). Men in Yukon (77%), the Northwest Territories (75%), Quebec (74%), and British Columbia (72%) had higher than average proportions who agreed that people should be able to express their gender however they choose, while a lower proportion of men agreed with this statement in Ontario (69%), Alberta (69%), Manitoba (63%), and Saskatchewan (60%), relative to the rest of the country.
In all provinces and territories but Prince Edward Island and Nunavut, where there was no significant difference, the proportion who agreed that people should be free to express their gender however they choose was higher among women than men.
As noted in Section 1, a decline in the proportion of people in Canada who agreed that people should be able to express their gender however they choose was noted between 2018 and 2025. This decrease was seen among women and men in almost all provinces and territories.Note Notably, the largest decline among women came in Saskatchewan, where the proportion who agreed was 14 percentage points lower in 2025 (69%) than in 2018 (83%). Among men, seven provinces—Newfoundland and Labrador, Prince Edward Island, Nova Scotia, New Brunswick, Quebec, Manitoba, and Saskatchewan—recorded declines of at least 9 percentage points between 2018 and 2025. Declines were steeper among men than women in all provinces and territories where decreases were noted, with the exception of Saskatchewan and Alberta, where the decline was steeper among women.
Residents of urban areas of the provinces were slightly more likely than those living in the provinces’ rural areas to agree with people’s ability to express their gender however they choose. This was the case with women in urban areas, among whom 78% supported gender expression (compared to 75% of those in rural areas) as well as with men (70% versus 66%) (Table 2). Of note, residents of urban and rural areas differ with respect to some socioeconomic characteristics relevant to perceptions of gender expression, including age (Statistics Canada, 2025).
Across most demographics, women more likely than men to agree that women face obstacles
According to the 2025 SSPPS, most people agreed that women face significant obstacles to getting ahead compared to men—though a large gap was noted in the proportions of women (75%) versus men (52%) who felt this way (Table 1). Additionally, this gap had increased slightly from 2018, with women moving toward more agreement (from 72% in 2018 to 75% in 2025) while men moved towards less agreement (from 55% to 52%). Differences were also noted between some demographic groups in 2025, with respect to whether people agreed that women face significant obstacles.
The statement “there are significant obstacles that make it harder for women to get ahead than men” is open to two subtly different interpretations. On the one hand, it may be expected that women who personally encounter such obstacles, or women and men who hear about them from women they know, may be inclined to agree with the statement. On the other hand, even barring first- or second-hand experience with such obstacles, some people may agree with the statement based on it being presented to them as true during their education, in the media, and in other spheres of public discourse. In this way, measuring levels of agreement with this statement may in fact be measuring two different things simultaneously: first, the actual presence of barriers women face, and second, a degree of awareness present in Canadian society about gender inequality.
Younger women, older men more likely to agree that women face significant obstacles
People’s age figured prominently in whether they agreed that women face significant obstacles to getting ahead, and patterns were different among women and men. Among women, the proportions who agreed were highest among those in the two youngest age groups (78% among those aged 15 to 24 years and among those aged 25 to 34 years), relative to women aged 35 to 44 (72%), 45 to 54 (73%), or 55 and older (74%) (Table 3). The case was quite different among men: under half of men in all age groups under 55 (including the youngest age group) agreed with the statement, with no significant differences among them. Instead, men aged 55 and older were the most likely to agree that women faced obstacles to get ahead (59%).
Notably, what was seen among women in 2025 was the opposite of what was noted in 2018. At that time, just under seven in ten women aged 15 to 24 (68%), 25 to 34 (68%), or 35 to 44 (69%) agreed that women face significant obstacles that make it harder for them to get ahead than men, while the proportion who agreed was highest among women 55 and older (77%) (Chart 4). In other words, younger women in 2025 were more likely than younger women in 2018 to agree that there are significant obstacles facing women and making it more difficult for them than for men.
Chart 4 start
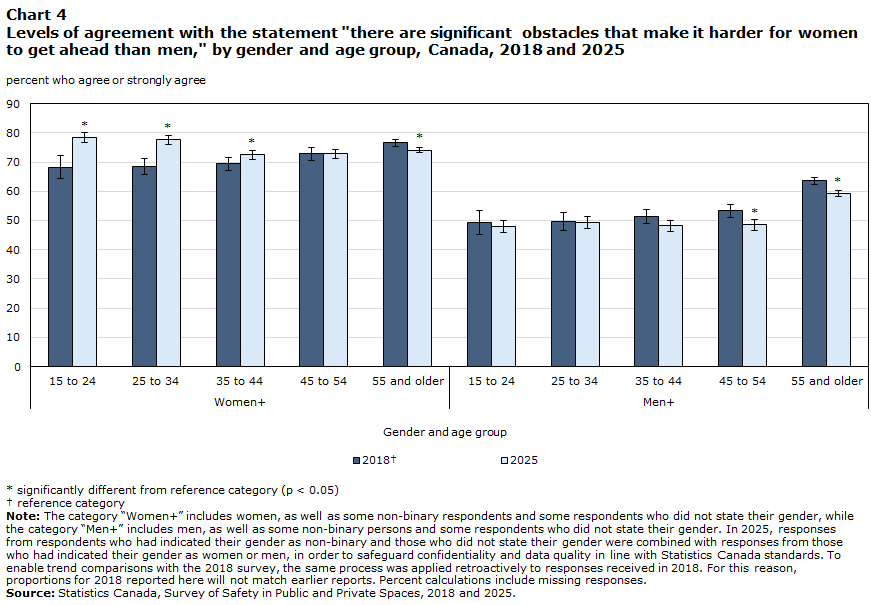
Data table for Chart 4
| 2018 Data table for chart 4 Note † | 2025 | |||||
|---|---|---|---|---|---|---|
| percent who agree or strongly agree | 95% confidence interval | percent who agree or strongly agree | 95% confidence interval | |||
| from | to | from | to | |||
Source: Statistics Canada, Survey of Safety in Public and Private Spaces, 2018 and 2025. |
||||||
| Women+ | ||||||
| 15 to 24 | 68 | 64 | 72 | 78 Data table for chart 4 Note * | 77 | 80 |
| 25 to 34 | 68 | 66 | 71 | 78 Data table for chart 4 Note * | 76 | 79 |
| 35 to 44 | 69 | 67 | 72 | 72 Data table for chart 4 Note * | 71 | 74 |
| 45 to 54 | 73 | 71 | 75 | 73 | 71 | 74 |
| 55 and older | 77 | 75 | 78 | 74 Data table for chart 4 Note * | 73 | 75 |
| Men+ | ||||||
| 15 to 24 | 49 | 45 | 53 | 48 | 46 | 50 |
| 25 to 34 | 50 | 47 | 53 | 49 | 47 | 51 |
| 35 to 44 | 51 | 49 | 54 | 48 | 46 | 50 |
| 45 to 54 | 53 | 51 | 56 | 49 Data table for chart 4 Note * | 47 | 50 |
| 55 and older | 64 | 62 | 65 | 59 Data table for chart 4 Note * | 58 | 60 |
Chart 4 end
There were slight declines from 2018 to 2025 in the proportions of men aged 45 to 54 and 55 and older who agreed that women face significant obstacles that make it harder for them to get ahead. There was no significant change among men under the age of 45.
Single men less likely to agree that women face significant obstacles to get ahead
As was the case with people aged 15 to 24—and perhaps relatedly—agreement with whether women face obstacles to getting ahead varied widely between single women and single men. Women who were single (never married) were particularly likely (79%) to feel that women face significant obstacles to getting ahead, more so than women who were married or in common-law relationships (72%) or who were separated, divorced or widowed (75%) (Table 3, Chart 5). In contrast, less than half (49%) of single men agreed, which was a smaller proportion than among their counterparts who were currently (54%) or formerly (53%) in a marriage or common-law relationship.
Chart 5 start

Data table for Chart 5
| Women+ | Men+ | |||||
|---|---|---|---|---|---|---|
| percent | 95% confidence interval | percent | 95% confidence interval | |||
| from | to | from | to | |||
Source: Survey of Safety in Public and Private Spaces, 2025. |
||||||
| Single, never married Data table for chart 5 Note † | 79 | 78 | 80 | 49 Data table for chart 5 Note ** | 48 | 51 |
| Separated, divorced, or widowed | 75 Data table for chart 5 Note * | 74 | 76 | 53 Data table for chart 5 Note *** | 50 | 55 |
| Married or common-law | 72 Data table for chart 5 Note * | 72 | 73 | 54 Data table for chart 5 Note *** | 53 | 55 |
Chart 5 end
Agreement that women face obstacles highest among university-educated people
When it came to whether they agreed that women face significant obstacles to getting ahead, a large gap was noted between women and men who had earned a university education compared to those who had not. Among women, 78% of those with a university education agreed with this statement, higher than among women with an education below the high school level (67%), at the high school level (74%) or at the level of college or trade school (73%) (Table 3). Among men, those with a university education were also more likely than others to perceive significant obstacles faced by women (56%)—though notably, this proportion was considerably lower than among women with an education below the high school level. Additionally, unlike with women, attitudes among men with an education below the high school level (51%) were similar to those with a high school (51%) or college/trade school education (50%).
Slight differences were noted among women who had been employed in the previous year (76%) compared to those who had not (73%) on the question of whether women face significant obstacles to getting ahead (Table 3). Among men, the difference was considerably larger and showed the opposite pattern, with a smaller proportion (50%) of those who had been employed than those who had not (59%) agreeing with the statement. Possibly, this pattern may be related to age: among men, the highest level of agreement among age groups was noted among those aged 55 and over, many of whom may have been retired from employment.
Women with higher incomes more likely to feel that women face obstacles to getting ahead
Women in the three highest income groups were more likely than those with the lowest incomes to agree that women face significant obstacles to getting ahead relative to men. Almost eight in ten (78%) women whose annual personal before-tax income was $80,000 to $99,999 agreed, along with 80% (respectively) of women earning $100,000 to $119,999 and those earning $120,000 or more (Table 3).Note In comparison, a smaller proportion (74%) of women with an income lower than $20,000 per year agreed. Few differences between income groups were noted among men, though those earning $20,000 to $39,999 were more likely to feel that women face obstacles to getting ahead than were those earning less than $20,000 per year (55% versus 51%).
Women more likely to agree that women face obstacles to getting ahead, across all racialized groups
People in Canada have diverse backgrounds and identities. On the whole, non-racialized, non-Indigenous women (77%) were more likely than racialized women (67%) to agree that women face significant obstacles to getting ahead, with the exceptions among specific groups being Japanese women (72%E use with caution) and women belonging to multiple racialized population groups (75%) (both of which groups showed no significant difference from non-racialized, non-Indigenous women) (Table 3). Similarly, non-racialized, non-Indigenous men (55%) were more likely to agree that women face significant obstacles, compared with racialized men (46%). The exceptions were Black men (52%), Latin American men (53%), Southeast Asian men (51%) and men belonging to multiple population groups (56%), among whom proportions were statistically similar to what was noted among non-racialized, non-Indigenous men. Across all racialized groups, the proportions of women who agreed that women face obstacles to getting ahead were larger than among men.
Individuals born outside of Canada were less likely to agree that women face obstacles relative to men than their Canadian-born counterparts. This was the case among women, where 79% of those born in Canada agreed with the statement, compared to 65% of women born elsewhere (Table 3). Among men, those born in Canada were also more likely than those born elsewhere to agree that women face obstacles (55% versus 47%).
Among First Nations people, Métis and Inuit, differences were noted between women and men when it came to whether or not people thought that women face significant obstacles to getting ahead. Women were consistently more likely to agree than men, including First Nations women (80%) versus First Nations men (52%), Métis women (78%) versus Métis men (52%), and Inuit women (65%) versus Inuit men (48%). Compared to non-Indigenous people, First Nations women (80%) were more likely than non-Indigenous women (75%) to think that women face significant obstacles, while Inuit women (65%) were less likely. Among men, no statistically significant differences were noted between First Nations men (52%), Métis men (52%), Inuit men (48%) and non-Indigenous men (52%) when it came to this statement.
Perception that women face significant obstacles highest among women in Nova Scotia
In nearly all provinces and territories, a higher proportion of women than men agreed that there are significant obstacles that make it harder for women to get ahead than men. The exception was the Northwest Territories, where the difference between women (65%) and men (58%) was not statistically significant.
Nearly eight in ten (78%) women in Nova Scotia agreed that women face significant obstacles making it harder for them to get ahead than men, higher than the rest of the country (Table 4).Note In contrast, smaller proportions of women in Quebec (74%), Saskatchewan (70%), the Northwest Territories (65%), and Nunavut (55%) agreed with this statement, when compared with elsewhere in Canada. Among men, relative to the rest of the country, the proportion who agreed was higher in Nova Scotia (58%) and British Columbia (54%), and lower in Saskatchewan (49%) and Nunavut (41%).
Compared to those living in rural areas of the provinces, residents of the provinces’ urban areas were slightly more likely to agree that women face obstacles to getting ahead. This was the case among women, among whom 75% of those in provincial urban areas agreed that women face significant obstacles (versus 73% of women in provincial rural areas) (Table 3). Among men, those living in urban areas of the provinces were also more likely than those in provincial rural areas to agree that women face obstacles (53% versus 50%). Notably, men living in the territories were as likely as men in provincial urban areas to agree that women face significant obstacles (54% and 53%, a difference not found to be statistically significant).
Almost 9 in 10 LGB+ women agree that women face obstacles
LGB+ people most often agreed that women face more obstacles to getting ahead than men. Levels of agreement were particularly high among LGB+ women (89%), compared to 74% of heterosexual women (Table 3). A similarly large gap was noted between LGB+ men (76%) compared to their heterosexual counterparts (51%).
Those who identify as having a disability more likely to agree that women face obstacles
People who identified as a person with a disabilityNote were more likely to agree that women face significant obstacles to getting ahead relative to men. Just over eight in ten (81%) women who identified as having a disability agreed, a proportion that was larger than among women who did not identify this way (74%) (Table 3). The pattern was similar among men, among whom a larger proportion of those who identified as having a disability (58%) agreed compared to other men (52%).
Section 3: Experiences and perceptions of gender-based violence
People’s perceptions and their life experiences are often deeply interconnected. When it came to attitudes about gender-based violence, people who had experienced intimate partner violence,Note sexual assault or unwanted sexual behaviours in public, at work or at schoolNote tended to disagree most strongly with statements that excuse or legitimize violence and control in relationships (Table 5). In Canada, women are considerably more likely to experience these forms of gender-based violence than men (Cotter & Burczycka, 2026).
The vast majority of women disagreed with statements excusing or legitimizing violence in relationships, whether or not they had experienced intimate partner violence or sexual assault in their lifetimes (since age 15) or unwanted sexualized behaviours in the 12 months preceding the survey.Note However, the proportions who disagreed were even larger among women who had experienced these forms of violence and unwanted behaviours. For instance, while 83% of women who did not experience these forms of gender-based violence disagreed that violence between partners can be excused if people get so angry they lose control, this was the case among larger proportions of women who had experienced unwanted sexualized behaviours in the preceding year (94%) or sexual assault (94%) or intimate partner violence (93%) in their lifetime.
When asked if it was understandable that someone would react violently if they suspected their partner of having an affair, 68% of women who did not experience gender-based violence in their lifetime disagreed. Proportions were notably higher among women who had been victimized: 81% of women who had experienced unwanted sexualized behaviours disagreed, as did 81% of women who had been sexually assaulted and 79% of those who had experienced intimate partner violence in their lifetime.
Among women who had not experienced gender-based violence in their lifetime, 51% disagreed that people have the right to check who their partner has been calling and texting at all times. Again, the proportions who disagreed were larger among women who had experienced unwanted sexualized behaviours (62%) in the past 12 months or who had been victims of intimate partner violence (61%) or sexual assault (63%) in their lifetimes.
Among men, the association between experiences of gender-based violence and attitudes toward it was similar. More than eight in ten (82%) men who had never experienced gender-based violence disagreed that violence between partners can be excused if people get so angry they lose control. This proportion rose to nine in ten men who had experienced violence: 91% of men who had experienced unwanted sexualized behaviours in the past year, 92% of men who had been sexually assaulted in their lifetime and 91% of men who had experienced intimate partner violence at some point in their lives disagreed with the statement.
Similarly, more men who had experienced unwanted sexualized behaviours in the past year (68%) or who had experienced sexual assault (74%) or intimate partner violence (69%) in their lifetime disagreed that it is understandable if someone reacts violently if they suspect their partner was having an affair, compared to men who had never experienced gender-based violence (63%). The same was true when it came to whether they thought people have the right to check who their partner is calling or texting: larger proportions of men who had experienced unwanted sexualized behaviours in the past year disagreed (62%), along with more men who had experienced intimate partner violence (62%) or sexual assault (67%) in their lives, compared to men that had not had these experiences (55%).
Summary
People’s perceptions of gender-based violence, gender expression and gender equality are closely linked to their own experiences, and can also be tied to broader social values and norms. At the highest level, women—who are more likely than men to experience gender-based violence—more commonly disagree with statements that legitimize or excuse gender-based violence and acknowledge that gender inequality presents significant obstacles for women.
Additionally, women and men who experienced intimate partner violence, sexual assault or unwanted sexualized behaviours were generally more likely to disagree with statements that legitimize gender-based violence than those who did not have these experiences, though disagreement was higher among women.
Notably, support for the rights of LGB+ people, transgender people and gender expression was high among women, even among those who did not belong to these groups, suggesting that factors other than direct personal experience also shape some people’s perceptions.
Overall, findings from the 2025 SSPPS show that most people in Canada reject gender-based violence and gender inequality, and support LGB+ rights and others’ ability to freely express their gender. Attitudes about gender-based violence were generally similar to what they were in 2018, with a slight shift toward broader rejection of statements that legitimize or excuse it. Meanwhile, attitudes about freedom of expression of one’s gender appear to have shifted somewhat toward less acceptance.
When it came to demographics, the highest levels of agreement with statements about the equality of women and about gender expression were noted among young women, people who identify as having a disability, people with a university education, LGB+ people and gender diverse people.
Detailed data tables
Data sources and methodology
In 2024/2025, Statistics Canada conducted the second cycle of the Survey of Safety in Public and Private Spaces (SSPPS). The SSPPS was previously collected in 2018. The purpose of the survey is to collect information on Canadians’ experiences in public, at work, online, and in their intimate partner relationships.
The target population for the SSPPS included all persons 15 years of age and older in Canada, excluding full-time residents of institutions and residents of First Nations reserves. The 2025 SSPPS is a sample survey with a cross-sectional design. The survey in the provinces also now uses a targeted respondent approach, meaning a sample of persons is directly selected from the survey frame. The survey frame for the SSPPS in the territories is an area frame of dwellings constructed for the Labour Force Survey (LFS). The sample of selected dwellings was sent to the field for collection. Upon contact with a resident of the selected dwelling, one household member 15 years of age and older was randomly selected to complete the SSPPS questionnaire.
In the provinces, data collection took place from October 2024 to June 2025 inclusively. Responses were obtained by self-administered online questionnaire or by interviewer-administered telephone questionnaire. Respondents were able to respond in the official language of their choice. The final sample size for the 10 provinces was 46,511 respondents. The response rate in the provinces was 32.3%, down from 43.1% in 2018.
In the territories, data collection took place from January to July 2025 inclusively. Responses were obtained by self-administered online questionnaire or by interviewer-administered in-person questionnaire. Respondents were able to respond in the official language of their choice. The final sample size for the 3 territories was 2,036 respondents. The response rate in the territories was 53.1%, down from 73.2% in 2018.
Non-respondents included people who refused to participate, could not be reached, or could not speak English or French. Respondents in the sample were weighted so that their responses represent the non-institutionalized, off-reserve Canadian population aged 15 and older.
Data limitations
As with any household survey, there are some data limitations. The results are based on a sample and are therefore subject to sampling errors. Somewhat different results might have been obtained if the entire population had been surveyed.
For the quality of estimates, the lower and upper bounds of the confidence intervals are presented. Confidence intervals should be interpreted as follows: If the survey were repeated many times, then 95% of the time (or 19 times out of 20), the confidence interval would cover the true population value.
Caution should be exercised when interpreting results, such as weighted frequencies or percentages, for the Inuit population within the provinces in 2025. Even if the number of respondents for this subpopulation is sufficient to meet quality guidelines, there is still a concern regarding the quality of the data as bias might subsist after the weighting process. Note that this concern only applies to the Inuit population in the provinces and not in the territories. Estimates for Inuit in 2018 are largely reflective of the population living in the territories. Estimates for Inuit in the provinces for 2018 are not releasable due to sample size and data quality.
References
Cotter, A. (2024). Criminal justice outcomes of sexual assault in Canada, 2015 to 2019. Juristat. Statistics Canada Catalogue no. 85-002-X.
Cotter, A. & Burczycka, M. (2026). Gender differences in experiences of violence and unwanted sexual behaviour in Canada, 2025. Juristat. Statistics Canada Catalogue no. 85-002-X.
Fish, J. N. & Russell, S. T. (2022). The paradox of progress for sexual and gender diverse youth. Current Opinion in Psychology, Vol. 48.
Fleming, P. J., Gruskin, S., Rojo, F., & Dworkin, S. L. (2015). Men's violence against women and men are inter-related: Recommendations for simultaneous intervention. Social Science and Medicine. Vol. 146.
Jewkes, R., Flood, M., & Lang, J. (2014). From work with men and boys to changes of social norms and reduction of inequities in gender relations: a conceptual shift in prevention of violence against women and girls. Lancet. Vol. 385, no. 9977.
Khonina, M. & Salway, T. (2025). The rise of anti-transgender laws and the role of public health advocacy. Canadian Journal of Public Health. Vol. 116 (1).
MacIntosh, H., Reissing, E. D., & Andruff, H. (2010). Same-sex marriage in Canada: The impact of legal marriage on the first cohort of gay and lesbian Canadians to wed. The Canadian Journal of Human Sexuality. Vol. 19, no. 3.
Mayhill, A. & Hohl, K. (2019). The “golden thread”: Coercive control and risk assessment for domestic violence. Journal of Interpersonal Violence. Vol. 34, no. 21-22.
Moore, S. & Lopuck, K. (2025). Discursive Decoys: The Legitimation of Homophobia and Transgenderphobia, Educational Neutrality, and Teacher Deprofessionalization in Mainstream Media’s Coverage of the “Parental Rights” Movement in Manitoba. Canadian Journal of Education. Vol. 48 (2).
Office of the Federal Ombudsperson for Victims of Crime. (2025). Rethinking Justice for Survivors of Sexual Violence: A systemic investigation. Government of Canada catalogue no. J84-13/2025E-PDF.
Statistics Canada. (2022). Understanding sex at birth and gender of people in Canada. The Daily. Statistics Canada Catalogue no. 11-001-X.
Statistics Canada. (2026). Annual demographic estimates, rural and small town and functional urban areas: Interactive dashboard.
Women and Gender Equality Canada. (2022). Federal 2SLGBTQI+ Action Plan.
- Date modified: