
Insights on Canadian Society
Changes in alcohol consumption from 2015 to 2024

Text begins
Overview of the study
Data from the Canadian Community Health Survey and the Canadian Health Survey on Children and Youth were used to highlight how drinking behaviours in Canada have changed since 2015.
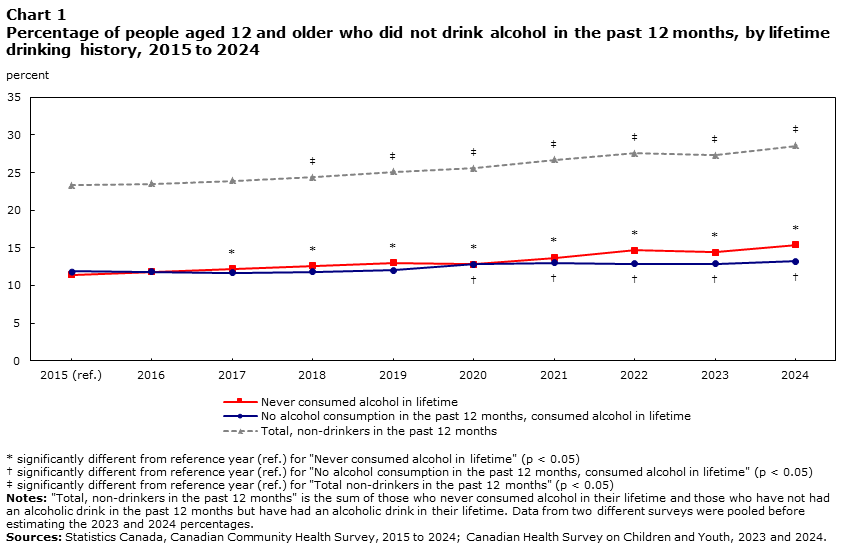
- The proportion of Canadians aged 12 and older who have not had an alcoholic drink in the past 12 months increased from 2015 (23%) to 2024 (29%).
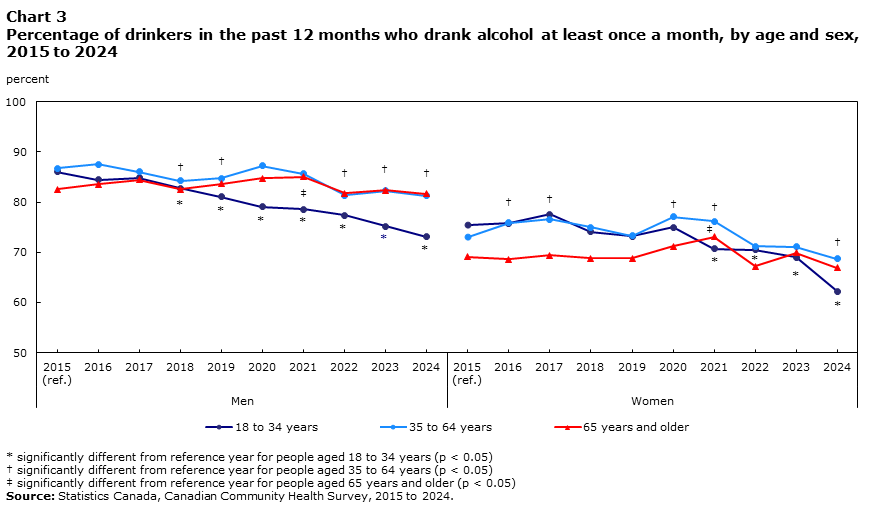
- Among adults who are drinking, there is a trend towards drinking less often, with the proportion of adult drinkers reporting that they drink alcohol less than once a month increasing from 20% in 2015 to 27% in 2024.
- Although heavy drinking declined among young adults aged 18 to 34 during the COVID-19 pandemic, the proportion of regular drinkers in this age group who are drinking heavily has returned to pre-pandemic levels.
Introduction
Alcohol is one of the most commonly consumed psychoactive substances in
While alcohol continues to be widely consumed, several countries are seeing shifts in consumption patterns. For example, in Australia, Ireland and the United Kingdom, it appears that today’s generation of young people are not drinking as much as their parents did at a similar
To better understand how alcohol consumption behaviours are changing over time, it is important to look at multiple measures of alcohol consumption, including the prevalence and frequency of alcohol consumption, as well as the amount consumed. This article will use data from the Canadian Community Health Survey and the Canadian Health Survey on Children and Youth to examine trends and changes in alcohol consumption in Canada over the past decade, including the factors that may be driving a decrease in heavy drinking.
More Canadians are reporting that they have not had an alcoholic drink in the past 12 months
The number of current drinkers (people who had at least one alcoholic
Data table for Chart 1
| Year | Never consumed alcohol in lifetime | No alcohol consumption in the past 12 months, consumed alcohol in lifetime | Total, non-drinkers in the past 12 months |
|---|---|---|---|
| percent | |||
Sources: Statistics Canada, Canadian Community Health Survey, 2015 to 2024; and Canadian Health Survey on Children and Youth, 2023 and 2024. |
|||
| 2015 (ref.) | 11.4 | 11.9 | 23.3 |
| 2016 | 11.8 | 11.8 | 23.5 |
| 2017 | 12.2 Data table for Chart 1 Note * | 11.7 | 23.9 |
| 2018 | 12.6 Data table for Chart 1 Note * | 11.8 | 24.4Data table for Chart 1 Note ‡ |
| 2019 | 13.0 Data table for Chart 1 Note * | 12.0 | 25.1Data table for Chart 1 Note ‡ |
| 2020 | 12.8 Data table for Chart 1 Note * | 12.8Data table for Chart 1 Note † | 25.6Data table for Chart 1 Note ‡ |
| 2021 | 13.7 Data table for Chart 1 Note * | 13.0Data table for Chart 1 Note † | 26.7Data table for Chart 1 Note ‡ |
| 2022 | 14.7 Data table for Chart 1 Note * | 12.9Data table for Chart 1 Note † | 27.6Data table for Chart 1 Note ‡ |
| 2023 | 14.4 Data table for Chart 1 Note * | 12.9Data table for Chart 1 Note † | 27.3Data table for Chart 1 Note ‡ |
| 2024 | 15.4 Data table for Chart 1 Note * | 13.2Data table for Chart 1 Note † | 28.6Data table for Chart 1 Note ‡ |
The trend towards less frequent alcohol consumption was strongest among young men aged 15 to 34
Although there was an overall trend towards fewer people consuming alcohol, this change was more pronounced in some age groups compared with others (Chart 2). Some of the largest changes were observed among men younger than 35. In 2015, just over half (55%) of young

Data table for Chart 2
| Age group | |||||
|---|---|---|---|---|---|
| 12 to 14 years | 15 to 17 years | 18 to 34 years | 35 to 64 years | 65 years and older | |
| percent | |||||
|
|||||
| Men | |||||
| 2015 (ref.) | 90.6 | 54.9 | 12.1 | 15.3 | 25.2 |
| 2016 | 91.8 | 49.3 | 12.8 | 15.1 | 24.3 |
| 2017 | 88.3 | 53.3 | 14.3 | 15.7 | 23.8 |
| 2018 | 93.2 | 56.8 | 14.0 | 15.4 | 23.7 |
| 2019 | 92.6 | 55.3 | 15.4Data table for Chart 2 Note † | 15.5 | 24.8 |
| 2020 | 91.9 | 56.8 | 18.2Data table for Chart 2 Note † | 17.5Data table for Chart 2 Note ‡ | 23.9 |
| 2021 | 89.1 | 62.6 Data table for Chart 2 Note * | 21.1Data table for Chart 2 Note † | 17.8Data table for Chart 2 Note ‡ | 24.2 |
| 2022 | 92.1 | 67.4 Data table for Chart 2 Note * | 21.2Data table for Chart 2 Note † | 19.2Data table for Chart 2 Note ‡ | 27.7Data table for Chart 2 Note †† |
| 2023 | 92.2 | 64.9 Data table for Chart 2 Note * | 22.6Data table for Chart 2 Note † | 19.8Data table for Chart 2 Note ‡ | 24.9 |
| 2024 | 92.7 | 70.5 Data table for Chart 2 Note * | 23.4Data table for Chart 2 Note † | 21.3Data table for Chart 2 Note ‡ | 24.6 |
| Women | |||||
| 2015 (ref.) | 91.8 | 56.5 | 17.6 | 20.1 | 34.7 |
| 2016 | 91.4 | 55.5 | 18.0 | 21.5 | 34.2 |
| 2017 | 91.1 | 54.1 | 17.8 | 22.0Data table for Chart 2 Note ‡ | 33.7 |
| 2018 | 92.5 | 51.3 | 19.0 | 22.6Data table for Chart 2 Note ‡ | 34.6 |
| 2019 | 92.6 | 53.2 | 20.9Data table for Chart 2 Note † | 23.2Data table for Chart 2 Note ‡ | 34.2 |
| 2020 | 91.4 | 63.0 | 20.3 | 21.6 | 34.2 |
| 2021 | 90.7 | 59.3 | 24.0Data table for Chart 2 Note † | 22.4Data table for Chart 2 Note ‡ | 33.2 |
| 2022 | 87.7 | 59.8 | 22.1Data table for Chart 2 Note † | 24.0Data table for Chart 2 Note ‡ | 34.0 |
| 2023 | 90.7 | 60.1 | 22.8Data table for Chart 2 Note † | 23.2Data table for Chart 2 Note ‡ | 31.9Data table for Chart 2 Note †† |
| 2024 | 90.8 | 68.4 Data table for Chart 2 Note * | 23.6Data table for Chart 2 Note † | 24.8Data table for Chart 2 Note ‡ | 32.3Data table for Chart 2 Note †† |
Among current drinkers, there is a trend towards drinking alcohol less often
Some people drink alcohol a couple of times a year, while others report drinking alcohol on a monthly, weekly or daily basis. Over the past 10 years, the proportion of Canadians who reported drinking regularly (at least once a month) has been declining. In 2015, 80% of adults aged 18 and older who drank alcohol in the past year reported doing so at least once a month. By 2024, this proportion had fallen to 73%. This change occurred primarily among people aged 18 to 34 (Chart 3). In 2015, 86% of male drinkers aged 18 to 34 had a drink at least once a month. By 2024, this had dropped by 13 percentage points to 73%. A similar pattern was observed among women aged 18 to 34, with 76% of drinkers in 2015 reporting that they had an alcoholic drink at least once a month, dropping to 62% in 2024.
Data table for Chart 3
| Age group | |||
|---|---|---|---|
| 18 to 34 years | 35 to 64 years | 65 years and older | |
| percent | |||
|
|||
| Men | |||
| 2015 (ref.) | 86.0 | 86.7 | 82.5 |
| 2016 | 84.4 | 87.5 | 83.5 |
| 2017 | 84.8 | 86.0 | 84.4 |
| 2018 | 82.7 Data table for Chart 3 Note * | 84.2Data table for Chart 3 Note † | 82.5 |
| 2019 | 81.0 Data table for Chart 3 Note * | 84.7Data table for Chart 3 Note † | 83.6 |
| 2020 | 79.1 Data table for Chart 3 Note * | 87.2 | 84.7 |
| 2021 | 78.6 Data table for Chart 3 Note * | 85.6 | 85.0Data table for Chart 3 Note ‡ |
| 2022 | 77.4 Data table for Chart 3 Note * | 81.3Data table for Chart 3 Note † | 81.7 |
| 2023 | 75.2 Data table for Chart 3 Note * | 82.2Data table for Chart 3 Note † | 82.3 |
| 2024 | 73.1 Data table for Chart 3 Note * | 81.2Data table for Chart 3 Note † | 81.6 |
| Women | |||
| 2015 (ref.) | 75.5 | 73.1 | 69.1 |
| 2016 | 75.8 | 75.9Data table for Chart 3 Note † | 68.6 |
| 2017 | 77.6 | 76.6Data table for Chart 3 Note † | 69.4 |
| 2018 | 74.1 | 75.0 | 68.8 |
| 2019 | 73.2 | 73.3 | 68.8 |
| 2020 | 75.0 | 77.1Data table for Chart 3 Note † | 71.2 |
| 2021 | 70.7 Data table for Chart 3 Note * | 76.2Data table for Chart 3 Note † | 73.1Data table for Chart 3 Note ‡ |
| 2022 | 70.5 Data table for Chart 3 Note * | 71.2 | 67.2 |
| 2023 | 69.0 Data table for Chart 3 Note * | 71.1 | 69.9 |
| 2024 | 62.2 Data table for Chart 3 Note * | 68.7Data table for Chart 3 Note † | 66.9 |
Heavy drinking declined among young adults during the COVID-19 pandemic, but has recently returned to pre-pandemic levels among regular drinkers
How often someone drinks alcohol is only part of the story. It is also important to consider how much alcohol is consumed on these occasions. Some people might have one drink every day but never have four or five drinks on one occasion. Other people might drink less often, but when they do consume alcohol, they have at least four or five drinks on that one occasion.
The concept of heavy drinking is defined based on how many alcoholic drinks are consumed within a single occasion (four or more for women and five or more for men), as well as how often these occasions occur (at least once a month in the past 12 months). Therefore, heavy drinkers are a subset of regular drinkers.
During the pandemic, when many bars and restaurants were closed and opportunities to socialize were limited, the proportion of regular drinkers aged 18 to 34 who reported engaging in heavy drinking dropped significantly. Among men aged 18 to 34, the proportion went from 48% in 2015 to 39% in 2020 and 37% in 2021. For women aged 18 to 34, the proportion went from 40% in 2015 to 33% in 2020 and 31% in 2021 (Chart 4.1). The proportion of regular drinkers in this age group who were heavy drinkers returned to pre-pandemic levels in 2022 for men and in 2023 for women.
This return to pre-pandemic levels of heavy drinking is evident only when the analysis of drinking behaviours is limited to regular drinkers. The traditional approach that measures the percentage of all Canadians who are classified as heavy drinkers (Chart 4.2) would suggest that heavy drinking among men aged 18 to 34 decreased from 36% in 2015 to 24% in 2024. This study shows that this decrease in heavy drinking among all Canadians is coming primarily from a reduction in the number of people who drink alcohol (Chart 2), as well as less regular drinking among those who do drink (Chart 3), rather than from a reduction in heavy consumption among those who drink regularly (Chart 4.1).

Data table for Chart 4
| Regular drinkers | All adults | |||||
|---|---|---|---|---|---|---|
| 18 to 34 years | 35 to 64 years | 65 years and older | 18 to 34 years | 35 to 64 years | 65 years and older | |
| percent | ||||||
|
||||||
| Men | ||||||
| 2015 (ref.) | 48.0 | 34.5 | 16.0 | 36.2 | 25.3 | 9.8 |
| 2016 | 46.8 | 34.8 | 16.5 | 34.4 | 25.8 | 10.5 |
| 2017 | 48.0 | 35.0 | 17.4 | 34.8 | 25.4 | 11.1 |
| 2018 | 47.3 | 36.5 | 17.0 | 33.5 | 26.0 | 10.6 |
| 2019 | 46.5 | 35.8 | 17.2 | 31.9 Data table for Chart 4 Note * | 25.6 | 10.7 |
| 2020 | 38.9 Data table for Chart 4 Note * | 32.7 | 16.1 | 25.1 Data table for Chart 4 Note * | 23.5 | 10.4 |
| 2021 | 37.4 Data table for Chart 4 Note * | 31.4Data table for Chart 4 Note † | 16.3 | 23.2 Data table for Chart 4 Note * | 22.1Data table for Chart 4 Note † | 10.4 |
| 2022 | 48.1 | 41.0Data table for Chart 4 Note † | 22.0Data table for Chart 4 Note ‡ | 29.4 Data table for Chart 4 Note * | 26.9 | 12.9Data table for Chart 4 Note ‡ |
| 2023 | 42.7 Data table for Chart 4 Note * | 38.0Data table for Chart 4 Note † | 20.4Data table for Chart 4 Note ‡ | 24.8 Data table for Chart 4 Note * | 25.0 | 12.6Data table for Chart 4 Note ‡ |
| 2024 | 43.5 Data table for Chart 4 Note * | 40.4Data table for Chart 4 Note † | 22.3Data table for Chart 4 Note ‡ | 24.3 Data table for Chart 4 Note * | 25.8 | 13.7Data table for Chart 4 Note ‡ |
| Women | ||||||
| 2015 (ref.) | 40.1 | 25.0 | 8.9 | 24.9 | 14.5 | 4.0 |
| 2016 | 37.7 | 24.9 | 9.7 | 23.4 | 14.8 | 4.3 |
| 2017 | 38.4 | 27.5Data table for Chart 4 Note † | 10.8 | 24.5 | 16.4Data table for Chart 4 Note † | 4.9 |
| 2018 | 39.8 | 27.3 | 10.4 | 23.8 | 15.8 | 4.6 |
| 2019 | 37.9 | 27.5Data table for Chart 4 Note † | 11.0Data table for Chart 4 Note ‡ | 21.9 Data table for Chart 4 Note * | 15.4 | 4.9Data table for Chart 4 Note ‡ |
| 2020 | 32.9 Data table for Chart 4 Note * | 26.0 | 10.2 | 19.6 Data table for Chart 4 Note * | 15.6 | 4.7 |
| 2021 | 31.3 Data table for Chart 4 Note * | 25.2 | 11.6Data table for Chart 4 Note ‡ | 16.9 Data table for Chart 4 Note * | 14.9 | 5.6Data table for Chart 4 Note ‡ |
| 2022 | 45.4 Data table for Chart 4 Note * | 34.5Data table for Chart 4 Note † | 16.6Data table for Chart 4 Note ‡ | 24.9 | 18.6Data table for Chart 4 Note † | 7.3Data table for Chart 4 Note ‡ |
| 2023 | 41.1 | 33.5Data table for Chart 4 Note † | 15.9Data table for Chart 4 Note ‡ | 21.8 Data table for Chart 4 Note * | 18.3Data table for Chart 4 Note † | 7.5Data table for Chart 4 Note ‡ |
| 2024 | 38.9 | 35.2Data table for Chart 4 Note † | 17.5Data table for Chart 4 Note ‡ | 18.5 Data table for Chart 4 Note * | 18.2Data table for Chart 4 Note † | 7.9Data table for Chart 4 Note ‡ |
Conclusion
Across several different indicators, this study shows that more Canadians are abstaining from drinking alcohol. Some people are choosing not to drink at all, while others are drinking alcohol less often. There are many possible explanations for this trend. It may reflect a change in attitudes and social norms around drinking, with greater awareness of the health effects of drinking and less social pressure to drink alcohol, especially for young
Although there were declines in heavy drinking among young adults during the pandemic, these do not appear to be sustained changes in behaviour among regular drinkers. As more post-pandemic data become available, it will be interesting to see whether new trends emerge.
Data sources, methods and definitions
The Canadian Community Health Survey (CCHS) collected data from people aged 12 years and older annually from 2015 to 2022. In 2023, the CCHS was changed to cover only adults aged 18 years and older, and the Canadian Health Survey on Children and Youth (CHSCY) collected annual health indicators for youth aged 12 to 17.
The CCHS and the CHSCY are nationally representative cross-sectional surveys that cover the Canadian household population of a specific year, excluding people living on reserves and other Indigenous settlements, full-time members of the Canadian Forces, institutionalized populations, and residents of certain remote regions.
From 2022 onwards, data were collected via an online questionnaire that was completed by the respondent or via a telephone interview. Prior to 2022, data were collected via in-person or telephone interviews.
For each year, survey and bootstrap weights were used to estimate percentages and their corresponding 95% confidence intervals for each measure of alcohol consumption. Z-tests were used to compare proportions in a given year relative to the baseline (2015). A two-tailed p-value below 0.05 was considered statistically significant.
In 2019, the CCHS and CHSCY began asking about both sex and gender. Sex refers to the sex assigned at birth, and gender refers to an individual’s personal and social identity. The analysis presented here was based on sex at birth. The terms “men” and “women” are used instead of “males” and “females” throughout this article for ease of reading.
References
Dunphy, Jessica, Emma Vieira, Abigail K. Stevely, Michael Livingston, Rakhi Vashishtha, Kirsten Rivelin and John Holmes. 2025. “Have declines in the prevalence of young adult drinking in English-speaking high-income countries followed declines in youth drinking? A systematic review.” Drugs: Education, Prevention and Policy. Vol. 32, no. 1, pp. 15-28.
Garriguet, Didier. 2021. “Chapter 1: Health of youth in Canada.” Portrait of Youth in Canada: Data Report. Statistics Canada Catalogue no. 42-28-0001.
Health Canada. 2024. Canadian Substance Use Survey (CSUS): Summary of Results for 2023. Controlled Substances and Overdose Response Directorate, Office of Drug Research and Surveillance.
Health Statistics Branch. 2023. “Health behaviours and substance use.” Health of Canadians. Statistics Canada Catalogue no. 82-570-X.
MacLean, Sarah J., Amy Pennay, Gabriel Caluzzi, John Holmes and Jukka Törönen. 2021. “Why are young people drinking less than their parents’ generation did?” The Conversation.
Mital, Shweta, Lisa Bishop, Shawn Bugden, Paul Grootendorst and Hai V. Nguyen. 2024. “Association between non-medical cannabis legalization and alcohol sales: Quasi-experimental evidence from Canada.” Drug and Alcohol Dependence. Vol. 257, no. 111137.
Paradis, Catherine, Peter Butt, Kevin Shield, Nancy Poole, Samantha Wells, Tim Naimi, Adam Sherk and the Low-Risk Alcohol Drinking Guidelines Scientific Expert Panels. 2023. Canada’s Guidance on Alcohol and Health: Final Report. Canadian Centre on Substance Use and Addiction.
Ru, Siyu and Yiyan Li. 2021. “Differences in substance use among immigrants and the Canadian-born population.” Canadian Studies in Population. Vol. 48, pp. 335-359.
Statistics Canada. 2023 (October 16). “Five years since legalization, what have we learned about cannabis in Canada?” The Daily.
Statistics Canada. 2024. “Immigration and ethnocultural.” Canada at a Glance, 2023. Statistics Canada Catalogue no. 12-581-X.
Statistics Canada. 2025. Table 11-10-0222-01 Household spending, Canada, regions and provinces. [Data table].
Vashishtha, Rakhi, Amy Pennay, Paul Dietze, Melvin B. Marzan, Robin Room and Michael Livingston. 2021. “Trends in adolescent drinking across 39 high-income countries: exploring the timing and magnitude of decline.” European Journal of Public Health. Vol. 31, no. 2, pp. 424-431.
World Health Organization. 2024. “Alcohol.”
- Date modified: