
Insights on Canadian Society
Results from the 2016 Census: Education and labour market integration of Black youth in Canada

Archived Content
Information identified as archived is provided for reference, research or recordkeeping purposes. It is not subject to the Government of Canada Web Standards and has not been altered or updated since it was archived. Please "contact us" to request a format other than those available.
by Martin Turcotte

Correction Notice
Corrections have been made to this product.
Please take note of the following changes:
May 19, 2022
In Table A1, the table headers that say “Black” and “Other” have been updated to be “Boys” and “Girls”
Skip to text
Text begins
Start of text box

Today, Insights on Canadian Society is releasing a study based on integrated data from the 2006 and 2016 censuses. This study examines the education and labour market integration outcomes of a cohort of Black Canadian youth and their counterparts in the rest of the population.
End of text box
Start of text box
Using integrated 2006 and 2016 census data, this study examines the education and labour market integration outcomes of a recent cohort of young Black Canadians. Specifically, this study examines the link between the characteristics of the youth and their families when they were living with their parents (in 2006), and their education and labour market outcomes 10 years later (in 2016).
- Black youth who were between the ages of 9 and 13 in 2006 were as likely as other Canadian youth to have a high school diploma in 2016 (approximately 90%).
- Young Black males and females aged 13 to 17 in 2006 were less likely than their counterparts in the rest of the population to have a postsecondary certificate, diploma or degree in 2016.
- The gap between postsecondary graduation rates for Black youth and other youth remained after accounting for differences in socioeconomic and family characteristics. Other factors not measured by the Census of Population could be the source of these differences.
- Young Black males were nearly twice as likely as other young males to be not in employment, education or training (NEET) in 2016. This gap decreased but remained significant after socioeconomic factors were taken into account. Conversely, there was no difference between young Black females and other young females, after factoring in family and socioeconomic characteristics.
- The discrimination experienced by the Black population could explain some of the results of the study. For example, in 2014, 13% of Black Canadians, compared to 6% of their non-Black counterparts, reported experiencing discrimination at work or in the context of a hiring process.
End of text box
Introduction
Earning a postsecondary degree is associated with a number of individual and social benefits. Individual benefits can include a wider range of labour market opportunities and better-paying jobs, better health and greater social participation. Social benefits include higher tax revenues, a positive impact on labour productivity and lower social spending—particularly because people with a higher level of education are healthier.Note For these reasons and many others, keeping students in school and encouraging them to pursue postsecondary education are priorities for many social and government stakeholders.
In recent years, both research and public policy have focused on the educational challenges faced by Black youth,Note largely because Black people in Canada—both immigrants and non-immigrants—have lower levels of educational attainment than the rest of the population on average.Note Furthermore, Black men and women are less likely than their counterparts in the rest of the population to have a bachelor’s degree or higher.Note These gaps between the Black population and the rest of the population are observed among immigrants and among people in the second generation, or the third generation or higher.Note
In addition to these less favourable educational outcomes, Black Canadian adults have higher unemployment rates and lower salaries.Note Over the past 15 years, the labour market outcomes of the Black population, particularly men, have remained less favourable than those of the rest of the population, even when isolating for the effects of different factors, such as education, age and immigrant status.Note
Many of these outcomes were derived from cross-sectional data, which do not track individuals over time or assess how family characteristics affect longer-term outcomes. This limitation can be addressed by using integrated data from the 2006 and 2016 censuses, which allows for the same group of children to be studied at two different points in time (see Data sources, methods and definitions). This study explores the education and labour market integration outcomes of a recent cohort of Black Canadian youth and their counterparts in the rest of the population as they transition from childhood or adolescence to adulthood.
The first part of this study looks at the high school, postsecondary and university completionNote rates in 2016 of a cohort of youth that were aged 9 to 17 in 2006. It examines the extent to which differences in educational outcomes between the Black population and the rest of the population in 2016 are caused by differences in the socioeconomic and family characteristics of Black children and other children when they were younger (i.e., 10 years earlier, in 2006).
The second part of this study examines the integration of this cohort of Black youth into the Canadian labour market, again taking into account their socioeconomic and family characteristics during childhood. In addition to variables related to their childhood socioeconomic situation, the highest level of education attained by the youth in 2016 is accounted for, as is their personal family situation in 2016. The two indicators used for integration into—or exclusion from—the labour market are the unemployment rate and the proportion of youth who were not employed and who had not attended school (not in employment, education or training, or “NEET”).
Black youth are as likely as other youth to have at least a high school diploma
Most Canadian youth graduate from high school, and many of them then pursue postsecondary education. However, youth who do not obtain a high school diploma often have difficulty with labour market integration and have higher unemployment rates and much lower employment income.Note
Among Canadian youth who were aged 9 to 13 in 2006, just over 9 in 10 had at least a high school diploma 10 years later. For both Black youth and other youth, women were more likely than men to have at least a high school diploma. However, there were no significant differences in high school completion rates between Black youth and the rest of the population (Chart 1).

Data table for Chart 1
| Type of diploma in 2016 | ||||||
|---|---|---|---|---|---|---|
| At least a high school diplomaData table Note 1 | Postsecondary certificate, diploma or degreeData table Note 2 | University degree (bachelor level or higher)Data table Note 2 | ||||
| Boys | Girls | Boys | Girls | Boys | Girls | |
| percent | ||||||
| Black | 89 | 95 | 51 | 69 | 17 | 34 |
| Other | 90 | 94 | 62 | 75 | 26 | 41 |
|
||||||
The situation was different for completion of a postsecondary certificate, diploma or degree, which includes a registered apprenticeship or other trades certificate or diploma; a college, CEGEP or other non-university certificate or diploma; or a university certificate, diploma or degree.
Black youth were less likely than other youth to attain a postsecondary qualification. For example, among Black boys aged 13 to 17 in 2006, approximately half (51%) had a postsecondary qualification in 2016 (when they were aged 23 to 27), compared with 62% of other boys.
Young Black women were more likely than young Black men to have completed postsecondary studies. However, they were less likely than other women in the same cohort to have a postsecondary certificate, diploma or degree in 2016. For example, 34% of Black girls aged 13 to 17 in 2006 had a university degree 10 years later, compared with 41% of other girls from the same cohort.
Accounting for socioeconomic differences does not reduce the gaps in educational outcomes between Black youth and other youth
The social and economic determinants of education outcomes are well documented in research on the general population. Determinants include parents’ level of education, level of income and wealth of family of origin, parents’ cultural and social capital, parental and personal educational aspirations and expectations, cognitive skills, interest in studies, sex, area of residence, special education needs, family structure, and immigrant status.Note
For most socioeconomic variables, Black youth were at a disadvantage compared with other youth. First, as shown in Table 1, fewer Black youth aged 9 to 17 in 2006 lived with a parent whose highest level of education was a university degree (23%, compared with 30% for other youth). Parents’ education is recognized as one of the most important determinants of children’s education outcomes.
| Black youth | Other youth | |
|---|---|---|
| percent | ||
| Place of birth | ||
| Canada | 82 | 92 |
| Other country | 18 | 8 |
| Parents’ place of birth | ||
| Canada | 11 | 71 |
| Other country | 89 | 29 |
| Parents’ highest level of education | ||
| No high school diploma | 8 | 7 |
| High school diploma | 15 | 17 |
| Postsecondary diploma below the bachelor level | 54 | 46 |
| Bachelor’s degree | 16 | 21 |
| Diploma or certificate above the bachelor level | 7 | 9 |
| Family income quintile | ||
| First (lowest) | 37 | 20 |
| Second | 22 | 20 |
| Third | 18 | 20 |
| Fourth | 13 | 20 |
| Fifth (highest) | 9 | 20 |
| At least one parent works full-time | ||
| No | 22 | 8 |
| Yes | 78 | 92 |
| Dwelling | ||
| Renter | 44 | 17 |
| Owner; value of dwelling less than $100,000 | 4 | 10 |
| Owner; value of dwelling between $100,000 and $250,000 | 23 | 35 |
| Owner; value of dwelling more than $250,000 | 29 | 37 |
| Family structure | ||
| Married couple | 50 | 73 |
| Common-law couple | 6 | 10 |
| Lone parent | 45 | 17 |
| Residential stability over the last five years | ||
| Moved | 48 | 34 |
| Did not move | 52 | 66 |
| Type of area of residence | ||
| Outside CMA and CA | 3 | 19 |
| Census agglomeration (CA) | 3 | 13 |
| Census metropolitan area (CMA) | 95 | 69 |
| Area of residence | ||
| Atlantic | 3 | 7 |
| Quebec | 23 | 25 |
| Ontario | 63 | 39 |
| Prairies | 3 | 7 |
| Alberta | 5 | 11 |
| British Columbia | 3 | 11 |
| Territories | 0.1 | 0.2 |
| English–French bilingualism | ||
| No | 77 | 80 |
| Yes | 23 | 20 |
| Age | ||
| 9 years | 12 | 11 |
| 10 years | 14 | 11 |
| 11 years | 13 | 12 |
| 12 years | 13 | 11 |
| 13 years | 11 | 11 |
| 14 years | 11 | 11 |
| 15 years | 9 | 11 |
| 16 years | 9 | 11 |
| 17 years | 9 | 10 |
| Sources: Statistics Canada, integrated 2006 and 2016 census data. | ||
The gaps were even more pronounced for other characteristics, as Black youth were more likely to live in economically disadvantaged families in 2006. In addition, they were approximately twice as likely as other youth to be in the bottom quintile of family income (37% vs. 20%). Black youth were also less likely than other youth to live in a dwelling owned by a household member (56% vs. 83%). Lastly, 45% of Black youth lived with only one parent in 2006, compared with 17% of other youth—a situation generally associated with more challenging socioeconomic conditions. For several decades, being a single parent has been proportionally higher among the Black immigrant and non-immigrant populations.Note
The majority of Black youth in this cohort were born in Canada (82%, compared with 92% of other youth). In contrast, a higher proportion of Black youth had an immigrant background, meaning that they had parents born outside Canada (89% versus 29% of other youth). This could be a positive factor because, in Canada, children with an immigrant background achieve, on average, a higher level of education than children with Canadian-born parents.Note Moreover, the majority of Black youth were living in metropolitan areas—where most postsecondary institutions are located—which could also be an advantage in terms of access to postsecondary education.Note
Accounting for socioeconomic variables and family origin variables had little or no impact on reducing gaps in postsecondary graduation rates between Black youth and other youth. For example, without considering the differences in composition between the two populations, 51% of young Black men aged 9 to 17 in 2006 had a postsecondary diploma or degree in 2016, while this figure was 62% among other young men (a difference of 11 percentage points). Isolating the effects of these factors resulted in an almost identical gap of 10 percentage points.Note
A similar scenario was seen for young women. Specifically, the adjusted probability of young Black women aged 13 to 17 in 2006 having a university degree was 0.33, compared with 0.41 for other young women. This gap of 8 percentage points was almost the same as the one observed initially (i.e., without isolating the effects of socioeconomic and family situations).
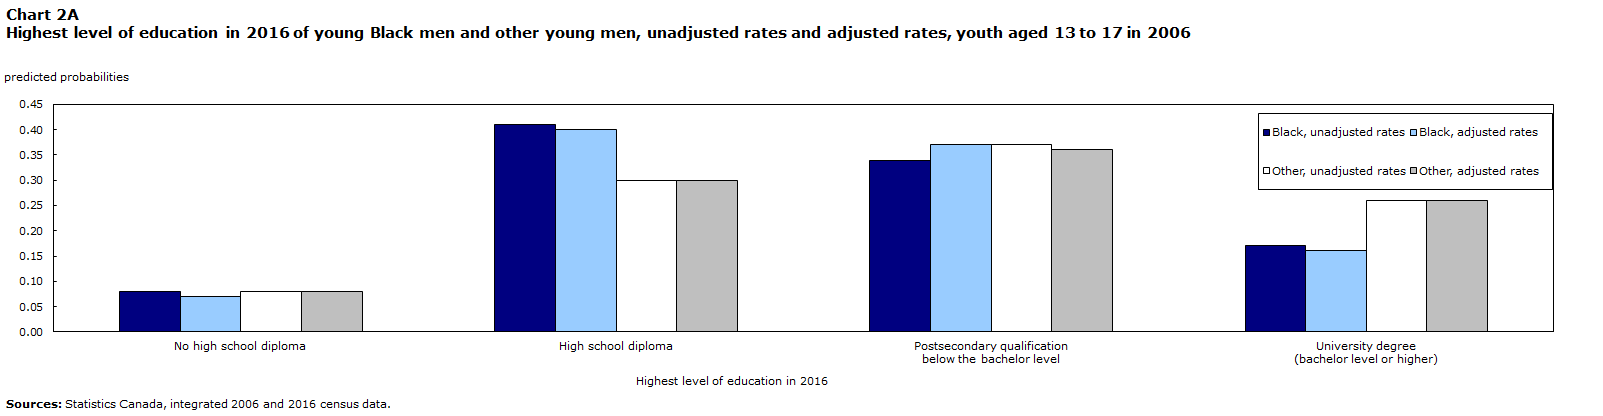
The entire distribution of all possible levels of education in 2016 provides another perspective on the differences in educational outcomes for Black youth and other youth. Charts 2A and 2B illustrate this distribution of highest level of education attained in 2016 by youth aged 13 to 17 in 2006 (after controlling for socioeconomic differences).Note Young Black men were most likely to have attained a high school diploma in 2016 (40%), whereas other young men were most likely to have attained a postsecondary diploma below the bachelor level (36%).
For young Black women aged 13 to 17 in 2006, the level of education they were most likely to have attained in 2016 was a postsecondary diploma below the bachelor level. For other young women, it was a bachelor’s degree or higher.
Data table for Chart 2A
| Highest level of education in 2016 | No high school diploma | High school diploma | Postsecondary qualification below the bachelor level |
University degree (bachelor level or higher) |
|---|---|---|---|---|
| predicted probabilities | ||||
| Black, unadjusted rates | 0.08 | 0.41 | 0.34 | 0.17 |
| Black, adjusted rates | 0.07 | 0.40 | 0.37 | 0.16 |
| Other, unadjusted rates | 0.08 | 0.30 | 0.37 | 0.26 |
| Other, adjusted rates | 0.08 | 0.30 | 0.36 | 0.26 |
| Sources: Statistics Canada, integrated 2006 and 2016 census data. | ||||

Data table for Chart 2B
| Highest level of education in 2016 | No high school diploma | High school diploma | Postsecondary qualification below the bachelor level |
University degree (bachelor level or higher) |
|---|---|---|---|---|
| predicted probabilities | ||||
| Black, unadjusted rates | 0.04 | 0.26 | 0.36 | 0.34 |
| Black, adjusted rates | 0.05 | 0.26 | 0.37 | 0.33 |
| Other, unadjusted rates | 0.05 | 0.20 | 0.34 | 0.41 |
| Other, adjusted rates | 0.05 | 0.20 | 0.34 | 0.41 |
| Sources: Statistics Canada, integrated 2006 and 2016 census data. | ||||
Black youth whose parents have a higher level of education have less favourable outcomes than other youth
In line with past research, parents’ highest level of education was, among the factors considered, the factor most strongly associated with education outcomes, in terms of both having at least a high school diploma and having a postsecondary certificate, diploma or degree.Note By comparison, family income level had a smaller impact, as did other factors such as home ownership, type of area of residence and family structure. In particular, living in a single-parent family was weakly associated with education outcomes, after controlling for other factors.
This section examines whether these factors had a different impact on the level of education among the Black population compared with the rest of the population. Socioeconomic advantages and disadvantages can have a different impact for men and women, and for certain racialized groups.Note
First, the gap in university graduation rates between men and women was larger among Black youth than among other youth. Young Black women were twice as likely as young Black men to have a university degree (34% and 17%, respectively). Among other youth, this ratio was slightly less pronounced, with women being 1.6 times more likely than men to have such a degree (Table 2).
Second, the gap between Black youth and other youth was larger among those who had highly educated parents. Among Black youth who had at least one parent with a university degree (bachelor’s degree or higher), 47% also held such a degree in 2016, compared with 57% of other youth.
In contrast, among youth whose parents had a lower level of educational attainment (high school diploma or less), Black youth were just as likely as other youth to have a university degree (17% vs. 18%).
Lastly, the association between parents’ place of birth and educational outcomes is different for Black youth than it is for other youth, particularly at the university level. In line with other studies,Note other youth with an immigrant background were more likely to have a university degree (44%) than other youth with Canadian-born parents (29%). However, this was not the case among Black youth. Black youth with Canadian-born parents were almost as likely as Black youth with an immigrant background to have a university degree.
| Type of diploma in 2016 | ||||||
|---|---|---|---|---|---|---|
| At least a high school diplomaTable 2 Note 1 | Postsecondary certificate, diploma or degreeTable 2 Note 2 | University degree (bachelor level or higher)Table 2 Note 2 | ||||
| Black | Other | Black | Other | Black | Other | |
| percent | ||||||
| Sex | ||||||
| Men | 89 | 90 | 51 | 62 | 17 | 26 |
| Women | 95 | 94 | 69 | 75 | 34 | 41 |
| Parents’ place of birth | ||||||
| Canada | 87 | 91 | 55 | 67 | 23 | 29 |
| Other countries | 92 | 96 | 62 | 73 | 26 | 44 |
| Parents’ highest level of education | ||||||
| High school diploma or less | 85 | 86 | 54 | 55 | 17 | 18 |
| Postsecondary diploma below the bachelor level | 92 | 92 | 58 | 68 | 21 | 27 |
| Bachelor’s degree or higher | 97 | 97 | 75 | 81 | 47 | 57 |
|
||||||
Other unmeasured factors are responsible for the gaps in education outcomes between Black youth and other youth
Despite a few nuances, it can be concluded that—regardless of the level of certificate, diploma or degree—Black youth have relatively less favourable outcomes in terms of postsecondary education. Furthermore, neutralizing different socioeconomic factors does not significantly affect the size of the gaps in outcomes between Black youth and other youth. These results suggest that, even if Black youth in this cohort had socioeconomic and family characteristics similar to those of other youth, their postsecondary graduation rates would have been lower on average. This suggests that other factors are associated with the relatively less favourable outcomes of Black youth.
According to several studies, two of the variables most strongly associated with the pursuit of and graduation from postsecondary education are the educational aspirations of parents and youth (the level of education one would like to achieve) and, especially, educational expectations (the level one expects to achieve).Note
Based on data from the General Social Survey, nearly all Black youth aged 15 to 25 said they wanted to achieve at least a bachelor’s degree (94%, compared with 82% of other youth in the same age group). In contrast, Black youth were less optimistic about the highest level of education they expected to achieve. Specifically, 60% of Black youth in the same age group expected to obtain a bachelor’s degree or higher, compared with 79% of other youth.
A number of studies conducted in the 2010s in the Toronto area indicate that Black youth are less optimistic about their chances of obtaining a university degree because of, among other things, certain school professionals’ and teachers’ attitudes and behaviours toward them.Note These studies suggest that some teachers and professionals may have—beginning in elementary school—more negative preconceptions and more limited expectations of the academic potential and skills of Black youth. For example, certain studies have shown that for a given group of students with similar academic abilities, the expectations of teachers are generally lower in the case of youth from ethnic minorities – especially Black students.Note As a result, Black youth may be more likely to enroll in “applied” or “essentials” programs in high school, even if it does not suit the students’ actual academic skills.Note This may limit access to university, may discourage Black youth who have the potential to pursue university studies from doing so, and may cause Black youth to lower their educational expectations.Note
In addition to these factors, some studies indicate that the fact that few teachers are from the Black population could also affect the outcomes of Black youth, as they have no role models with which to identify.Note According to the 2016 Census, of the 31,320 elementary and high school teachers in Canada at the time, 580 (1.8%) were Black. Meanwhile, Black workers made up 3.3% of workers in all other occupations in Canada (among people aged 25 to 64 who had a job at the time of the 2016 Census).
Even though the factors responsible for education outcomes continue to be the subject of research, discussion and debate, the fact remains that the lower postsecondary graduation rates of Black youth are real. These results can have many consequences, particularly more difficult integration into the labour market. The next section tackles this issue.
Labour market integration of Black youth
Even though some youth start to work at an earlier age than others, most make the school-to-work transition in their early or mid-20s. This section examines labour market indicators in 2016 for Canadian youth who were aged 13 to 17 in 2006 (i.e., those who had completed or were mostly on the verge of completing their education in 2016).
Given that more and more youth continue their education into and even beyond their 20s, certain indicators, such as the employment rate or salaries, are likely not the most appropriate measures for studying the labour market integration of youth. The unemployment rate and the proportion of people not in employment, education or training (NEET), in this regard, are more relevant. The unemployment rate expresses the proportion of people seeking employment as a proportion of the labour force. The NEET rate identifies the number of youth whose integration into society is at risk, as these youth are NEET at a crucial time in their working lives.Note For the purposes of this study, NEET youth refers to youth who did not have a job in the census reference week and who had not attended a recognized educational institution or program at any time in the past nine months (from September 2015 to May 10, 2016, Census Day) (See Data sources, methods and definitions).
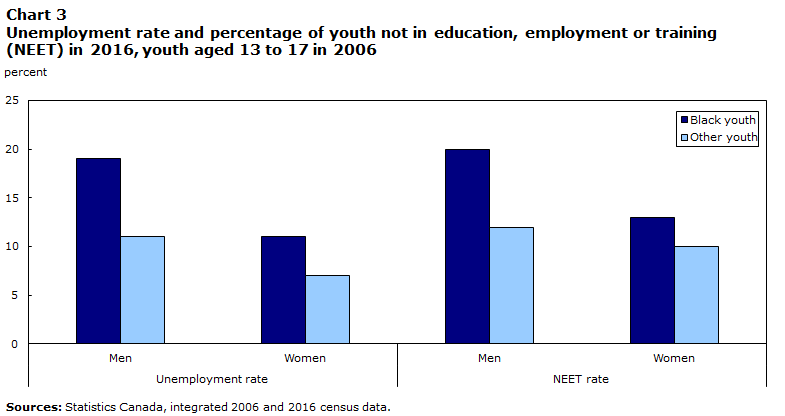
Among youth who were aged 13 to 17 in 2006, the unemployment rate in 2016—when they were aged 23 to 27—was higher for young Black people than it was for other youth (Chart 3). The gap was particularly pronounced for men—the unemployment rate of young Black men (19%) was nearly twice that of other young men (11%).
Data table for Chart 3
| Unemployment rate | NEET rate | |||
|---|---|---|---|---|
| Men | Women | Men | Women | |
| percent | ||||
| Black youth | 19 | 11 | 20 | 13 |
| Other youth | 11 | 7 | 12 | 10 |
| Sources: Statistics Canada, integrated 2006 and 2016 census data. | ||||
The NEET rate was even higher among young Black men: about 20%—or 1 in 5 men—were NEET in 2016, compared with 12% of other young men.
Among men, accounting for socioeconomic and family factors during childhood (in 2006), as well as highest level of education and family characteristics in 2016, reduced the initial gap between Black youth and other youth in terms of unemployment and NEET rates.Note When socioeconomic characteristics (including differences in educational attainment) were accounted for, young Black men aged 13 to 17 in 2006 remained at a higher risk of being unemployed in 2016 than other young men (probabilities of 0.16 and 0.11, respectively). This was the same for the proportion of those who were NEET: young Black men had an adjusted probability of 0.16 of being NEET in 2016, compared with 0.12 for other young men.
In contrast, among women, gaps in unemployment and NEET rates decreased and became statistically insignificant when the results were adjusted to account for differences in socioeconomic characteristics.
Level of education and situation of NEET Black youth
Among young men, the probability of being NEET was significantly higher for those without a high school diploma than for those with a university degree. This result is consistent with the findings of many other studies, which show that people without a high school diploma face significant difficulty in finding work and going back to school.Note
However, the association between highest level of education attained and labour market integration was different for young Black men compared with other young men. Among Black youth who did not have a high school diploma in 2016, 58% were NEET, compared with 33% of other youth (Chart 4A). In contrast, among highly educated men (i.e., men with a university degree), NEET rates were about the same for young Black men and other young men.

Data table for Chart 4A
| Highest level of education in 2016 | Young Black men | Other young men |
|---|---|---|
| percent | ||
| No high school diploma | 58 | 33 |
| High school diploma | 25 | 15 |
| Postsecondary qualification below the bachelor level | 11 | 8 |
| University degree (bachelor level or higher) | 6 | 6 |
| Sources: Statistics Canada, integrated 2006 and 2016 census data. | ||
Among women, there was also a significant association between education and the risk of being NEET. However, the differences between young Black women and other young women were not as large as they were for men, regardless of education level (Chart 4B).

Data table for Chart 4B
| Highest level of education in 2016 | Young Black women | Other young women |
|---|---|---|
| percent | ||
| No high school diploma | 46 | 40 |
| High school diploma | 20 | 18 |
| Postsecondary qualification below the bachelor level | 10 | 8 |
| University degree (bachelor level or higher) | 7 | 4 |
| Sources: Statistics Canada, integrated 2006 and 2016 census data. | ||
These results show the high risks of exclusion faced by youth without a high school diploma, particularly among young Black men. There could be many reasons why labour market integration is harder for young Black men than for other young men.
Common hypotheses include discrimination and racism at the time of hiring and in the workplace in general. In this regard, the results of the 2014 General Social Survey show that Black Canadians were about twice as likely as their non-Black counterparts to report that they had experienced discrimination or had been treated unfairly in the previous five years (28% and 13%, respectively). More specifically, 13% of Black Canadians, compared with 6% of their non-Black counterparts, reported that they had experienced discrimination at work or in a hiring process. That said, Black men were no more likely than Black women to report having experienced this kind of discrimination (in general or at work).
Other Canadian studies, conducted using fictional resumes, support these perceptions of discrimination experienced by the Black population. These studies showed, among other things, that racialized candidates with equivalent qualifications and experience were much less likely to be called for an interview.Note
Conclusion
There are many well-documented personal benefits to obtaining a postsecondary certificate, diploma or degree. This is why it is desirable that as many young people as possible continue their education after graduation from high school.
Among a cohort of youth aged 9 to 17 in 2006, there were no significant differences in the rates of Black youth and other youth having at least a high school diploma in 2016. However, persistent gaps remained in terms of postsecondary graduation, particularly at the university level. Some American studies have found that gaps between various ethnocultural groups decreased considerably when differences in socioeconomic profile were taken into account.Note However, the present study does not support the conclusion that the lower postsecondary graduation rates among Black youth compared with other youth are caused by differences in socioeconomic profile or family origin between these two groups. The persistent gaps between the Black population and the rest of the population suggest that other factors not measured by the data used, including discrimination, could have an effect.
Labour market integration is often difficult for young adults who do not have a high school diploma. It seems to be especially difficult for young Black men, who are more likely to be unemployed or NEET, even at equal levels of education. Other studies on the labour market integration of young Black men could explore non-socioeconomic (family origin) factors, or factors related to human capital, to shed some light on why so many of these young men are excluded from the labour market as they begin their working lives.
Martin Turcotte is editor-in-chief of Insights on Canadian Society, and is based at the Centre for Social Data Integration and Innovation at Statistics Canada.
Start of text box
This study uses integrated 2006 and 2016 census data. This data integration includes respondent responses from both the 2006 and 2016 Census of Population long-form questionnaires, making it possible to track changes in these respondents’ characteristics over 10 years.
An advantage of using integrated census data—rather than standard cross-sectional census data—to analyze youth’s pathways is that the integrated data make it possible to account for the socioeconomic and family characteristics of these youth during their childhood and adolescence when they were living with their parents (in 2006).
Black people in Canada have diverse backgrounds and experiences. Some can trace their roots in Canada back many generations, and others immigrated in recent decades.Note However, in this study, the majority of children and youth were born in Canada (82% of Black youth and 92% of other youth). All other youth in the study sample were admitted to the country before the age of 15 (generation 1.5). Including or excluding children from generation 1.5 does not affect the findings of this study in terms of the gaps in outcomes between Black youth and other youth.
Given that the majority of children and adolescents aged 9 to 17 lived with their parents in 2006 (98% of the sample), those who did not were excluded from the analysis. Youth aged 18 or older in 2006 were excluded because, as of this age, a higher proportion no longer live with their parents (making it impossible to take into account family context variables). Children younger than age 9 in 2006 were excluded because most of them had not reached the minimum age of high school graduation in 2016.
The subsample from the integrated 2006 and 2016 census data used for this study comprised 122,810 respondents aged 5 to 17 in 2006 (aged 15 to 27 in 2016). Given the relatively small size of the Black population, the data could not be disaggregated by region of origin (Canada, Caribbean and Latin America, Africa) or by generation status. However, parents’ place of birth is taken into account in multivariate analysis.
The “adjusted rates” or “adjusted probabilities” in this study correspond to the predicted probabilities calculated using multivariate models (logistic regressions and multinomial logistic regressions). In the tables, the predicted probabilities reflect the average of the predicted rates for a given group. This corresponds to the default option of the “margins”command in Stata.
Black youth and other youth
In this study, Black youth are those who self-reported as Black in the population group (or visible minority group) question in the Census of Population. “Other youth” includes those who reported that they did not belong to a visible minority group (85% of them), and those who self-reported as belonging to another visible minority group.
There was some heterogeneity among “other youth,” with educational outcomes varying by visible minority group. For example, among males aged 13 to 17 in 2006, 49% of those who were South Asian and 60% of those who were Chinese had completed a university degree in 2016 (Appendix Table A1). In contrast, 15% of those who were Latin American and 23% of those who did not belong to a visible minority group had completed such a degree. The main findings of this study were unchanged when the results of “other youth” were disaggregated into visible minority groups.
Not in employment, education or training (NEET indicator)
In Canada, the NEET population typically includes youth who, during a given reference week, were not working and were not attending school. The size of this population is usually estimated using data from surveys such as the Labour Force SurveyNote or the Canadian Community Health Survey.Note
In this study, the NEET rate is defined as the proportion of youth who were not in employment during the census reference week (May 1 to May 7, 2016) and who had not attended any accredited educational institution or program in the eight months preceding the census reference week(between September 2015 and May 2016).
End of text box
| Type of diploma in 2016 | ||||||
|---|---|---|---|---|---|---|
| At least a high school diplomaTable A1 Note 1 | Postsecondary certificate, diploma or degreeTable A1 Note 2 | University degree (bachelor level or higher)Table A1 Note 2 | ||||
| Boys | Girls | Boys | Girls | Boys | Girls | |
| percent | ||||||
| Visible minority group | ||||||
| Black | 89 | 95 | 51 | 69 | 17 | 34 |
| Not a visible minority | 89 | 93 | 61 | 74 | 23 | 38 |
| South Asian | 98 | 98 | 72 | 79 | 49 | 58 |
| Chinese | 98 | 99 | 80 | 87 | 60 | 73 |
| Filipino | 96 | 99 | 66 | 84 | 23 | 45 |
| Latin American | 89 | 93 | 54 | 64 | 15 | 24 |
| West Asian/Arab | 95 | 98 | 71 | 81 | 37 | 57 |
| Southeast Asian | 97 | 97 | 63 | 85 | 30 | 47 |
| Other groupsTable A1 Note 3 | 95 | 96 | 67 | 78 | 38 | 52 |
|
||||||
| Type of diploma in 2016 | ||||||
|---|---|---|---|---|---|---|
| At least a high school diplomaTable A2 Note 1 | Postsecondary certificate, diploma or degreeTable A2 Note 2 | University degree (bachelor level or higher)Table A2 Note 2 | ||||
| Boys | Girls | Boys | Girls | Boys | Girls | |
| predicted probability | ||||||
| Population group | ||||||
| Black youth | 0.893 | 0.948 | 0.523Note * | 0.695Note * | 0.159Note * | 0.326Note * |
| Other youth (reference category) | 0.904 | 0.941 | 0.622 | 0.749 | 0.257 | 0.409 |
| Parents’ place of birth | ||||||
| Canada (reference category) | 0.891 | 0.932 | 0.600 | 0.730 | 0.227 | 0.376 |
| Other countries | 0.935Note * | 0.966Note * | 0.665Note * | 0.786Note * | 0.313Note * | 0.477Note * |
| Parents’ highest level of education | ||||||
| No high school (reference category) | 0.820 | 0.878 | 0.446 | 0.602 | 0.116 | 0.206 |
| High school diploma | 0.881Note * | 0.932Note * | 0.534Note * | 0.701Note * | 0.164Note * | 0.305Note * |
| Postsecondary diploma below the bachelor level | 0.905Note * | 0.944Note * | 0.614Note * | 0.747Note * | 0.201Note * | 0.365Note * |
| Bachelor’s degree | 0.946Note * | 0.974Note * | 0.724Note * | 0.830Note * | 0.387Note * | 0.566Note * |
| Certificate, diploma or degree above the bachelor level | 0.958Note * | 0.969Note * | 0.748Note * | 0.833Note * | 0.450Note * | 0.622Note * |
| Family income quintile in 2006 | ||||||
| First (reference category) | 0.878 | 0.918 | 0.577 | 0.703 | 0.225 | 0.357 |
| Second | 0.898Note * | 0.937Note * | 0.590 | 0.716 | 0.233 | 0.370 |
| Third | 0.910Note * | 0.950Note * | 0.621Note * | 0.745Note * | 0.243 | 0.381Note * |
| Fourth | 0.923Note * | 0.963Note * | 0.633Note * | 0.775Note * | 0.250 | 0.428Note * |
| Fifth | 0.940Note * | 0.968Note * | 0.677Note * | 0.810Note * | 0.302Note * | 0.481Note * |
| At least one parent works full-time in 2006 | ||||||
| No (reference category) | 0.902 | 0.932 | 0.599 | 0.728 | 0.273 | 0.393 |
| Yes | 0.903 | 0.943Note * | 0.622 | 0.750 | 0.254 | 0.408 |
| Dwelling in 2006 | ||||||
| Renter (reference category) | 0.863 | 0.916 | 0.545 | 0.679 | 0.191 | 0.336 |
| Owner; value of dwelling less than $100,000 | 0.898Note * | 0.935Note * | 0.607Note * | 0.737Note * | 0.210 | 0.357 |
| Owner; value of dwelling between $100,000 and $250,000 | 0.918Note * | 0.950Note * | 0.620Note * | 0.747Note * | 0.238Note * | 0.390Note * |
| Owner; value of dwelling more than $250,000 | 0.929Note * | 0.962Note * | 0.658Note * | 0.790Note * | 0.299Note * | 0.463Note * |
| Family structure in 2006 | ||||||
| Married couple | 0.916Note * | 0.946 | 0.630Note * | 0.758Note * | 0.261Note * | 0.418Note * |
| Common-law couple | 0.880Note * | 0.921Note * | 0.561Note * | 0.681Note * | 0.209Note * | 0.336Note * |
| Lone parent (reference category) | 0.887 | 0.943 | 0.605 | 0.741 | 0.243 | 0.389 |
| Residential stability over the previous five years | ||||||
| Moved (reference category) | 0.893 | 0.937 | 0.588 | 0.719 | 0.236 | 0.370 |
| Did not move | 0.911Note * | 0.944Note * | 0.634Note * | 0.761Note * | 0.263Note * | 0.423Note * |
| Type of area of residence | ||||||
| Outside CMA and CA (reference category) | 0.894 | 0.946 | 0.628 | 0.762 | 0.215 | 0.392 |
| Census agglomeration (CA) | 0.899 | 0.933Note * | 0.618 | 0.739Note * | 0.244Note * | 0.398Note * |
| Census metropolitan area (CMA) | 0.908Note * | 0.941 | 0.617 | 0.745 | 0.265Note * | 0.412Note * |
| Area of residence | ||||||
| Atlantic | 0.946Note * | 0.965Note * | 0.631 | 0.762 | 0.290 | 0.458 |
| Quebec | 0.865Note * | 0.925Note * | 0.728Note * | 0.814Note * | 0.210Note * | 0.370Note * |
| Ontario (reference category) | 0.914 | 0.948 | 0.612 | 0.759 | 0.280 | 0.438 |
| Prairies | 0.912 | 0.949 | 0.502Note * | 0.668Note * | 0.272 | 0.433 |
| Alberta | 0.905Note * | 0.927Note * | 0.548Note * | 0.668Note * | 0.248Note * | 0.375Note * |
| British Columbia | 0.928 | 0.956 | 0.533Note * | 0.662Note * | 0.239Note * | 0.359Note * |
| Territories | 0.801Note * | 0.814Note * | 0.411Note * | 0.645Note * | 0.130Note * | 0.380 |
| English–French bilingualism | ||||||
| No (reference category) | 0.899 | 0.937 | 0.609 | 0.734 | 0.233 | 0.377 |
| Yes | 0.934Note * | 0.966Note * | 0.667Note * | 0.794Note * | 0.336Note * | 0.492Note * |
| Age in 2006 | ||||||
| 9 years | 0.880Note * | 0.921Note * | Note ...: not applicable | Note ...: not applicable | Note ...: not applicable | Note ...: not applicable |
| 10 years | 0.899Note * | 0.940 | Note ...: not applicable | Note ...: not applicable | Note ...: not applicable | Note ...: not applicable |
| 11 years | 0.906 | 0.948 | Note ...: not applicable | Note ...: not applicable | Note ...: not applicable | Note ...: not applicable |
| 12 years | 0.916 | 0.951 | Note ...: not applicable | Note ...: not applicable | Note ...: not applicable | Note ...: not applicable |
| 13 years (reference category) | 0.915 | 0.946 | 0.541 | 0.682 | 0.210 | 0.353 |
| 14 years | Note ...: not applicable | Note ...: not applicable | 0.608Note * | 0.730Note * | 0.244Note * | 0.396Note * |
| 15 years | Note ...: not applicable | Note ...: not applicable | 0.631Note * | 0.769Note * | 0.263Note * | 0.421Note * |
| 16 years | Note ...: not applicable | Note ...: not applicable | 0.656Note * | 0.779Note * | 0.279Note * | 0.436Note * |
| 17 years | Note ...: not applicable | Note ...: not applicable | 0.670Note * | 0.783Note * | 0.284Note * | 0.433Note * |
... not applicable
Sources: Statistics Canada, integrated 2006 and 2016 census data. |
||||||
| Unemployed in 2016 | NEET in 2016 | |||
|---|---|---|---|---|
| Men | Women | Men | Women | |
| predicted probability | ||||
| Population group | ||||
| Black youth | 0.162Note * | 0.093 | 0.158Note * | 0.117 |
| Other youth (reference category) | 0.109 | 0.071 | 0.117 | 0.101 |
| Parents’ place of birth | ||||
| Canada (reference category) | 0.107 | 0.069 | 0.116 | 0.100 |
| Other countries | 0.119 | 0.076 | 0.125 | 0.106 |
| Highest level of education in 2016 | ||||
| Less than high school (reference category) | 0.178 | 0.107 | 0.322 | 0.306 |
| High school diploma | 0.126Note * | 0.095 | 0.151Note * | 0.154Note * |
| Postsecondary diploma below the bachelor level | 0.097Note * | 0.064Note * | 0.085Note * | 0.083Note * |
| Bachelor’s degree or higher | 0.092Note * | 0.062Note * | 0.057Note * | 0.052Note * |
| Personal family situation in 2016 | ||||
| Without children (reference category) | 0.112 | 0.064 | 0.120 | 0.073 |
| Couple parents (married or common-law) | 0.085Note * | 0.108Note * | 0.089Note * | 0.246Note * |
| Lone parent | 0.168 | 0.167Note * | 0.199 | 0.200Note * |
| Parents’ highest level of education in 2006 | ||||
| No high school (reference category) | 0.104 | 0.069 | 0.124 | 0.119 |
| High school diploma | 0.100 | 0.067 | 0.113 | 0.102Note * |
| Postsecondary diploma below the bachelor level | 0.107 | 0.063 | 0.116 | 0.096Note * |
| Bachelor’s degree | 0.122 | 0.085 | 0.127 | 0.100Note * |
| Diploma or certificate above the bachelor level | 0.131Note * | 0.105Note * | 0.122 | 0.118 |
| Family income quintile in 2006 | ||||
| First (reference category) | 0.121 | 0.088 | 0.131 | 0.124 |
| Second | 0.115 | 0.072Note * | 0.119 | 0.100Note * |
| Third | 0.112 | 0.069Note * | 0.124 | 0.095Note * |
| Fourth | 0.094Note * | 0.064Note * | 0.110 | 0.096Note * |
| Fifth | 0.111 | 0.064Note * | 0.103Note * | 0.089Note * |
| At least one parent works full-time in 2006 | ||||
| No (reference category) | 0.118 | 0.071 | 0.142 | 0.103 |
| Yes | 0.110 | 0.071 | 0.115Note * | 0.102 |
| Dwelling in 2006 | ||||
| Renter (reference category) | 0.114 | 0.081 | 0.129 | 0.111 |
| Owner; value of dwelling less than $100,000 | 0.132 | 0.070 | 0.141 | 0.099 |
| Owner; value of dwelling between $100,000 and $250,000 | 0.109 | 0.068Note * | 0.113Note * | 0.097Note * |
| Owner; value of dwelling more than $250,000 | 0.102 | 0.070 | 0.109Note * | 0.101 |
| Family structure in 2006 | ||||
| Married couple | 0.107Note * | 0.072 | 0.113Note * | 0.103 |
| Common-law couple | 0.110Note * | 0.071 | 0.130 | 0.104 |
| Lone parent (reference category) | 0.124 | 0.070 | 0.128 | 0.097 |
| Area of residence in 2016 | ||||
| Atlantic | 0.169Note * | 0.105Note * | 0.168Note * | 0.129 |
| Quebec | 0.094Note * | 0.052Note * | 0.096Note * | 0.066Note * |
| Ontario (reference category) | 0.106 | 0.080 | 0.127 | 0.121 |
| Prairies | 0.100 | 0.061Note * | 0.098Note * | 0.098Note * |
| Alberta | 0.141 | 0.077 | 0.125 | 0.112 |
| British Columbia | 0.102Note * | 0.060Note * | 0.119 | 0.098Note * |
| Territories | 0.129 | 0.106 | 0.125 | 0.120 |
| Age in 2006 | ||||
| 13 years (reference category) | 0.140 | 0.089 | 0.108 | 0.097 |
| 14 years | 0.120Note * | 0.087Note * | 0.119 | 0.107 |
| 15 years | 0.108Note * | 0.067Note * | 0.127Note * | 0.101 |
| 16 years | 0.093Note * | 0.054Note * | 0.123Note * | 0.098 |
| 17 years | 0.088Note * | 0.058Note * | 0.115 | 0.107 |
Sources: Statistics Canada, integrated 2006 and 2016 census data. |
||||
- Date modified: