Section 4 Compensation practices

Archived Content
Information identified as archived is provided for reference, research or recordkeeping purposes. It is not subject to the Government of Canada Web Standards and has not been altered or updated since it was archived. Please "contact us" to request a format other than those available.
This section explores the compensation mix workplaces used to create an environment that leads to improved performance and labour productivity discussed in previous section. It focuses on direct pay, indirect pay or non-wage benefits and performance pay. The variety and extent of these non-wage benefits are examined from both the employer and the employee perspectives.
4.1 Earnings
The workplace characteristics considered are presence or absence of a collective bargaining agreement for employees in non-managerial occupations, presence or absence of non-wage benefits and presence or absence of performance pay. (Table 4.1)
The average hourly earnings of employees working in organizations with collective bargaining agreement coverage were consistently higher than those of their counterparts working in workplaces without collective bargaining agreement coverage, indicating, at first glance, a wage premium associated with the presence of a collective bargaining agreement1. When workplace size was considered, the wage gap associated with collective bargaining agreement coverage at times narrowed, vanished and even reversed with the absence of a collective bargaining agreement.
Workers average hourly earnings were higher in workplaces that provided non-wage benefits, regardless of sex, age, educational attainment, occupation, industry, workplace size or region. Similarly, earnings were also higher in workplaces where performance pay was present.
Workers who were female or young or working part-time or working in marketing and sales occupation had the lowest average hourly earnings; whereas those who were male or older or working full-time or working in managerial and professional occupations had the highest, regardless of collective bargaining agreement coverage, non-wage benefits coverage and presence of performance pay.
Chart 4.1
Total average hourly earnings by union coverage and workplace size, 2005
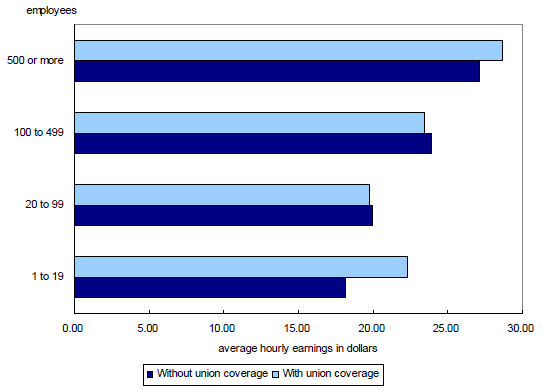
Source: Statistics Canada, Workplace and Employee Survey, Workplace and Employee components.
Now we turn back to job mobility with a view to uncovering whether there was a reward or some return to job mobility. Overall, workers who changed jobs or workplaces fared better than their counterparts who did not. (Tables 4.2.1, 4.2.2 and 4.2.3)
Workers who stayed with their employers and in the same job had a smaller increase in hourly earnings compared to those who changed jobs while remaining with the same employer, or changed employers.
There was indeed a wage premium associated with job mobility. This was true for both intra-workplace and inter-workplace job mobility.
Mobility was not always rewarded. In a few cases, notably in the 2001 to 2002 employee panel, workers in capital-intensive tertiary manufacturing industry who changed workplaces experienced a drop in their average hourly earnings.
Chart 4.2
Hourly earnings indices and job mobility in the 1999 to 2000, 2001 to 2002 and 2003 to 2004 employee panels

Source: Statistics Canada, Workplace and Employee Survey, Workplace and Employee components.
4.2 Non-wage benefits
WES also provides data on the availability of non-wage benefits. (Table 4.3)
Health-related benefits remained the most prevalent non-wage benefit offered to all employees by employers (40.0%). This was true for all industries and all workplace sizes.
The incidence of both health-related and pension benefits was higher in workplaces with collective bargaining agreement coverage than in those without collective bargaining agreement coverage, except for workplaces with 100 to 499 employees where the incidence of health benefits was virtually identical with and without collective bargaining agreement coverage.
Overall, as workplace size increased, the incidence of both these benefits also increased. Workplaces in finance and insurance industry were most likely to offer health-related and pension benefits whereas those in retail trade and consumer services industries were least likely to offer such benefits. Workplaces in labour intensive tertiary manufacturing industry were least likely to offer pension benefits.
Chart 4.3
Incidence of health-related and pension benefits, by workplace size, 2005

Source: Statistics Canada, Workplace and Employee Survey, Workplace and Employee components.
Non-wage benefits were widespread in 2005, with almost three-quarters of workers having access to them (Table 4.4). The most prevalent were health-related benefits: life and disability insurance plans, dental plans and supplemental medical insurance plans.
Women, young workers and those with less than high school education were less likely to have access to benefits. Looking at occupation, marketing and sales employees were by far the least likely to receive nonwage benefits (4 in 10), whereas professional workers had the highest rate of coverage (9 in 10)
Working in a unionized job or in one that is covered by a collective bargaining agreement also increased the likelihood of receiving non-wage benefits (88.5%, compared with 68.6% for non-unionized jobs). Being a full-time worker increased access to non-wage benefits (about three-quarters compared with almost half for part-time workers). As earnings increased, so did the likelihood of receiving non-wage benefits.
In the retail trade and consumer services industries, where labour turnover is high (about 6 in 10 workers were either hired or left), half of workers did not have access to non-wage benefits. In finance and insurance, however, where labour turnover is about two-fifths that of the retail trade and consumer services industries, less than 10.0% of workers did not have access to non-wage benefits.
Whereas about 1 in 2 workers in small workplaces (1 to 19 employees) did not have non-wage benefits, around 94.0% of workers had access to these benefits in large workplaces (500 employees or more).
Chart 4.4
Employees' non-wage benefits by total hourly wage group, 2005

Source: Statistics Canada, Workplace and Employee Survey, Workplace and Employee components.
4.3 Performance pay
Performance pay is used in many profit-oriented workplaces as part of their compensation mix. In 2005, individual incentive systems were the most common form of performance pay systems (24.0%). Stock purchase plans were the least common (3.5%). (Table 4.5)
Individual incentive systems (systems that reward individuals on the basis of individual output or performance) were more prevalent in workplaces where there was no union coverage. As workplace size increased, so did the incidence of profit-sharing plans.
Workplaces in the finance and insurance industry had the highest incidence of all types of performance pay.
In 2005, 36.9% of workplaces offered some type of performance-related pay to their employees, down from 40.1% in 1999.
Chart 4.5
Performance pay providers by workplace size, 2005

Source: Statistics Canada, Workplace and Employee Survey, Workplace and Employee components.
Participation in stock purchase plans decreased from 10.0% in 1999 to 7.0% in 2005. (Table 4.6)
Female workers' participation in these plans was consistently lower than that of their male counterparts. Young workers had the lowest rate of participation in stock purchase plans. Participation in stock purchase plans was highest for university graduates and workers in the managerial and professional occupations.
Both full- and part-time workers had access to stock purchase plans. Full-time workers were more likely to participate in stock purchase plans than their part-time counterparts (7.0% versus 1.0%). As workplace size increased, the likelihood of participating in stock purchase plans also increased.
Chart 4.6
Employees' participation in stock purchase plans by occupation groups, 1999, 2001, 2003 and 2005

Source: Statistics Canada, Workplace and Employee Survey, Workplace and Employee components.
____________
1. These results are consistent with earlier findings by Akyampong, Ernest B. 2002. "Unionization and fringe benefits." Perspectives on Labour and Income, (Statistics Canada Catalogue no. 75-001-X) 3, no. 8, (Autumn): 5-9.
- Date modified: