
The promise and challenge of pushing respondents to the Web in mixed-mode surveys
Section 4. Development and testing of web-push mixed-mode data collection
In the first decade of the 21st century, the idea of using multiple survey modes to contact individuals and obtain survey responses seemed to be an issue whose time for serious in-depth exploration had arrived (e.g., Tourangeau 2017; de Leeuw, Villar, Suzer-Gurtekin and Hox 2017). In addition, the same information technologies that brought on the internet carried with it the potential for managing the simultaneous use of multiple modes of data collection effectively as well as efficiently, thus removing the primary practical barrier to conducting mixed-mode surveys.
The effective development of web-push methods meant addressing multiple issues all at once in order to learn whether such an approach would be effective. These issues ranged from responding to household coverage problems and developing an understanding of how visual communication differed from aural communication, as well as expanding our theoretical thinking about what influences people to respond to survey requests.
A major, unanswered question was whether self-administration could replace human interviewing, and would the results be better or worse. A confounding challenge was that survey modes varied significantly in individual coverage, response rates, and bias in how people responded to the use of them, with each survey mode perhaps being better in some situations and worse in others.
4.1 U.S. Postal Service residential address lists now provide excellent household coverage
Because the U.S. Postal Service makes available, through vendors, complete residential address lists, it is possible to send mail requests to nearly all residences in the United States (Harter, Battaglia, Buskirk, Dillman, English, Mansour, Frankel, Kennel, McMichael, McPhee, Montaquila, Yancey and Zukerberg 2016). These computerized residential lists are provided without names, just as RDD telephone lists do not have names. The lack of names is not a barrier to obtaining response from households, as shown by a series of response rate studies using U.S. Decennial Census address lists (Dillman 2000, Chapter 9). In addition it does not direct a mailing to only one person in households whose occupants are now less connected to one another than when marriage rates were higher. It may also allow more accurate respondent selection by not having to overcome the limitations of mailings being associated with just one household member.
One of the first large-scale studies to evaluate the use of address-based sample (ABS) with postal data collection was by Link, Battaglia, Frankel, Osborn and Mokdad (2008). It found for a 2005 Behavior Risk Factor Surveillance System (BRFSS) questionnaire that a mail questionnaire sent to an ABS sample obtained significantly higher response rates than those obtained by RDD in five of the six states surveyed. The authors concluded with appropriate caution that the true potential of ABS might be in facilitating mixed-mode surveys that also involved telephone follow-up, and provided a strong recommendation for further study.
Other research at this time showed that ABS samples had very high coverage which was improving as city-style addresses were replacing less specific addresses, such as rural routes (O’Muircheartaigh, English and Eckman 2007; Battaglia, Link, Frankel, Osborn and Mokdad 2008). In addition, a series of studies showed that a two-step ABS mail survey (screening of households for the presence of school children, followed by a detailed questionnaire on a particular child) produced better results than a two-step RDD approach, with significantly higher response rates (Brick, Williams and Montaquila 2011; Williams, Brick, Montaquila and Han 2014).
These studies contributed significantly to establishing the high coverage qualities of address-based sampling as an alternative to RDD sampling. However, they stopped short of testing the possibility that the contacted households could be persuaded to respond by web to mailed requests.
4.2 Identifying and overcoming measurement differences between visual and aural surveys
A quite different concern that limited interest in address-based sampling with paper and/or Internet questionnaires was that people’s answers to questions were likely to be different from telephone responses. There were two aspects to this concern. The first was that without an interviewer, respondents could not be given extra encouragement when they were unable or reluctant to answer a question, nor could misunderstandings of questions be corrected. The second was the long-standing evidence that social desirability and the tendency to agree (acquiescence) were greater for telephone than self-administered (mail) survey responses (de Leeuw 1992). Traditionally, the benefit of having an interviewer present was viewed as outweighing the potential bias from the latter.
A survey sponsored by the Gallup Organization in 1999 provided a new perspective on these differences. This test revealed that asking people to respond in an interview to aurally received stimuli (either by voice telephone or Interactive Voice Response) produced similarly more positive answers than those given to visually delivered stimuli, either by mail or Internet questionnaire (Dillman 2002; Dillman, Phelps, Tortora, Swift, Kohrell, Berck and Messer 2009).
Discoveries in how visual information is processed reported by Palmer (1999), Hoffman (2004) and Ware (2004), provided theoretical insights into the separate actions taking place as the eye takes in the information and the brain processes it to make sense of what is on the page or screen. Application of these concepts provided an understanding of the reasons that self-administered questionnaires often produced different answers than interview surveys, as revealed by the Gallup study. Respondents are guided through visual questionnaires by multiple languages that communicate meaning. They include symbols, numbers and their graphical composition (size, spacing, color, symmetry, regularity, etc.) that affect how information on paper and web pages is navigated, mentally grouped and interpreted (Dillman 2007, pages 462-497; Tourangeau, Couper and Conrad 2004). Additional research showed that compliance with branching instructions could be improved dramatically through changes in symbols, font size, font brightness (Redline and Dillman 2002; Christian and Dillman 2004), and the placement of those branching instructions in relation to answer choices (Redline, Dillman, Dajani and Scaggs 2003; Dillman, Gertseva and Mahon-Haft 2005).
Another major cause of measurement differences across modes became apparent: questions were often worded differently for each mode and presented using different structures (Dillman and Christian 2005). For example, researchers had a long tradition of asking forced choice questions individually on telephone surveys when surveying people’s opinions on a list of items, but they often converted it to a check-all reply format for items presented as a group on mail questionnaires (Smyth, Dillman, Christian and Stern 2006). This practice was carried over to web surveys. New research showed that using forced-choice formats on both visual and aural modes would bring respondent answers much closer together (Smyth, Dillman, Christian and McBride 2009). Research also showed that open-ended questions to mail and web surveys would be comparable if similar visual construction was used for both mail and web (Smyth, Christian and Dillman 2008). In addition, it was learned that variations in scalar question formats (e.g., fully labeled vs. polar point labeled) produced dramatic differences in answers within visual modes (Christian, Parsons and Dillman 2009).
Unified mode construction the use of the same wording and visual layout of survey questions was proposed as a way of removing measurement differences across these modes (Dillman 2000). Unified construction could easily be accomplished for many types of questions (e.g., to present “don’t know” categories to all respondents instead of only those who would not choose an offered answer choice), as typically done by telephone interviewers. However, in other instances construction that differed across modes was both practical and would reduce errors, e.g., automatic branching to the next appropriate question on web and telephone. This form of presentation cannot be accomplished with branching items for paper questionnaires where all options have to be printed because of not being able to anticipate how people will answer those items.
The major contribution of unified mode construction has been to reduce concern about measurement differences being encouraged by multiple modes of survey response. An exception is that strong evidence exists that telephone response to opinion scales using vague quantifiers are consistently more likely to produce extreme responses on the positive end of the scale and less use of intermediate categories, than are web and mail questionnaires (Christian, Dillman and Smyth 2008). The apparent reason for this difference is that the visual presentation of intermediate response categories is more visible, and therefore accessible to respondents than when those same categories are read over the phone, a process that makes the end categories more prominent in respondent minds, Dillman and Edwards (2016).
Another difference that unified mode construction does not resolve is how people answer socially desirable questions. However, self-administered (visual) questionnaires are generally thought to produce more honest answers.
The accumulation of research on visual vs. aural design issues has provided survey designers with crucial tools, the use of which partly eliminates measurement differences that might undermine coverage and response benefits of mixed-mode surveys. The practice of unified mode design was crucial for initial development and testing of the web-push methodology described below.
4.3 The sequential development of an effective web-push methodology
A sequence of ten tests of web-push data collection procedures was conducted by a team of researchers at Washington State University between 2007 and 2012 in five separate data collections. The plan that guided these experiments was to build upon what was learned from the initial tests to design and implement the later tests. All experimental comparisons used the equivalent of 12 page paper questionnaires, containing 50-70 numbered questions, requesting 90-140 potential answers. They were designed to be the equivalent of 20-30 minute interview questionnaires. The studies were on a variety of topics community involvement and satisfaction, use of information technologies, economic and social effects of the 2008 recession, energy use attitudes, and understanding water quality and management. Researchers varied the topics in order to reduce concerns about the effect of topic on response rates and data quality.
The populations surveyed ranged from a rural region of Idaho and Washington and statewide surveys of Washington, Pennsylvania, and Alabama conducted from Washington State University, to surveys of Nebraska and Washington residents sent from the University of Nebraska and the same surveys sent to both states from Washington State University. Implementation procedures varied, but included from 4-5 mail contacts, with the mail-back questionnaire option provided in either the 3rd or 4th contact. A small token cash incentive was sent with the initial response request, and in some instances a smaller incentive was sent with the paper questionnaire when it was withheld until the 3rd or 4th contact. Detailed procedures for each of the studies are provided elsewhere (Smyth, Dillman, Christian and O’Neill 2010; Messer and Dillman 2011; Messer 2012; Edwards, Dillman and Smyth 2014; Dillman, Smyth and Christian 2014).
The initial test in a rural region of Idaho and Washington resulted in 55% of households responding to the web-push treatment, with 74% of those responses coming over the Internet. This test also revealed that enclosing a paper questionnaire and offering an immediate choice of modes produced a significantly higher response rate of 63% (Smyth et al. 2010). Unfortunately, nearly 80% of those responses came by paper, too many to warrant the cost of setting up the web data collection. Because of that effect and the initial promise being shown of getting more than half the households to respond over the Internet in the web-push treatment, experimentation on the choice methodology was discontinued. We also found from this initial test that a paper-push treatment that withheld offer of a web option until the last contact produced only two percent of the responses over the Internet. Based upon this result the web follow-up was discontinued after two additional tests with similar results. In addition, results from this initial rural region study encouraged us to carry forward the web-push with paper follow-up for additional testing with statewide populations.
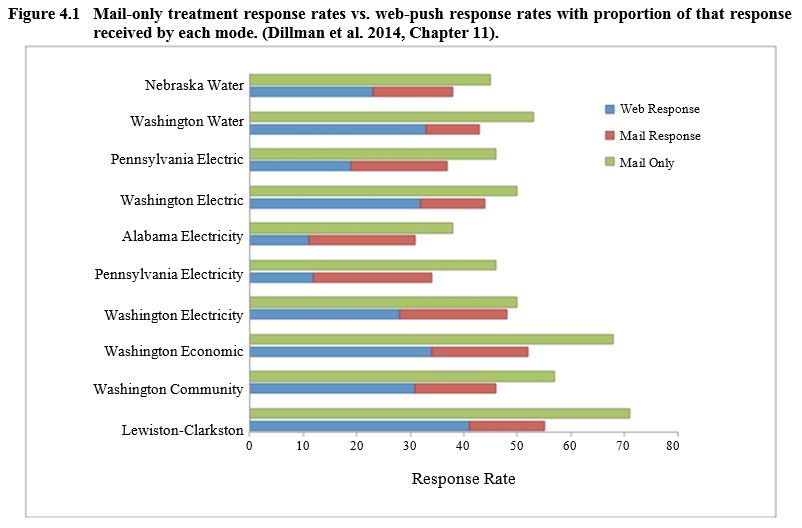
Across all ten experiments that involved five states, the web-push surveys produced a mean response rate of 43%, ranging from 31-55% (Figure 4.1). The mail-only comparisons produced a mean response rate of 53%, with a range of 38-71%. On average, 60% of the responses to the web-push treatments came over the Internet. Experimental treatments in one of the studies showed that the incentive enclosed with the web-push request improved the web response dramatically, from 13% to 31%, or about 18 percentage points (Messer and Dillman 2011). Although an RDD comparison was not included in any of the experiments, the results from the web-push procedures were undoubtedly much higher than would have been obtained by telephone for these long questionnaires, had such a comparison been included.
An item nonresponse comparison was made for three of the experiments to determine whether the mail follow-up questionnaires obtained higher item nonresponse rates than the web responses obtained in those treatment groups. For the regional study in 2007 and two statewide studies in 2009 the follow-up paper questionnaires produced item non response rates more than twice as high, 8.2% vs. 3.6% for those who responded by web. However, when the overall item nonresponses for the web-to-push treatment groups (web plus mail responses) were compared to mail only treatment group responses, there were virtually no differences between groups, being 5.3 and 5.7 respectively. The authors speculated that the initial web responses were being provided by “better” respondents, while the later responses by mail were generating responses from less able respondents, as indicated by being older and having less education. (Messer, Edwards and Dillman 2012).
Populations likely to be unfamiliar with Washington State University the sponsor of these studies had significantly lower response rates, especially among those responding on the web. For example, only 12% and 11% responded in Pennsylvania and Alabama respectively, compared to 28% in the Washington survey (Messer 2012). A water management study conducted by the University of Nebraska and Washington State University provided additional insight on this phenomenon by sending requests for responses to households in the other state. The web-push response was 6.1 percentage points lower among Washington residents and 14.7 percentage points lower among Nebraska residents when surveyed from the University located outside the state (Edwards et al. 2014). Virtually all of this decline occurred in the internet responses which decreased from 32 to 26 percent in Washington and from 38 to 23 percent in Nebraska, when the response requests came from the opposite state’s university. We speculated that responding over the Internet is more sensitive than mail responses to the lack of familiarity and trust of the survey sponsor.
Description for Figure 4.1
Horizontal bar chart comparing the mail-only treatment response rates vs. web-push treatment response rates for ten tests of data collection procedures. The ten studies are on the y-axis (Nebraska – Water, Washington – Water, Pennsylvania – Electric, Washington – Electric, Alabama – Electricity, Pennsylvania – Electricity, Washington – Electricity, Washington – Economic, Washington – Community et Lewinston-Clarkston) and the response rates are on the x-axis ranging from 0 to 72%. There are two bars for each one of the ten comparisons: one representing the mail-only response rate and the other the web-push response rate, the latter being divided in two parts proportionally to the mail or web response rate. In all cases, mail-only response rates are higher than web-push ones.
For Nebraska – Water, the mail-only response rate was about 44% and the web-push one was about 23% from the web and 14% from mail.
For Washington – Water, the mail-only response rate was about 53% and the web-push one was about 33% from the web and 9% from mail.
For Pennsylvania – Electric, the mail-only response rate was about 45% and the web-push one was about 19% from the web and 18% from mail.
For Washington – Electric, the mail-only response rate was about 50% and the web-push one was about 32% from the web and 12% from mail.
For Alabama – Electricity, the mail-only response rate was about 37% and the web-push one was about 11% from the web and 19% from mail.
For Pennsylvania – Electricity, the mail-only response rate was about 45% and the web-push one was about 12% from the web and 21% from mail.
For Washington – Electricity, the mail-only response rate was about 50% and the web-push one was about 28% from the web and 19% from mail.
For Washington – Economic, the mail-only response rate was about 67% and the web-push one was about 34% from the web and 18% from mail.
For Washington – Community, the mail-only response rate was about 57% and the web-push one was about 31% from the web and 15% from mail.
For Lewinston-Clarkston, the mail-only response rate was about 72% and the web-push one was about 41% from the web and 14% from mail.
The ten comparisons from these web-push studies revealed that those who responded over the Internet in the web-push treatment groups were significantly different than those who responded later to the mail questionnaire. For example, web respondents were younger, more educated, had higher incomes, and were less likely to live alone (Messer and Dillman 2011). However, the combined web and mail respondents in the web-push treatments were demographically quite similar to the mail-only treatment groups. The research concluded that individuals prone to respond by web could also be convinced to respond to the mail-only treatment. This finding was reinforced by the fact that a paper questionnaire follow-up to the web-only request produced significant improvement in response rates, whereas a web follow-up to a mail-only approach did not produce Internet responses that significantly improved overall response.
Although the web-push and mail-only treatment group responses were quite similar, the unweighted data exhibited nonresponse bias for certain demographics. Respondents had more education and children in the home than those who responded to the American Community Survey (discussed in more detail below) that now uses mail, web, phone and in-person interviews to obtain close to 97% response rates, and is relied on for producing official U.S. statistics for all U.S. states. Such comparisons were beyond the purpose and scope of these experiments and more investigation needs to be done to understand the nature of such differences. In addition, costs per respondent were not shown to be lower for Internet responses, because of contact costs being about the same for web-push and mail only methods, while producing fewer respondents (Messer and Dillman 2011). That seems likely to change as use of the Internet continues to expand to more people and areas of life.
Overall, the outcome of this coordinated set of studies made it clear that the web-push methodology offers considerable promise for obtaining web responses to household surveys. It was also clear that paper follow-up questionnaires would improve representation of people unable or unwilling to respond over the Internet.
4.4 Additional web-push tests on other populations and situations
In recent years the use of web-push data collection strategies has expanded and they are widely used in government, university, and private sector surveys in multiple countries. Uses have also spread beyond general public populations, and now involve survey situations where requests to respond via the Internet are not limited to mail contact. In addition, some surveys involve as many as three modes of contact and three modes of response, with the intent of getting very high response rates, while pushing as many respondents as possible to the web, in an effort to lower survey costs.
In 2013, the American Community Survey was converted from a sequence of mail-telephone-in person requests, to beginning with an Internet response, followed by the three remaining contact and response procedures (United States Census Bureau 2014, Chapter 7). The law requires U.S. citizens to respond to the American Community Survey (formerly the long form in the Decennial Census). Therefore, the overall response rate for occupied households was about 97%. Tests of web-push strategies began in 2011, when an initial experiment confirmed that web-push resulted in dramatically higher response rates (28% vs. 10%) over the Internet than did a “choice” strategy that also offered mail in the first contact (Tancreto 2012). In 2013, 28% of the responses from occupied households occurred over Internet, 22% by mail, 6% by telephone, and 43% by in-person interview. Thus, about 51% of the self-administered responses were over the Internet, a proportion that increased to 58% in 2015. Tests are now underway in support of plans to convert the 2020 Decennial Census to web-push methods with a similar follow-up.
The Japanese Census was converted to a web-push methodology in 2015 (City of Sapporo 2015). On-line response was about 37%, with one third of those responses coming from smartphones, which are used extensively in Japan. The remainder of the response was obtained by mail questionnaires and enumerator visits. The 2016 Australian Census and 2016 Canada Census were also conducted using web-push methodologies. Although final results are not yet available, it is known for Canada that 68% of households responded over the Internet, 20% by mail, with an additional 10% through enumerator visits, for an overall response rate of 98% (Statistics Canada 2016). The proportion of Internet responses in the Canadian Census is the highest I am aware of for a web-push household survey. In some areas of Canada a paper questionnaire was included with the request, providing a choice of response modes to respondents. The high Internet response (68%) and Internet plus mail response (88%) suggests great promise for use of a web-push methodology in that country and perhaps others with high Internet penetration.
A newly developed National Child Health Survey developed as a replacement for a previous RDD household survey in the United States plans to screen an address-based sample of children, then select a child for detailed reporting of health issues. However, instead of using two separate mail data collections, they tested in 2015 the possibility of reducing the process to do a one-step, in which the computer uses study criteria to immediately select and administer a topical health questionnaire for one child. This procedure seeks to improve upon the two-step mail-only response process recently developed for the National Child Education Survey. Results from a pretest in 2015 were promising and it is now going through a second stage of testing.
The U.S. Residential Energy Consumption Survey, conducted for many years by the Energy Information Administration through in-person household interviews, is in the process of being changed to a web-push survey. This survey is noteworthy because it combines a cash incentive with the initial request to respond over the web, and also provides a post-incentive. The post incentive was deemed especially important because of the cost savings it provided by not having to send in-person interviewers to nonresponding households (Biemer, Murphy, Zimmer, Berry, Deng and Lewis 2015).
Not all web-push surveys use address-based sampling. The 2010 National Survey of College Graduates (NSCG) began sampling individuals who reported being a college-graduate in the previous year’s American Community Survey and asked them to complete the NSCG, which is conducted every two years (Finamore and Dillman 2013). Postal addresses, as well as telephone numbers, were mostly available for the households where they had lived the previous year. Prior to 2010, households had been selected from the Decennial Census Long Form (last completed in 2000) with telephone, mail, and in some cases in-person interviews. In 2010, comparisons were made among pushing people to the telephone, pushing respondents to mail, and pushing respondents to the web, followed by use of the other two modes. All three of these treatments were followed by a final telephone effort in which responses could be made by that mode or either of the others. Two results were particularly important. First, all three response rates were within a few percentage points of each other, ranging from 74-77%, for this voluntary survey. However, the web-push strategy, in which 53% reported by web, proved to much less expensive, $48 per respondent vs. $66 for mail first and $75 for telephone first. It was concluded that the results from each procedure represented the original sample quite well.
A recent voluntary survey of spouses of U.S. military members compared a web-push strategy with a mail-push strategy. The web-push methodology produced a significantly higher response rate, 33% vs. 28%, with 87% of the web-push responses being received over the Internet (McMaster, LeardMann, Speigle and Dillman 2016). The web push strategy was also much less expensive, $61 per respondent vs. $89.
The success of the web-push strategies for the college graduate and military member studies may be for different reasons. All of the NSCG participants had at least a four-year college degree. Participants in the Family Study of Military Members were also relatively young. The authors of the latter study suggested that the fact that military members rely greatly on the Internet for communication with spouses during deployment might account for its greater effectiveness than mail-push methods.
Many other tests of a web-push methodology have emerged during the past decade. A Swiss study has shown that response rates of about 72 percent of households drawn from Swiss registration lists with 44% by web, 20% by mail and the remainder by telephone or in-person interviews (Roberts et al. 2016). In the United Kingdom, in-person interviews have been relied on far more extensively than telephone for conducting national statistical surveys. Recently, a decision was made to convert the Community Life Survey from an in-person interview to a web-push followed by mail strategy (United Kingdom Cabinet Office 2016). This decision was made in order to lower costs, while also increasing the sample size. It remains to be seen what results will be obtained.
Private sector uses of web-push methods for specialized survey populations have also evolved. Nexant now conducts surveys of gas and electric utility customers with web-push methods. In the past telephone surveys were the dominant method. Companies whose customers are to be surveyed are able to provide postal addresses and telephone numbers for nearly all customers and email addresses from 20-40% of households (Sullivan, Leong, Churchwell and Dillman 2015). Following a procedure developed by Millar and Dillman (2011), emails are sent to those households to arrive shortly after the letter of request that contains as $2 incentive, followed by another email three days later, and if there is no response another paper survey is sent. Multiple tests have produced response rates of 40-80% with 80-90% of responses who received this email augmentation of the mail contact responding online, compared to about 35-70% of those without email addresses. Responses can be nudged upwards by 8-10 percentage points with a follow-up phone call to those without email addresses, compared to 1-2% for those with email addresses.
- Date modified: