
Job quality of racialized Canadians with a bachelor’s degree

Archived Content
Information identified as archived is provided for reference, research or recordkeeping purposes. It is not subject to the Government of Canada Web Standards and has not been altered or updated since it was archived. Please "contact us" to request a format other than those available.
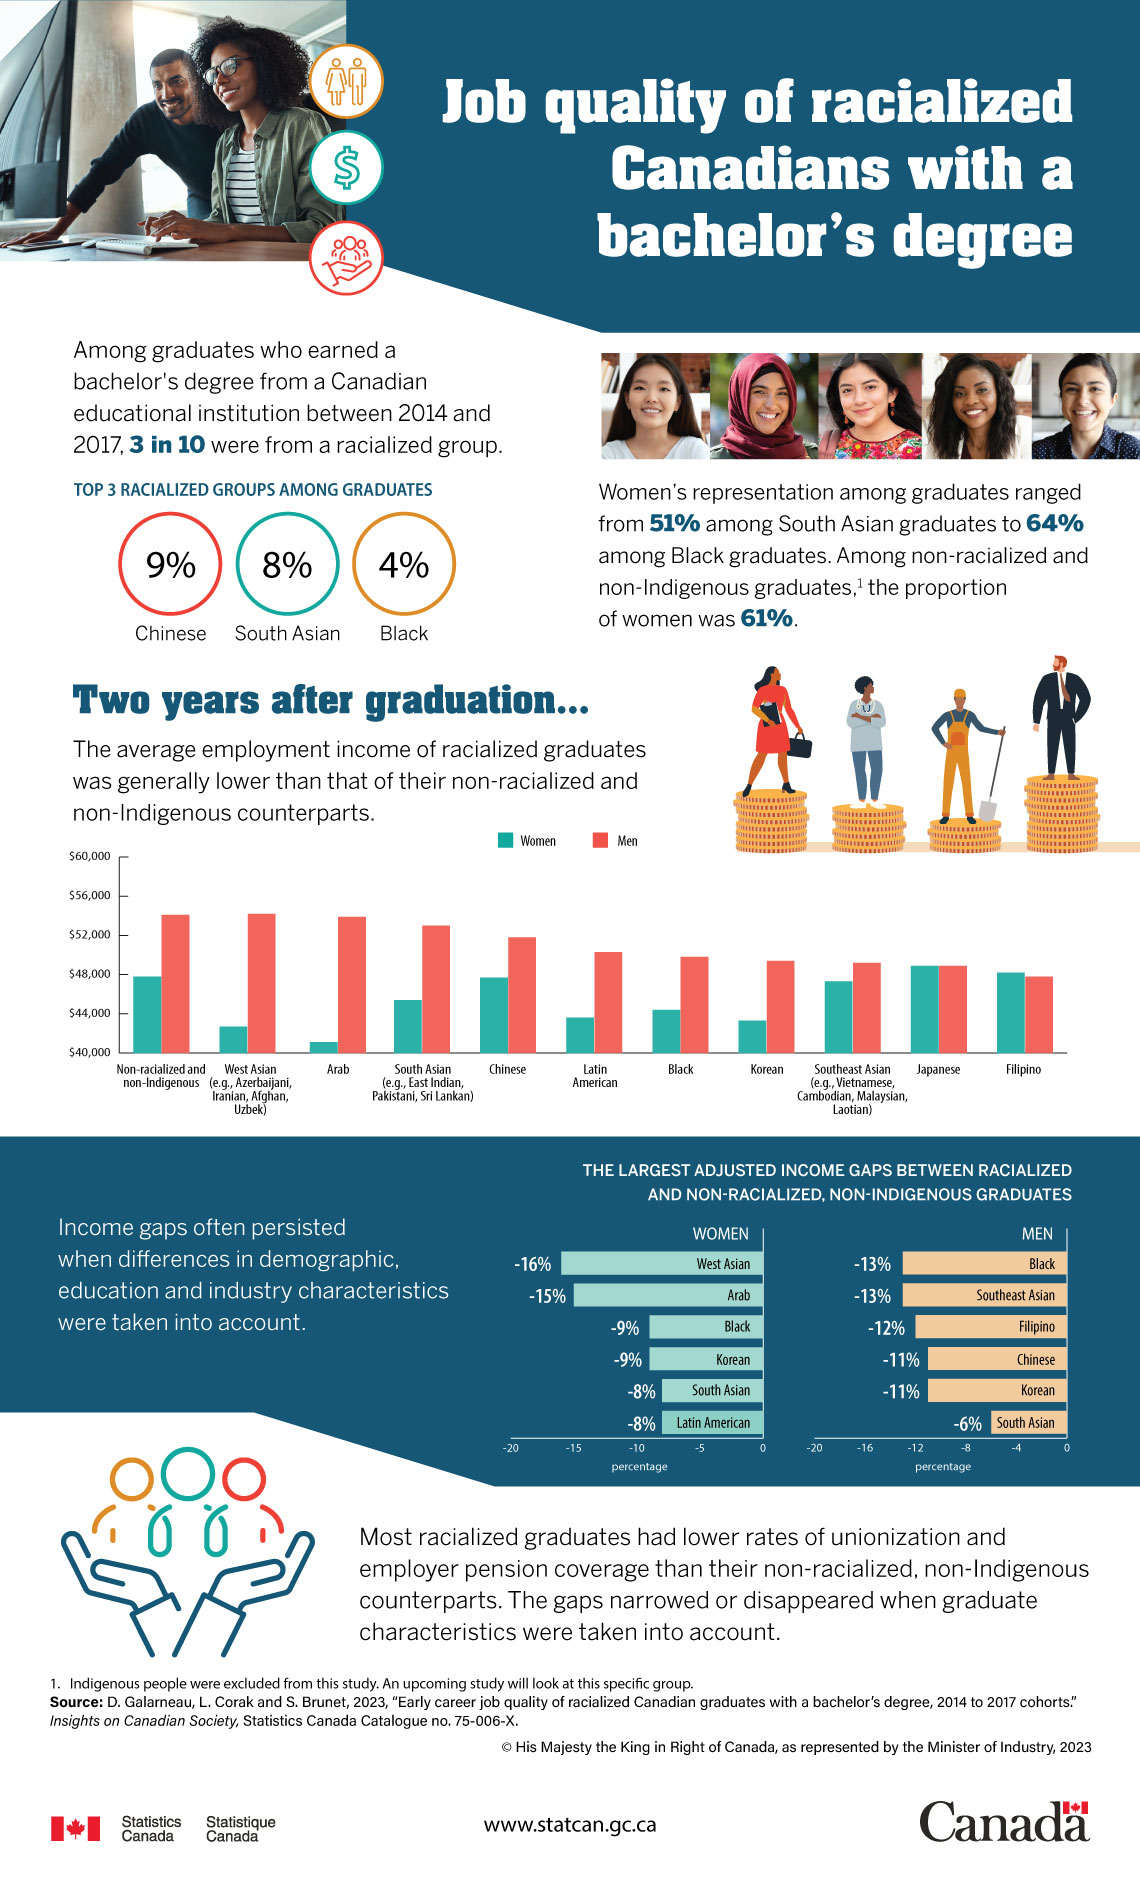
Description: Job quality of racialized Canadians with a bachelor’s degree
Among graduates who earned a bachelor’s degree from a Canadian educational institution between 2014 and 2017, 3 in 10 were from a racialized group.
Top 3 racialized groups among graduates
- Chinese, 9%
- South Asian, 8%
- Black, 4%
Women’s representation as graduates ranged from 51% among South Asian graduates to 64% among Black graduates. Among non-racialized and non-Indigenous graduates,Note 1 the proportion of women was 61%.
Two years after graduation…
The average employment income of racialized graduates was generally lower than that of their non-racialized and non-Indigenous counterparts.
| Women | Men | |
|---|---|---|
| Non-racialized and non-Indigenous | $47,800 | $54,100 |
| West Asian (e.g., Azerbaijani, Iranian, Afghan, Uzbek) | $42,700 | $54,200 |
| Arab | $41,100 | $53,900 |
| South Asian (e.g., East Indian, Pakistani, Sri Lankan) | $45,400 | $53,000 |
| Chinese | $47,700 | $51,800 |
| Latin American | $43,600 | $50,300 |
| Black | $44,400 | $49,800 |
| Korean | $43,300 | $49,400 |
| Southeast Asian (e.g., Vietnamese, Cambodian, Malaysian, Laotian) | $47,300 | $49,200 |
| Japanese | $48,900 | $48,900 |
| Filipino | $48,200 | $47,800 |
Income gaps often persisted when differences in demographic, education and industry characteristics were taken into account.
The largest adjusted income gaps between racialized and non-racialized, non-Indigenous graduates
Women
- West Asian, -16%
- Arab, -15%
- Black, -9%
- Korean, -9%
- South Asian, -8%
- Latin American, -8%
Men
- Black, -13%
- Southeast Asian, -13%
- Filipino, - 12%
- Chinese, -11%
- Korean, -11%
- South Asian, -6%
Most racialized graduates had lower rates of unionization and employer pension coverage than their non-racialized, non-Indigenous counterparts. The gaps narrowed or disappeared when graduate characteristics were taken into account.
Source: D. Galarneau, L. Corak and S. Brunet. 2023, “Early career job quality of racialized Canadian graduates with a bachelor’s degree, 2014 to 2017 cohorts,” Insights on Canadian Society, Statistics Canada Catalogue no. 75-006-X.
- Date modified: