
The changing face of the Canadian hog industry

Archived Content
Information identified as archived is provided for reference, research or recordkeeping purposes. It is not subject to the Government of Canada Web Standards and has not been altered or updated since it was archived. Please "contact us" to request a format other than those available.
by Yan Brisson, Agriculture Division
This study looks at how the hog industry  industry has evolved, using data from the Census of Agriculture. This industry is constantly changing due to fluctuations in prices and in the value of the Canadian dollar, herd genetics and breeding methods, marketing contracts, markets, and new diseases, such as the 2013 outbreak of porcine epidemic diarrhea.
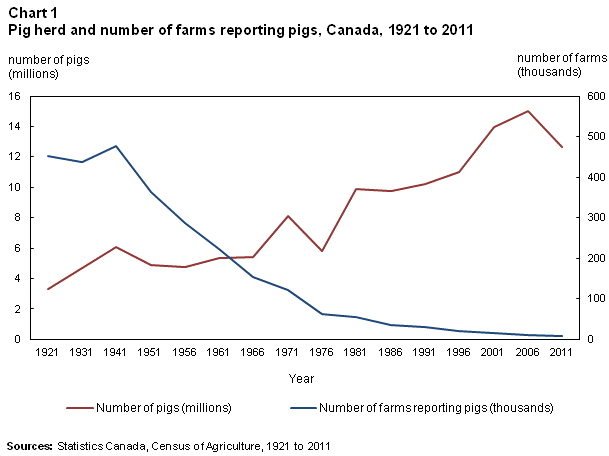
From 1921 to 2011, the total number of farms in Canada went from 8.1 per 100 inhabitants to 0.6 per 100 inhabitants, which represents a major transformation. Over time, farming operations have become more intensive and specialized, and the hog sector is no exception to this trend. During this period, the Canadian herd rose from 3,324,291 head to 12,679,104, while the number of farms reporting pigs dropped from 452,935 to 7,371.
| Year | Population | Total number of farms | Farms reporting pigs |
|---|---|---|---|
| number of people | number of farms | ||
| 1921 | 8,787,949 | 711,090 | 452,935 |
| 2011 | 33,476,688 | 205,730 | 7,371 |
| Sources: Statistics Canada, Census of Population and Agriculture, 1921 and 2011 | |||
This change occurred gradually over the years. From 1921 to the early 1960s, hog operations changed slowly. The number of farms decreased significantly, but the national herd remained relatively stable. There was then a gradual shift from subsistence farming, with mixed livestock, to more commercial farming with specialized farms. The average herd size increased accordingly.
Then, in the 1960s, there was strong growth in the national herd. In a way, this was the beginning of the hog sector’s expansion; a number of slaughterhouses and delicatessens came to be. This was followed, a decade later, by the first period of adversity for the hog industry, which also affected a number of other types of agricultural operations.
The sector saw rapid expansion from 1976 to 1981. Subsequently, different economic factors, such as high interest rates and the Asian financial crisis, would push this industry into stagnation until the mid-1990s.
Stimulated by the new North American Free Trade Agreement, an era of prosperity blossomed from 1996 to 2006. It brought significant growth, with the Canadian herd peaking at 15,043,132 head. This growth period was not without blips, such as dramatic price declines in 1998 and reduced demand from Asian markets.
Finally, the current period that began at the start of the millennium saw hog numbers fall back to the same level as in the 1990s, as well as a decline in the number of hog farms.
In 2011, the hog industry was the fourth largest in Canada, after canola, dairy products and cattle, with cash receipts of $3.9 billion.Note 1 The typical hog operation generated median sales of $160,918 in 2010, cultivated a median area of 99 acres in hay and field crops in 2011, and was run by a male aged 50, who lived on the farm and worked there more than 40 hours per week.
Canadian pork in the world
The global economy is undergoing a major transformation, with decisive effects on the agriculture and food sectors. The demand for animal products, such as meat, is constantly growing. Worldwide, pork is the most heavily consumed meat, especially in America, Europe and Asia. It accounted for 36.3% of production, followed by poultry (34.4%) and beef (21.2%). Its production went from 20 million tonnes in 1960, to more than 108 million tonnes in 2011.
Canada plays a vital role in this market. In 2011, it exported more than one million tonnes of pork, with a value of $2.9 billion, to more than 80 countries—mainly the United States, Japan, Russia, China and South Korea. This put Canada in fifth place among world exporters. Most of the pork produced in Canada is destined for the export market.
| Country | Quantity | Value | World position |
|---|---|---|---|
| tonnes | US$ thousands | rank | |
| Germany | 2,225,570 | 6,640,321 | 1 |
| United States | 1,925,976 | 5,865,108 | 2 |
| Denmark | 1,594,878 | 4,395,891 | 3 |
| Spain | 1,214,441 | 3,717,779 | 4 |
| Canada | 1,088,283 | 2,905,684 | 5 |
| Netherlands | 1,073,371 | 2,800,864 | 6 |
| Source: Food and Agriculture Organization of the United Nations, 2011 (consulted March 24, 2014) | |||
A period of adversity
According to the 2011 Census of Agriculture, the number of operations that reported pigs fell 35.9% to 7,371, compared with 2006. At the same time, the number of pigs was down 15.7% to 12.7 million. Several factors played a role in this decline.
First, the price of hogs, which began to decline in 2005, remained low until 2010, reducing producers’ income. Then, there was the world food crisis of 2008, droughts such as those in the southern United States and Australia, the increase in the price of a barrel of oil, and stock market speculation that contributed to the surge in grain prices. Since feed is the largest expense item for hog production, and since hogs are monogastric animals primarily fed on meal composed of grains, such as barley and corn, this price increase strongly affected the profitability of hog farms. Furthermore, a look at the ratio of the price of hogs to the price of grain reveals that the ratio began deteriorating in 2005 and has still not returned to previous levels.

With the Canadian dollar close to parity with the U.S. dollar for several years now (except in 2009), Canadian exports are more costly compared with imports.Note 2 This is especially true since the United States is the main importer of Canadian swine in volume terms, accounting for more than one-quarter of exports in 2011, and since the price of Canadian swine is strongly influenced by the price set on the Chicago Stock Exchange.Note 3
In 2008/2009, the federal government introduced the Cull Breeding Swine Program (CBSP) and the Hog Farm Transition Program (HFTP), which are designed to facilitate the transition of hog producers who want to downsize, to adapt to the current market situation, or to exit from production. The CBSP resulted in a decrease of 128,175 hogs, or 8.4%Note 4 of Canada’s breeding stock. The HFTP brought about a decrease of 671,600 hogs, representing 5.4% of the Canadian herd. Under the two programs combined, nearly 800,000 hogs were withdrawn, or 6.3% of the total counted in 2011.
| Province | Hog farms | Participating farms | Share | Hogs | Hogs | Share |
|---|---|---|---|---|---|---|
| number | % | number | % | |||
| Canada | 7,705 | 338 | 4.4 | 12,525,000 | 671,600 | 5.4 |
| Atlantic provinces | 255 | 19 | 7.5 | 131,400 | 52,277 | 39.8 |
| Quebec | 1,980 | 36 | 1.8 | 4,100,000 | 42,449 | 1.0 |
| Ontario | 2,695 | 161 | 6.0 | 2,994,600 | 252,726 | 8.4 |
| Manitoba | 680 | 59 | 8.7 | 2,815,000 | 126,125 | 4.5 |
| Saskatchewan | 510 | 12 | 2.4 | 975,000 | 61,882 | 6.3 |
| Alberta | 925 | 41 | 4.4 | 1,420,000 | 86,000 | 6.1 |
| British Columbia | 660 | 10 | 1.5 | 89,000 | 50,141 | 56.3 |
|
Note: This table reflects only changes for the period covered by Census of Agriculture data. Sources: Statistics Canada, CANSIM tables 003-0100 and 003-0103, Hog Statistics, 2010 Period I and Canadian Pork Council, Hog Farm Transition Program 2010 |
||||||
Diseases also had a negative impact on the hog industry. Influenza A (H1N1), incorrectly called ‘swine flu’, damaged consumer confidence. In 2009, some countries, such as China and Russia even closed their doors to Canadian pork imports. Other diseases also struck a number of herds, especially since the start of the millennium, such as porcine reproductive and respiratory syndrome (PRRS) and porcine circovirus (PCV2). These had economic impacts estimated at several hundreds of millions of dollars a year on the North American pork industry. In 2007, the federal government launched the initiative for the Control of Disease in the Hog Industry (CDHI).

Finally, different international policies adversely affected exports. An example is the policy on mandatory country-of-origin labelling, better known as COOLNote 5 in the United States, which came into force in 2009. COOL resulted in extra costs, especially with respect to the trade of live hogs. These changes especially affected Ontario and Manitoba because of their strong integration and the proximity of their hog farms to the border.

In restructuring mode
This period, therefore, saw a major restructuring of the sector. Between 2006 and 2011, the number of farms fell by 35.9% and the herd decreased 15.7%. The impact of this period affected the number of farms most, with Manitoba posting the largest decrease (-50.3%), followed by Alberta (-45.6%) and Saskatchewan (-44.3%).

There were few changes in the distribution of the herd. According to 2011 Census data, 79.2% of Canadian hogs were in Quebec, Ontario and Manitoba, compared with 74.0% in 2006. The greatest changes with respect to 2006 were in the Atlantic provinces, where the number of head fell by 60.9%, followed by British Columbia (-34.4%) and Alberta (-31.9%). The provinces showing the smallest decline were Quebec (-3.7%) and Manitoba (-2.8%).

The size of farms continued to increase substantially, with the national average rising to 1,720 hogs per operation in 2011. The provinces with the largest farms were Manitoba (4,831 hogs per operation) followed by Quebec (2,098) and Saskatchewan (1,986). The smallest average herd sizes were in British Columbia (142) and the Atlantic provinces (474).
| Province | Number of farms | Number of hogs | Average herd | |||
|---|---|---|---|---|---|---|
| 2006 | 2011 | 2006 | 2011 | 2006 | 2011 | |
| number of farms | number | |||||
| Canada | 11,497 | 7,371 | 15,043,132 | 12,679,104 | 1,308 | 1,720 |
| Atlantic provinces | 462 | 270 | 327,576 | 128,068 | 709 | 474 |
| Quebec | 2,454 | 1,953 | 4,255,637 | 4,096,678 | 1,734 | 2,098 |
| Ontario | 4,070 | 2,556 | 3,950,592 | 3,088,646 | 971 | 1,208 |
| Manitoba | 1,188 | 590 | 2,932,548 | 2,850,581 | 2,468 | 4,831 |
| Saskatchewan | 930 | 518 | 1,388,886 | 1,028,530 | 1,493 | 1,986 |
| Alberta | 1,576 | 857 | 2,052,067 | 1,397,534 | 1,302 | 1,631 |
| British Columbia | 817 | 627 | 135,826 | 89,067 | 166 | 142 |
| Sources: Statistics Canada, Census of Agriculture, 2006 and 2011 | ||||||
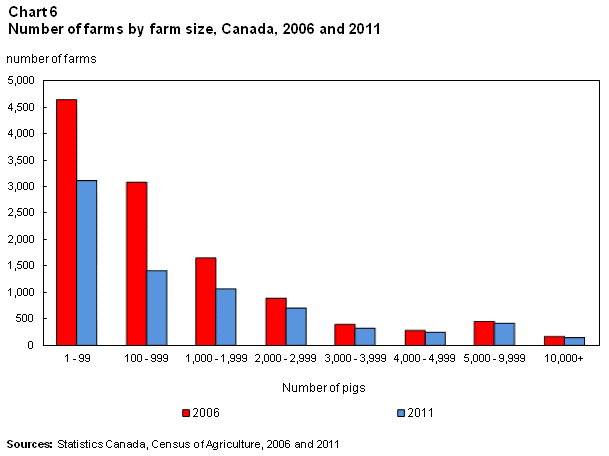
This restructuring affected mostly smaller farms, while the largest farms appear to have come through better. This helps to explain the increase in the average herd and corresponds to the broader pattern observed in rural Canada. In 2011, operations with more than 5,000 hogs accounted for 7.6% of total operations and had 52.4% of the hog herd, compared with 5.3% of hog operations that had 44.0% of the herd in 2006. Moreover, these larger farms tend to be more specialized.  Farms reporting more than 1,000 head reported no other type of livestock in 64.7% of cases, compared with 16.1% of smaller farms.
Herd management also changed. Between 2006 and 2011, the number of sows declined by 26.8% to 1,136,630. The number of piglets (both non-weaned and weaned) decreased 9.6% to 4,753,769. The number of grower-finisher hogs fell 17.5% to 6,736,613. The number of boars declined 26.3% to 25,092.
Market (or finisher) operations, namely operations involved only in raising finishing hogs to bring them up to slaughter weight, represented the largest proportion of pig farms (41.4%). This was followed by farrow-to-finish operations (29.4%), which raise pigs throughout all stages of development, and finally, suckling and nursery pig farms (29.2%), which focus solely on the farrowing and raising of piglets.
| Type of operation | Number of farms | Number of pigs | ||||
|---|---|---|---|---|---|---|
| 2006 | 2011 | Difference between 2011 and 2006 | 2006 | 2011 | Difference between 2011 and 2006 | |
| number of farms | % |
number of pigs | % | |||
| Total | 11,497 | 7,371 | -35.9 | 15,043,132 | 12,679,104 | -15.7 |
| Suckling and nursery only | 2,560 | 2,150 | -16.0 | 2,486,404 | 1,899,281 | -23.6 |
| Market only | 5,013 | 3,052 | -39.1 | 4,021,426 | 3,493,939 | -13.1 |
| Farrow-to-finish | 3,924 | 2,169 | -44.7 | 8,535,302 | 7,285,884 | -14.6 |
| Sources: Statistics Canada, Census of Agriculture, 2006 and 2011 | ||||||
Most of the hog herd (57.5%) was in farrow to finish operations, followed by finishing operations (27.6%), and farrowing and nursery operations (15.0%). There was a larger decline in the number of farrow to finish operations, but the greatest decrease in the herd came from farrowing and nursery businesses. The fact that it now takes fewer sows to raise a larger number of piglets suggests that farms are becoming increasingly specialized.
In conclusion, the Canadian hog industry has changed greatly over the years. Data collected by the Census of Agriculture show that the industry has undergone a radical transformation. It has evolved from being an industry with a very large number of mixed farms, each possessing only a few pigs, to one with fewer large and highly specialized farms. It now plays a major role in exports and is constantly improving in terms of technology.
Start of text box
According to the Canadian Pork Council, the hog industry brings in $9.8 billion annually.
End of text box
Start of text box
While low in fat content, pork is an excellent source of protein, vitamins, iron, zinc and other nutrients. Depending on the cut, pork comes in different forms, such as bacon, spare ribs, tenderloin, osso buco, pulled pork, cutlets, sausage, and ham.
End of text box
Start of text box
Vertical integration and contractual arrangements play an active role in Canadian hog production. Vertical integration occurs when hogs are produced by controlling different stages of production. For example, an integrator might develop its own genetics, raise its pigs from suckling to finishing, and feed them with meal that it has manufactured in its own mill using grain that it has grown. Some integrators also possess their own slaughterhouse, and market the meat themselves. Many of these integrators also use a contractual arrangement involving a system of custom feeding.
End of text box
Notes
- Date modified: