
Demographic Documents
Technical Supplement: Production of Demographic Estimates for the Second Quarter of 2020 in the Context of COVID-19

Archived Content
Information identified as archived is provided for reference, research or recordkeeping purposes. It is not subject to the Government of Canada Web Standards and has not been altered or updated since it was archived. Please "contact us" to request a format other than those available.
Skip to text
Text begins
Introduction
The production of demographic estimates is based on the use of several well-documentedNote methods that have been presented and discussed with the various partners and collaborators of the Demographic Estimates Program (DEP). These methods rely on administrative data sources that are not necessarily optimal in terms of timeliness, completeness and coverage. The models used in the production processes make it possible to produce reliable and accurate population estimates despite these constraints.
In the context of the COVID-19 pandemic, the resulting crisis may have invalidated some of the assumptions of the models used in the production of population estimates. The DEP is committed to continuing to produce demographic estimates of the best possible quality, even in the current pandemic context. To achieve this, the methods of estimation of each of the demographic components have been re-evaluated. Where necessary, adjustments have been made to the usual methods.
This document outlines the re-evaluation process that was conducted for each demographic component in the circumstances surrounding the emergence of the pandemic. The context and usual method are described for each component. Relevant considerations in reassessing the estimates for the second quarter of 2020 are then presented. Following this, the factors justifying the choice of whether or not to make an adjustment are presented, with a description of the adjustment if applicable. Finally, the strategies under consideration for the production of the estimates for the next quarter are briefly discussed.
Births
Context
Given the social and economic disruptions associated with the COVID-19 pandemic, there may be fluctuations in the number of births beginning in mid-December, or 40 weeks after lockdown measures were first implemented by various levels of government in Canada. There are two schools of thought that support competing assumptions about the potential impact of the current crisis on fertility levels. Some specialists suggest that the lockdown measures may have led to an increase in intimate relations between couples, which would translate into an increase in births nine months later. Conversely, a majority of specialists agree that the climate of uncertainty and concern should instead result in a decrease in fertility.
Usual method
The final estimates of the number of births are derived directly from vital statistics provided by Statistics Canada’s Centre for Population Health Data (CPHD). These data are generally received within about two years of the estimate reference period.
For preliminary or updated estimates, the ratio method is used since vital statistics are not available when the estimates are produced. The number of births is estimated using fertility rates by the mother’s age group, which are based on the most recent year for which final estimates are available.
Relevant considerations in the context of COVID-19
- According to most experts, the economic uncertainty and concerns caused by the pandemic could reduce birth rates:
- “… uncertainty and scarcity are likely to reduce the birthrate as individuals, couples and families decide to delay, postpone or forego having a child” (Liz Allen, Australian National UniversityNote );
- “Economic uncertainty really impacts fertility”; “This is likely to lead to even further drops in fertility and births as well” (Rogelio Sáenz, University of TexasNote );
- “Many people in childbearing ages were already worried about their futures, and now they may face unemployment as well”; “That kind of anxiety is not conducive to having a child” (Jennifer Johnson-Hanks, University of CaliforniaNote );
- “A climate of fear is not psychologically ideal for becoming pregnant and there is currently quite a lot of tension”; “Economic crises are usually associated with a decline in births” (Richard Marcoux, Laval UniversityNote );
- “The global health crisis is having an impact on fertility intentions, which are the decisions people make about having a child or adding to their family and when to do so” (Nora Spinks, Vanier Institute for the FamilyNote );
- “I don’t think in this world right now people are going to be feeling too good about bringing kids into it” (Tom McCormack, Metro EconomicsNote );
- “The shutdowns are resulting in large economic losses”; “Given the irreversible nature of childbearing and the substantial costs associated with child-rearing, unemployment and lost income will necessarily reduce fertility” (Aassve et al. 2020).
- American and European surveys on fertility intentions conducted at the start of the pandemic revealed that 38% (United States) to 79% (Spain) of women surveyed were rethinking having children, whether that meant delaying or abandoning their fertility plans (Lindberg L.D. et al. 2020; Luppi et al. 2020);
- Existing scientific literature shows that, during economic upheavals, fertility has generally declined:
- During the Great Recession of 2008, fertility rates declined the most in regions where the labour market situation had deteriorated the most (Matysiak et al. 2020);
- During the 2008 economic crisis, demographers observed that young people in Europe postponed leaving the family home due to a precarious employment and housing situation. This means that children tend to live longer with their parents (Balbo et al. 2020);
- A review of a number of studies that measure the impact of economic recessions on fertility in developed countries has shown that, in general, fertility tends to follow the swings of economic cycles (Sobotka et al. 2011);
- By examining economic studies and fertility behaviours observed during the Great Recession of 2007 to 2009 and the 1918 Spanish Flu, American researchers recently estimated that there could be 300,000 to 500,000 fewer births in the United States in 2021 because of the COVID-19 pandemic (Kearney and Levine 2020).
- Other secondary factors may have localized impacts on fertility rates in some segments of the population:
- Most fertility clinics had to close their doors in March for an extended period to comply with lockdown directives from various levels of government.Note Clinics began gradually reopening in May, with backlogs of several weeks;Note
- The international adoption process was interrupted in March due to the COVID-19 pandemic.Note Even as a number of adoption agencies are gradually resuming their administrative and adoption coordination activities, future parents still cannot go overseas to meet or bring back their child, because these trips are considered non-essential;Note
- Abortion services were quickly declared essential after the start of the pandemic across Canada.Note Medical follow-ups by phone or video were also implemented rapidly to provide services such as family planning.Note
- The dangers of COVID-19 on the health of the future mother and baby can also factor into the decision to delay childbearing during the pandemic. Since the immune system of pregnant women is partially weakened to prevent rejection of the fetus, they are at higher risk of contracting COVID-19 (Phoswa and Khaliq 2020). In addition, compared with both pregnant women who do not have COVID-19 and infected women who are not pregnant, pregnant women with COVID-19 are at increased risk of complications (hospitalization, intensive care admission, ventilation, C-section, postpartum health problems), but not of death (CDC 2020; Ellington et al. 2020; Prabhu et al. 2020). In addition, children born to mothers with COVID-19 are apparently unlikely to contract it as well, either during the pregnancy or during delivery (Prabhu et al. 2020). According to the CDC,Note an increased risk of miscarriage has not been documented in pregnant women infected with COVID-19. In short, research is limited and more needs to be done in this area as the situation develops, as time passes, and as data on the topic become available.
Factors behind the decision to not adjust birth estimates
Births in the second quarter of 2020 are the result of fertility behaviour nine months earlier, before the start of the pandemic. For this reason, no adjustments were made to the usual method for producing birth estimates in the second quarter of 2020.
Adjustment strategies under consideration for third quarter of 2020 estimates
If the current situation were to affect fertility rates, the effects would not be discernible before the end of the fourth quarter of 2020, nine months after the start of the COVID-19 pandemic. Therefore, no adjustments to birth estimates are planned for data from the third quarter of 2020.
Deaths
Context
The first COVID death was reported on March 9, 2020, in the first quarter of 2020. By the end of the first quarter (January to March) there were 96 deaths in Canada. The number of deaths increased during the three months of the second quarter (April to June), with there being 3,088 deaths in April, 4,111 deaths in May, and 1,296 deaths in June.Note
Usual method
The usual method for calculating death estimates takes the age- and sex-specific mortality rates of the last quarter for which there is final data (quarterly rates from 2018)Note as applied to the population at the beginning of the quarter (April 1, 2020). As per usual, death totals for Quebec and British Columbia are provided by the Institut de la statistique du Québec (ISQ) and BC Stats.
Relevant considerations in the context of COVID-19
The usual method produces estimates of deaths based on the mortality rates from previous years. They therefore do not include the increased mortality that was experienced from COVID-19 and are not optimal for producing death estimates in the midst of a pandemic. There are two sources of data available which can help to incorporate pandemic-related deaths
First, resulting from the COVID-19 pandemic, Statistics Canada is committed to releasing very timely data on numbers of deaths, and have therefore devised a method to produce provisional death counts. The Centre for Population Health Data (CPHD) and the Centre for Demography have created statistical models that use the death registrations that have been received from the provinces and territories, estimates of expected number of deaths based on past years trends, and calculations of excess mortality due to the COVID-19 pandemic in order to provide a provisional count of the number of deaths that occurred in 2020.Note
Second, the Public Health Agency of Canada (PHAC), produces a file daily that includes deaths from COVID-19 by province and territory. It includes all deaths from COVID-19 in Canada since the beginning of the pandemic. This data source was used in conjunction with the DEP usual methods to produce the deaths estimates from the first quarter of 2020.Note
Factors justifying the decision to adjust death estimates
COVID-19 has impacted the expected mortality patterns of the Canadian population, affecting some provinces and territories more than others. Since data sources are available which can better reflect the experiences of the pandemic, the DEP has decided to incorporate those sources into the second quarter estimates.
The DEP strategy
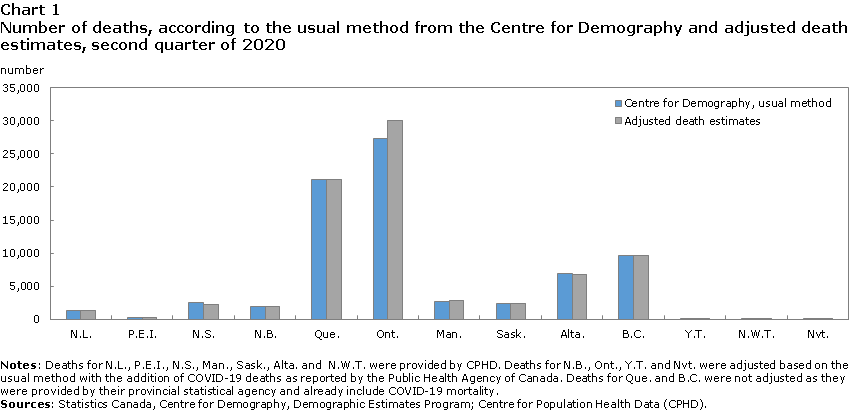
The DEP has adopted a hybrid approach for producing deaths estimates for the second quarter (see Chart 1). The approach is threefold:
- Use CPHD provisional death counts where possible
As of the deadline for supplying data to the DEP (August 18, 2020), CPHD provisional death counts were available for the provinces and territories of Newfoundland and Labrador, Prince Edward Island, Nova Scotia, Manitoba, Saskatchewan, Alberta, and the Northwest Territories.Note The data provided by CPHD therefore replaced the DEP estimates for these regions. - Use estimates from the DEP usual method, adding in COVID-19 deaths on the basis PHAC information
For the provinces and territories of New Brunswick, Ontario, Yukon, and Nunavut, the number of deaths estimated by CPHD were not available as of August 18, 2020. Therefore, the number of deaths for these regions were calculated using the usual method of the DEP. To account for the excess deaths resulting from the COVID-19 pandemic, the total number of deaths per month as reported by PHAC were added to these estimates. - For the provinces of Quebec and British Columbia, use death counts provided by the ISQ and BC Stats
Since these death counts come directly from the provisional statistical agencies and are based on death registrations, they already include COVID-19 related deaths and were not adjusted. The inclusion of COVID-19 deaths was confirmed by both statistical agencies.
Data table for Chart 1
| Region | Centre for Demography, usual method | Adjusted death estimates |
|---|---|---|
| number | ||
| Newfoundland and Labrador | 1,344 | 1,328 |
| Prince Edward Island | 357 | 351 |
| Nova Scotia | 2,496 | 2,296 |
| New Brunswick | 2,002 | 2,004 |
| Quebec | 21,150 | 21,150 |
| Ontario | 27,341 | 29,980 |
| Manitoba | 2,703 | 2,826 |
| Saskatchewan | 2,361 | 2,419 |
| Alberta | 6,874 | 6,834 |
| British Columbia | 9,686 | 9,686 |
| Yukon | 55 | 55 |
| Northwest Territories | 71 | 73 |
| Nunavut | 48 | 48 |
|
Notes: Deaths for Newfoundland and Labrador, Prince Edward Island, Nova Scotia, Manitoba, Saskatchewan, Alberta and Northwest Territories were provided by CPHD. Deaths for New Brunswick, Ontario, Yukon and Nunavut were adjusted based on the usual method with the addition of COVID-19 deaths as reported by the Public Health Agency of Canada. Deaths for Quebec and British Columbia were not adjusted as they were provided by their provincial statistical agency and already include COVID-19 mortality. Sources: Statistics Canada, Centre for Demography, Demographic Estimates Program; Centre for Population Health Data (CPHD). |
||
Age and sex distribution
Deaths from COVID-19 tend to occur at slightly higher ages than the normal age distribution of deaths (see Table 1).Note In order to account for this, the deaths estimates were disaggregated into expected mortality (what would have occurred in the absence of the pandemic) and excess mortality (deaths attributable to the pandemic). The age- and sex-distribution of COVID-19 deaths as reported by PHAC were applied to the portion of the deaths estimates deemed to be excess mortality, while the normal age- and sex-distribution was applied to the expected mortality pattern.
| Age group | Public Health Agency of Canada, COVID-19 deaths | Centre for Demography, deaths estimates, usual method |
|---|---|---|
| percent | ||
| 0 to 19 years | 0.0 | 1.1 |
| 20 to 29 years | 0.1 | 1.1 |
| 30 to 39 years | 0.2 | 1.6 |
| 40 to 49 years | 0.6 | 2.6 |
| 50 to 59 years | 2.4 | 7.0 |
| 60 to 69 years | 7.2 | 14.5 |
| 70 to 79 years | 18.2 | 22.4 |
| 80 years and older | 71.5 | 49.7 |
|
Notes: Does not sum to 100% due to rounding. Public Health Agency of Canada age structure was obtained from their website (https://health-infobase.canada.ca/covid-19/epidemiological-summary-covid-19-cases.html) on August 12, 2020 and includes all deaths from the beginning of the pandemic in March 2020 until that date. The age structure of death estimates for 2019/2020 from the Centre for Demography, usual method was calculated using adjusted deaths estimates. Sources: Statistics Canada, Centre for Demography, Demographic Estimates Program. Public Health Agency of Canada. |
||
Adjustment strategies under consideration for third quarter 2020 estimates
The DEP will continue to work closely with the CPHD in order to obtain timely provisional death counts, which will be integrated into future releases of the population estimates. Further, the DEP will continue to monitor potential developments in the pandemic situation through press reviews and the examination of scientific literature.
Immigrants and non-permanent residents
Context
The spread of COVID-19 has spurred the federal government to implement a number of measures that directly affect the number of immigrants and non-permanent residents in Canada.
Usual method
Immigration, Refugees and Citizenship Canada (IRCC) collects and processes the administrative records of immigrants and non-permanent residents (NPR). They provide the information to Statistics Canada on a monthly basis. The data are very timely: when a month ends, IRCC sends the new data to Statistics Canada three weeks later.
For immigrants, the permanent resident landing file is used to estimate the number and characteristics of people who received permanent resident status from the federal government for a given period.
For NPRs, the required files include work permits, study permits, other permits, refugee claims, permanent resident landing, applications for permanent residence and removals. This information is used to estimate the number and characteristics of individuals to whom the federal government grants non-permanent resident status. For refugee claimants, it is assumed that they will leave the country two years after their last communication with IRCC, while for permit holders, the assumption that they are in Canada for the entire duration of their permit is made. The current known limit for measuring NPRs therefore remains the same in the context of COVID-19: there is no way of knowing when NPRs leave the country.
Relevant considerations in the context of COVID-19
In regards to the circumstances relating to travel to Canada, there have been no changes in this quarter compared to the previous quarter: the Canadian government issued border restrictions for discretionary travel (tourism, recreation, entertainment).Note
As a result, two orders in council were signed and were valid for the entire quarter: the first involved closing the Canada–U.S. border to all non-essential traffic,Note while the second was aimed at all countries other than the United States.Note
Then, IRCC also faced operational challenges. The pandemic led to staff reductions and office closures both inside and outside the country, which limited its ability to examine and process claims (applications, renewals, etc.) within the usual timelines. In the second quarter of 2020, IRCC had to make adjustments to move most of its operations online.
The repercussions of the restrictions on the entry of immigrants and non-permanent residents into the country and the pandemic-induced administrative delays at IRCC in the second quarter of 2020 can be summarized as follows:
- Individuals who already had permanent resident status or had confirmation of permanent residency could enter Canada;Note
- Only temporary workers coming for essential purposes as well as certain individuals who could work without a permit were exempt from the travel restrictions;Note
- International students were exempt from travel restrictions and could enter Canada if they were travelling for an essential purpose, and:
- they had a valid study permit, or;
- they had received a study permit on or before March 18, 2020, or;
- they were travelling from the United States.Note
- Asylum claimants were prohibited from entering Canada from the United States, with some exceptions;Note
- All other information about permit renewals, applications, and additional stays granted by IRCC in response to the pandemic can be found in the COVID-19 section of the IRCC website.Note
Factors justifying the decision to not adjust immigrant and NPR estimates
Since the data from the IRCC files follow the same trends that are consistent with the COVID-19 calendar and the related restrictions, no adjustments to the usual method were deemed necessary.
Immigrants
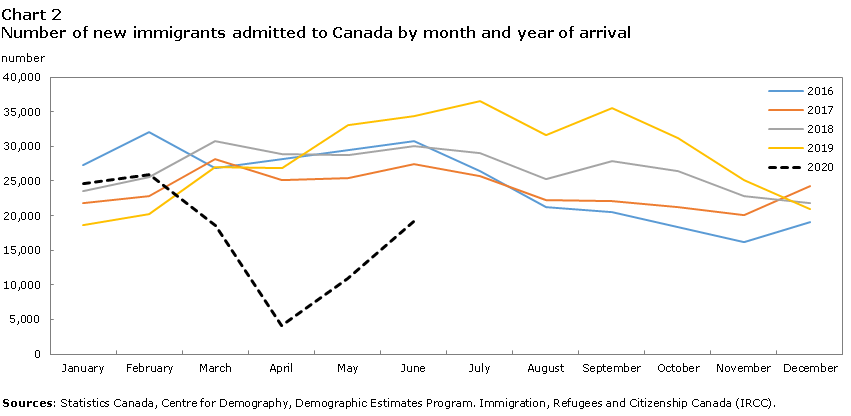
Chart 2 shows the impact of COVID-19 starting in March and for the entire second quarter of 2020: the number of landed immigrants fell in March, reached a low in April, and gradually rebounded in May and June. It should be noted that future permanent residents receive confirmation of permanent residency by mail and then go to a point of entry in Canada. It is at that point that they appear in the immigration data used by the Demographic Estimates Program (DEP). It is plausible that many future immigrants postponed coming to Canada due to the pandemic. Moreover, IRCC experienced operational delays and office closures in Canada and abroad.
Data table for Chart 2
| Month | 2016 | 2017 | 2018 | 2019 | 2020 |
|---|---|---|---|---|---|
| number | |||||
| January | 27,283 | 21,891 | 23,549 | 18,647 | 24,696 |
| February | 32,040 | 22,827 | 25,645 | 20,250 | 25,899 |
| March | 26,924 | 28,121 | 30,813 | 27,060 | 18,567 |
| April | 28,127 | 25,119 | 28,825 | 26,899 | 4,135 |
| May | 29,463 | 25,431 | 28,784 | 33,017 | 10,954 |
| June | 30,712 | 27,462 | 30,070 | 34,365 | 19,182 |
| July | 26,490 | 25,760 | 29,044 | 36,617 | Note ...: not applicable |
| August | 21,273 | 22,201 | 25,316 | 31,587 | Note ...: not applicable |
| September | 20,479 | 22,148 | 27,923 | 35,515 | Note ...: not applicable |
| October | 18,320 | 21,176 | 26,396 | 31,238 | Note ...: not applicable |
| November | 16,208 | 20,142 | 22,877 | 25,080 | Note ...: not applicable |
| December | 19,086 | 24,212 | 21,807 | 20,917 | Note ...: not applicable |
|
... not applicable Sources: Statistics Canada, Centre for Demography, Demographic Estimates Program. Immigration, Refugees and Citizenship Canada (IRCC). |
|||||
Non-permanent residents (NPR)
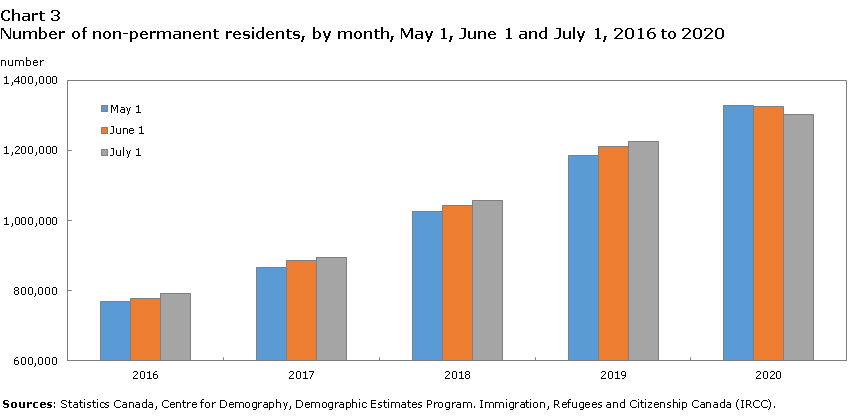
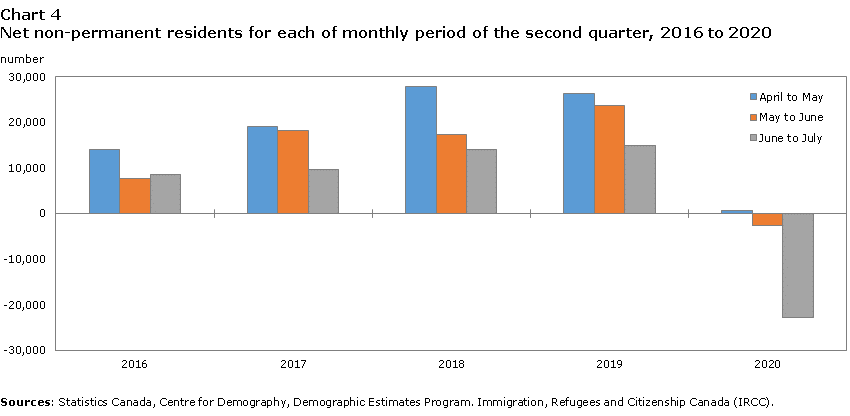
The declining numbers of NPRs during each of the three months of the second quarter of 2020 are presumably linked to the pandemic and its repercussions on the border closures and IRCC operations. These declines are mostly driven by the fact that fewer permits came became effective in April, May and June, the opposite of what has been observed over the last four years (see Charts 3 and 4).
Data table for Chart 3
| Month | 2016 | 2017 | 2018 | 2019 | 2020 |
|---|---|---|---|---|---|
| number | |||||
| May 1 | 769,457 | 866,419 | 1,025,154 | 1,186,426 | 1,327,783 |
| June 1 | 777,122 | 884,599 | 1,042,438 | 1,210,155 | 1,325,123 |
| July 1 | 790,931 | 894,174 | 1,056,464 | 1,225,126 | 1,302,298 |
| Sources: Statistics Canada, Centre for Demography, Demographic Estimates Program. Immigration, Refugees and Citizenship Canada (IRCC). | |||||
Data table for Chart 4
| Period | 2016 | 2017 | 2018 | 2019 | 2020 |
|---|---|---|---|---|---|
| number | |||||
| April to May | 14,028 | 19,124 | 27,919 | 26,354 | 717 |
| May to June | 7,665 | 18,180 | 17,284 | 23,729 | -2,660 |
| June to July | 8,562 | 9,575 | 14,026 | 14,971 | -22,825 |
| Sources: Statistics Canada, Centre for Demography, Demographic Estimates Program. Immigration, Refugees and Citizenship Canada (IRCC). | |||||
Adjustment strategies under consideration for third quarter of 2020 estimates
Due to the very current nature of the data received by IRCC, no specific adjustments are planned to the usual methods. The assumptions required to model border entry and exit of immigrants and non-permanent residents remain the same.
Emigration components
Context
As with the first quarter of 2020, preliminary estimates of the number of emigrants, returning emigrants and net temporary emigrants require adjustments to better reflect the sudden changes in trends due to the COVID-19 pandemic.
Usual methods
The Demographic Estimates Program (DEP) calculates estimates of the number of emigrants, returning emigrants and net temporary emigrants each quarter. In all three cases, the DEP measures migration that results in a change in individuals’ usual country of residence.
The preliminary estimates of the number of emigrants and returning emigrants are based on annual data from the Canada Child Benefit (CCB) and on several adjustments. These adjustments correct the CCB data for coverage, bias in the likelihood of children registered for the CCB to migrate, and registration delays in those files. The estimates for these two components are modelled on the last annual CCB data deemed to be complete enough. To produce the preliminary estimates for the second quarter of 2020, CCB data from 2017/2018 are used.
The preliminary estimates of net temporary emigrants are produced using data from the 2016 Reverse Record Check (RRC), the 2016 Census and estimates of the number of returning emigrants from 2011 to 2016.
For these three components, the trends observed using the most recent data are expected to continue.
Relevant considerations in the context of COVID-19
The uncertainty caused by COVID-19 as well as the Canadian government’s appeals to its nationals are assumed to have encouraged return emigration and dampened emigration in March.
In the second quarter of 2020, tight restrictions on international travel and the sharp drop in the number of international flights and border crossings continued, not only in Canada but around the world (OECD 2020; Statistics Canada 2020). Consequently, it is assumed that this also translated into a considerable decline in the number of emigrants, returning emigrants and net temporary emigrants.
Factors behind the decision to adjust estimates of emigration components
As was the case in the first quarter of 2020, the current DEP models are also less suitable for the second quarter. The assumption that recent trends will continue is less valid due to abrupt changes in trends stemming from the COVID-19 situation.
DEP adjustment strategy
For the first quarter, the same adjustment was applied to the three emigration components. This adjustment was calculated using Frontier Counts (FC) data for airports with Primary Inspection Kiosks (PIKs).Note
For the second quarter, different adjustments were developed for each emigration component, using available data, to better reflect the reality of each component. These adjustments replace the initial ones calculated for the first quarter of 2020.
The adjustments for the preliminary emigration components are based on certain common assumptions:
- The final estimates for the three components are the best estimate of the level and seasonality;
- The level and seasonality of the updated and preliminary estimates of the three components are accurate enough in normal circumstances;
- The situation caused by COVID-19 had no effect on the three components in January and February 2020;
- The relative effect of the COVID-19 situation on the emigration components is the same in every province and territory as well as by age and sex.
Emigration
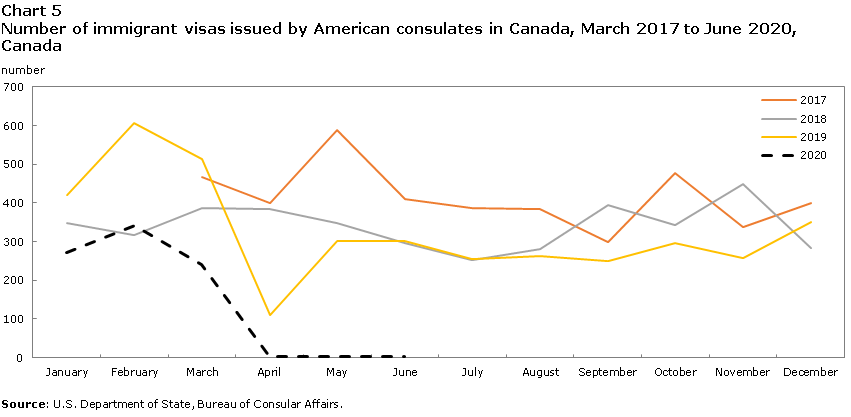
The adjustment for the preliminary estimates of the number of emigrants was developed using data on American visas issued by U.S. consulates in Canada.Note These data include visas issued to permanent residents, workers, students and other temporary residents; they exclude visas issued to visitors and tourists. Aggregate tables covering the period from March 2017 to June 2020 are available online and were used after consulting demographers at the U.S. Census Bureau. The United States is by far the main country of destination for Canadian emigrants, meaning that the data from that country provide a relatively representative picture of emigration (United Nations 2019). Only U.S. data on immigrant visas are used for the emigration adjustment.Note Two things about these data are worth mentioning. First, they refer to the date when the permit was issued, not when the permit holder crossed the border. Second, American citizens or individuals who already have permanent resident status are not included in these data, since they can emigrate to the United States without a visa.
Chart 5 shows the number of immigrant visas issued by U.S. consulates in Canada.
Data table for Chart 5
| Year | January | February | March | April | May | June | July | August | September | October | November | December |
|---|---|---|---|---|---|---|---|---|---|---|---|---|
| number | ||||||||||||
| 2017 | Note ...: not applicable | Note ...: not applicable | 467 | 399 | 590 | 409 | 388 | 385 | 300 | 478 | 337 | 399 |
| 2018 | 349 | 316 | 386 | 384 | 348 | 296 | 253 | 282 | 395 | 343 | 450 | 284 |
| 2019 | 420 | 606 | 515 | 111 | 302 | 302 | 255 | 263 | 251 | 297 | 258 | 352 |
| 2020 | 271 | 343 | 241 | 3 | 4 | 4 | Note ...: not applicable | Note ...: not applicable | Note ...: not applicable | Note ...: not applicable | Note ...: not applicable | Note ...: not applicable |
|
... not applicable Source: U.S. Department of State, Bureau of Consular Affairs. |
||||||||||||
The adjustment for the number of emigrants is based on the following assumptions:
- The seasonality of U.S. visas is a fairly accurate depiction of the reality from 2017 to 2020;
- The monthly ratio between emigrants based on U.S. visas and those from the DEP is sufficiently realistic between 2017 and 2019;
- This ratio did not change in 2020.
The adjustment involves applying the ratio derived from DEP and visa data to the visa data for the period requiring an adjustment. The method for adjusting estimates of the number of emigrants is done in three steps:
- Calculating the ratio between the number of emigrants from the DEP (EMI_DEP) and the number of immigrant visas issued by U.S. consulates in Canada (VISA) for month m and year y (2017 [except January and February, which are unavailable], 2018 and 2019 only). This ratio expresses the relationship between the two sources:
RAT(m,y) = EMI_DEP(m,y) / VISA(m,y);
- Calculating the average of the ratios for the same month m to produce the average monthly ratio, RAT_AVERAGE(m). This ratio represents the average relationship over the period studied;
- The monthly number of emigrants is estimated by applying the average monthly ratio to the immigrant visa data for the desired month:
EMI_DEP(m,2020) = RAT_AVERAGE(m) * VISA(m,2020).
Returning emigration
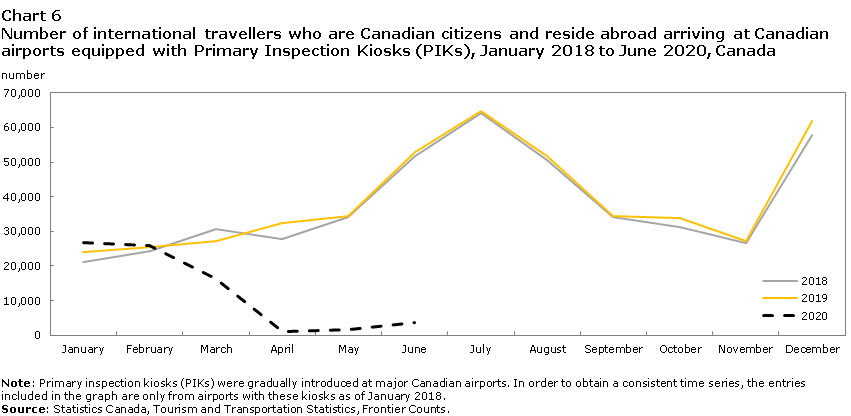
The adjustment for preliminary estimates of the number of returning emigrants is based on the FC data for airports with PIKs and data from the Global Affairs Canada’s Registration of Canadians Abroad (ROCA) service.
PIKs provide an electronic means for travellers arriving by commercial flights to report the information that would otherwise be collected on the E311 declaration card. In these data, potential returning emigrants can be defined as Canadian citizens who report living abroad when they arrive at a Canadian airport equipped with PIKs. Moreover, since FC data do not provide information on travellers’ intentions to live in Canada, they include returning emigrants as well as visitors. In addition, the FC program is not found in all Canadian airports and does not cover land or water border crossings.
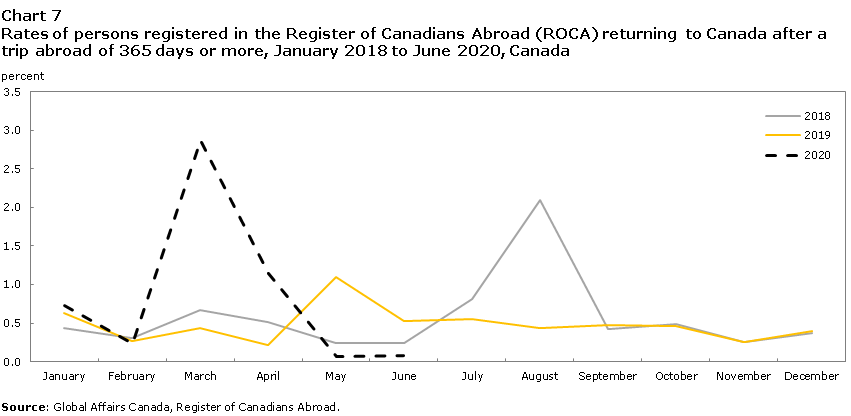
ROCA is a free service through which the Government of Canada notifies its nationals in the event of emergencies abroad or at home (e.g., a natural disaster or civil unrest).Note Travellers indicate the start and end dates of their trip abroad as well as the country of destination. This information can be used to calculate migrant stocks and flows based on certain assumptions.
Registered individuals returning from a trip abroad of 365 days or longer are considered to be returning emigrants, while those returning from a trip of 180 to 364 days are temporary returns.Note Registered individuals returning to Canada from a trip of less than 180 days are considered travellers and not migrants.
For returning emigrants and temporary returns, it is also assumed that the date of return to Canada in the ROCA is the actual date of returning emigration to Canada and that they intend to live in Canada permanently. Coverage of travellers and international migrants by the ROCA is incomplete and can fluctuate rapidly depending on international issues around the world. This volatility is considered in two ways. First, data from the ROCA are used in the form of monthly rates by dividing the numbers of returning emigrants by those of all persons abroad for 365 days or longer.Note Then, only persons registered on or before the date of their departure from Canada are included in calculating return rates.
Data from the ROCA are used with the idea that they can shed light on the number of returning emigrants among travellers from the FC data.
Charts 6 and 7 respectively show the number of international travellers who are Canadian citizens and who reported living abroad in Canadian airports equipped with PIKs and the monthly rates of persons registered with the ROCA who returned to Canada from a trip abroad of 365 days or longer.
Data table for Chart 6
| Year | January | February | March | April | May | June | July | August | September | October | November | December |
|---|---|---|---|---|---|---|---|---|---|---|---|---|
| number | ||||||||||||
| 2018 | 21,048 | 24,319 | 30,810 | 27,855 | 34,164 | 51,802 | 64,079 | 50,511 | 34,184 | 31,208 | 26,735 | 57,742 |
| 2019 | 23,998 | 25,329 | 27,304 | 32,447 | 34,317 | 52,983 | 64,809 | 51,896 | 34,326 | 33,806 | 27,108 | 61,912 |
| 2020 | 26,845 | 25,934 | 16,456 | 1,122 | 1,695 | 3,531 | Note ...: not applicable | Note ...: not applicable | Note ...: not applicable | Note ...: not applicable | Note ...: not applicable | Note ...: not applicable |
|
... not applicable Note: Primary inspection kiosks (PIKs) were gradually introduced at major Canadian airports. In order to obtain a consistent time series, the entries included in the graph are only from airports with these kiosks as of January 2018. Source: Statistics Canada, Tourism and Transportation Statistics, Frontier Counts. |
||||||||||||
Data table for Chart 7
| Year | January | February | March | April | May | June | July | August | September | October | November | December |
|---|---|---|---|---|---|---|---|---|---|---|---|---|
| percent | ||||||||||||
| 2018 | 0.4 | 0.3 | 0.7 | 0.5 | 0.2 | 0.2 | 0.8 | 2.1 | 0.4 | 0.5 | 0.3 | 0.4 |
| 2019 | 0.6 | 0.3 | 0.4 | 0.2 | 1.1 | 0.5 | 0.6 | 0.4 | 0.5 | 0.5 | 0.3 | 0.4 |
| 2020 | 0.7 | 0.2 | 2.9 | 1.1 | 0.1 | 0.1 | Note ...: not applicable | Note ...: not applicable | Note ...: not applicable | Note ...: not applicable | Note ...: not applicable | Note ...: not applicable |
|
... not applicable Source: Global Affairs Canada, Register of Canadians Abroad. |
||||||||||||
The adjustment for the number of returning emigrants relies on the following assumptions:
- The seasonality of combined data from the FC and the ROCA is sufficiently realistic from 2018 to 2020;
- The monthly ratio between returning emigrants from the FC data and those from the DEP is sufficiently realistic in 2018 and 2019;
- This ratio did not change in 2020;
- Using returning emigration rates from the ROCA makes it possible to sufficiently account for changes in the profile of travellers from the FC data.
The adjustment consists of two main steps. First, the relationship between the DEP and FC data is applied to the FC data for the period requiring an adjustment. Second, monthly changes in returning emigration rates from the ROCA signal changes in the profile of travellers from the FC data. Recall that the FC data used here include returning emigrants as well as travellers.
More specifically, the method for adjusting estimates of the number of emigrants is done as follows:
- The ratio of returning emigrants from the DEP (RET_DEP) and from FC data (RET_FC) for month m and year y (2018 and 2019 only) is calculated. This ratio expresses the relationship between the two sources:
RAT(m,y) = RET_DEP / RET_FC;
- The average of the two ratios for the same month m is calculated to obtain RAT_AVERAGE(m). This ratio represents the average relationship over the period under study;
- The average ratio (RAT_AVERAGE) is applied to the FC data for the desired month to obtain the expected number of returning emigrants based on FC data (RET_DEP_FC):
RET_DEP_FC(m, 2020) = RAT_AVERAGE(m) * RET_FC(m, 2020);
- The average of the returning emigration rates (RATE_ROCA) for the same month m from ROCA is calculated to obtain RATE_ROCA_AVE(m) (2018 and 2019 only). This factor signals the average likelihood of registered persons to return to settle permanently in Canada;
- The ratio between the rate for the desired month and the average rate for the same month is calculated to obtain the variation in the likelihood of returning emigration. This ratio expresses the change in returning emigration trends observed in the ROCA in 2020 compared with previous years:
VAR_RATE_ROCA(m, 2020) = RATE_ROCA(m, 2020) / RATE_ROCA_AVE(m);
- The variation in the likelihood of returning emigration from the ROCA(VAR_RATE_ROCA) is applied to the expected number of returning emigrants from the FC data (RET_DEP_FC) to obtain estimates of the number of returning emigrants for the desired month:
RETEMI_DEP(m,2020) = RET_DEP_FC(m, 2020) * VAR_RATE_ROCA(m, 2020).
Net temporary emigration
Net temporary emigration consists of temporary departures and returns. These temporary migrations can be estimated separately for each month based on the data used to calculate net temporary emigration. Recall that data from the 2016 Census and RRC as well as from the DEP from 2011 to 2016 are used to extrapolate net temporary emigration from 2016.
The adjustment for net temporary emigration relies on the following assumptions:
- The numbers of temporary departures and returns are estimated well enough based on net temporary emigration for each month;
- The adjustments made to estimates of the number of emigrants and returning emigrants are accurate enough for temporary departures and returns.
Monthly estimates of the number of temporary departures are obtained by applying the relationship between temporary departures and net temporary emigration to the estimates of net temporary emigration for the period requiring an adjustment. The approach is as follows:
- The ratio between temporary exits (DEPART_TEMP) from 2016 RRC data and net temporary emigration for 2011–2016 (NET_TEMP) is calculated. This ratio represents the relationship between temporary exits and net temporary emigration:
RATIO_DEPART_NET_TEMP = DEPART_TEMP(2016 RRC) / NET_TEMP(2011–2016);
- The ratio is applied to the estimates of net temporary emigration for year y and month m to obtain the estimate of the number of temporary departures for that period:
DEPART_TEMP(y,m) = RATIO_DEPART_NET_TEMP * NET_TEMP(y,m).
The same approach is used to estimate the monthly number of temporary returns. Then, monthly estimates of the number of temporary departures and returns can be adjusted for the COVID-19 situation.
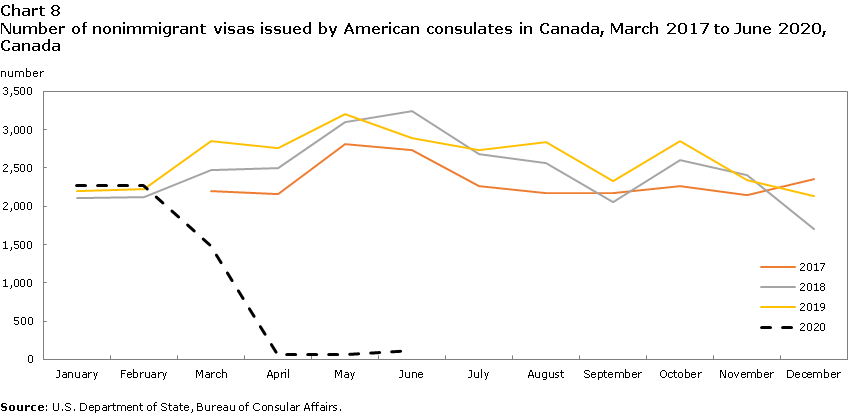
Estimates of the number of temporary departures are adjusted in the same way as those of the number of emigrants. The only difference is that non-immigrant visas from U.S. data are used instead of immigrant visas.
Similarly, estimates of the number of temporary returns are adjusted in the same way as estimates of the number of returning emigrants. The only differences are that:
- The ratio between FC data and DEP data is obtained using temporary returns from the DEP; and
- Persons registered with the ROCA who were abroad from 180 to 364 days are used to calculate the adjustment rather than those who were abroad for 365 days or longer.Note
Finally, the adjustment for net temporary emigration is calculated using the adjusted estimates of temporary departures and returns.
Charts 8 and 9 respectively show the number of non-immigrant visas issued by U.S. consulates in Canada and the return rates of persons registered with the ROCA who returned to Canada from a trip abroad of 180 to 364 days.
Data table for Chart 8
| Year | January | February | March | April | May | June | July | August | September | October | November | December |
|---|---|---|---|---|---|---|---|---|---|---|---|---|
| number | ||||||||||||
| 2017 | Note ...: not applicable | Note ...: not applicable | 2,193 | 2,160 | 2,815 | 2,738 | 2,264 | 2,177 | 2,170 | 2,260 | 2,146 | 2,360 |
| 2018 | 2,102 | 2,127 | 2,469 | 2,494 | 3,103 | 3,238 | 2,684 | 2,569 | 2,053 | 2,610 | 2,405 | 1,708 |
| 2019 | 2,201 | 2,221 | 2,848 | 2,761 | 3,204 | 2,890 | 2,741 | 2,839 | 2,329 | 2,848 | 2,346 | 2,132 |
| 2020 | 2,269 | 2,275 | 1,491 | 64 | 70 | 114 | Note ...: not applicable | Note ...: not applicable | Note ...: not applicable | Note ...: not applicable | Note ...: not applicable | Note ...: not applicable |
|
... not applicable Source: U.S. Department of State, Bureau of Consular Affairs. |
||||||||||||
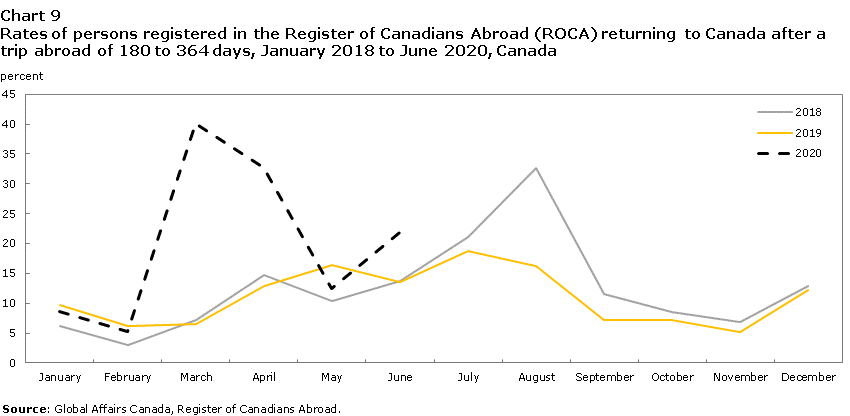
Data table for Chart 9
| Year | January | February | March | April | May | June | July | August | September | October | November | December |
|---|---|---|---|---|---|---|---|---|---|---|---|---|
| percent | ||||||||||||
| 2018 | 6.2 | 3.0 | 7.2 | 14.7 | 10.5 | 13.8 | 21.2 | 32.6 | 11.5 | 8.5 | 6.8 | 12.9 |
| 2019 | 9.6 | 6.2 | 6.5 | 12.9 | 16.4 | 13.6 | 18.8 | 16.3 | 7.3 | 7.2 | 5.2 | 12.3 |
| 2020 | 8.7 | 5.3 | 40.1 | 32.7 | 12.4 | 21.9 | Note ...: not applicable | Note ...: not applicable | Note ...: not applicable | Note ...: not applicable | Note ...: not applicable | Note ...: not applicable |
|
... not applicable Source: Global Affairs Canada, Register of Canadians Abroad. |
||||||||||||
Results
For the first quarter of 2020, the adjustments made to the three emigration components result in an increase in returning emigration and a decrease in emigration and net temporary emigration compared with the usual methods. For the second quarter, the adjustments result in significant decreases for the three emigration components. Tables 1 and 2 show estimates for the three components according to the usual methods and according to the adjusted methods for the first two quarters of 2020.
| Region | Emigrants | Returning emigrants | Net temporary emigrants | |||
|---|---|---|---|---|---|---|
| Usual method | Adjusted method | Usual method | Adjusted method | Usual method | Adjusted method | |
| number | ||||||
| Canada | 12,485 | 11,109 | 5,577 | 10,040 | 6,877 | 4,263 |
| N.L. | 36 | 31 | 19 | 34 | 36 | 23 |
| P.E.I. | 10 | 9 | 7 | 13 | 11 | 7 |
| N.S. | 238 | 208 | 85 | 153 | 64 | 40 |
| N.B. | 130 | 114 | 53 | 97 | 52 | 32 |
| Que. | 1,554 | 1,382 | 773 | 1,391 | 1,158 | 718 |
| Ont. | 5,853 | 5,228 | 2,808 | 5,054 | 3,397 | 2,107 |
| Man. | 244 | 215 | 154 | 278 | 90 | 55 |
| Sask. | 188 | 174 | 97 | 175 | 125 | 77 |
| Alta. | 1,452 | 1,270 | 713 | 1,283 | 572 | 354 |
| B.C. | 2,770 | 2,468 | 865 | 1,557 | 1,350 | 837 |
| Y.T. | 5 | 5 | 0 | 0 | 7 | 4 |
| N.W.T. | 5 | 5 | 3 | 5 | 8 | 5 |
| Nvt. | 0 | 0 | 0 | 0 | 7 | 4 |
| Source: Statistics Canada, Centre for Demography, Demographic Estimates Program. | ||||||
| Region | Emigrants | Returning emigrants | Net temporary emigrants | |||
|---|---|---|---|---|---|---|
| Usual method | Adjusted method | Usual method | Adjusted method | Usual method | Adjusted method | |
| number | ||||||
| Canada | 11,664 | 141 | 11,376 | 413 | 6,658 | 75 |
| N.L. | 38 | 0 | 41 | 1 | 36 | 0 |
| P.E.I. | 13 | 0 | 16 | 0 | 10 | 0 |
| N.S. | 249 | 3 | 171 | 6 | 63 | 0 |
| N.B. | 144 | 2 | 111 | 4 | 50 | 0 |
| Que. | 1,737 | 21 | 1,576 | 58 | 1,120 | 12 |
| Ont. | 4,933 | 60 | 5,729 | 209 | 3,287 | 39 |
| Man. | 344 | 4 | 313 | 11 | 86 | 0 |
| Sask. | 188 | 2 | 197 | 7 | 122 | 2 |
| Alta. | 1,551 | 19 | 1,454 | 53 | 554 | 7 |
| B.C. | 2,456 | 30 | 1,763 | 64 | 1,307 | 15 |
| Y.T. | 7 | 0 | 0 | 0 | 7 | 0 |
| N.W.T. | 4 | 0 | 5 | 0 | 9 | 0 |
| Nvt. | 0 | 0 | 0 | 0 | 7 | 0 |
| Source: Statistics Canada, Centre for Demography, Demographic Estimates Program. | ||||||
Adjustment strategies under consideration for third quarter of 2020 estimates
Restrictions on international travel continued for at least part of the third quarter. As a result, adjustments should still be necessary. The DEP is evaluating various approaches, such as:
- Further exploring the data from the ROCA, the FC and the CCB which were evaluated for the adjustments for the first two quarters;
- Continuing methodological and data exchanges with demographers at the U.S. Census Bureau and other experts on international migration statistics;
- Considering other alternate sources such as changes of address with Canada Post and IRCC data;
- Monitoring developments, including press reviews and scientific monitoring.
Interprovincial migration
Context
In the context of the COVID-19 pandemic, the internal mobility of Canadians is expected to be disrupted. The data used in the normal production process of the Demographic Estimates Program (DEP), as well as data from alternate sources, confirm a general decline in the intensity of interprovincial migration in the second quarter of 2020 compared with previous years.
Usual Method
Each month, the Canada Revenue Agency (CRA) provides Statistics Canada with data from the Canada Child Benefit (CCB) program, from which information can be derived on the usual province or territory of residence of children registered for the CCB program. Comparing microdata files at the beginning and at the end of the period under study helps to estimate the preliminary monthly, quarterly and annual interprovincial migration. Adjustment factors are used to reflect the program’s partial coverage, the differential propensity of children registered for the CCB to migrate and the differential propensity of adults versus children to migrate. Estimates of adults migrating across provincial or territorial boundaries are produced by calculating modelled migration ratios of adults to children, using the most recent tax data. Estimates of in-migrants, out-migrants and net interprovincial migration, and an origin–destination matrix by province or territory are published each quarter.
Relevant considerations in the context of COVID-19
To ensure that interprovincial migration estimates for the second quarter of 2020 calculated with the CCB reflect the changes expected in the context of COVID-19, two alternate data sources were acquired and evaluated. First, Statistics Canada has databases containing driver’s licence information, which are provided monthly by the provinces and territories. Comparing the addresses of driver’s licence holders between the monthly databases made it possible to estimate the intensity of intraprovincial migration at the economic region level. Since the timeliness of the databases is variable, only the provinces and territories for which data were available for the same month in 2019 and 2020 were included in the analysis.Note
Statistics Canada also obtained aggregate data from Canada Post’s mail forwarding program. These data contain monthly counts of private households that requested mail forwarding after a move, by province or territory of origin and destination. These matrices made it possible to calculate changes in the intensity of interprovincial migration between the quarters of 2019 and 2020.
Since the data sources do not measure the same concept, they are not strictly comparable among themselves. The Canada Post data measure the interprovincial migrations of households. Also, the driver’s licence data measure the migrations of driver’s licence holders between economic regions in the same province or territory. Finally, the CRA data used by the usual DEP method measure the interprovincial migrations of persons, where the migrations of adults are modelled on those of children. For comparability purposes, the indicator used in this analysis is the variation in the intensity of migration for the same data source.
Evaluation of mobility
Chart 10 compares changes in interprovincial and intraprovincial mobility between the first quarter of 2019 and that of 2020 and between the second quarter of 2019 and that of 2020, based on the three data sources. In the first quarter of 2020, the three data sources showed changes in mobility of less than 10% compared with the first quarter of 2019. However, in the second quarter of 2020, the data showed a decrease in mobility ranging from -13% (Canada Post) to -23% (driver’s licences). The DEP estimates of interprovincial migration calculated with the usual method fell in the middle of this range, with a decrease of -18%.
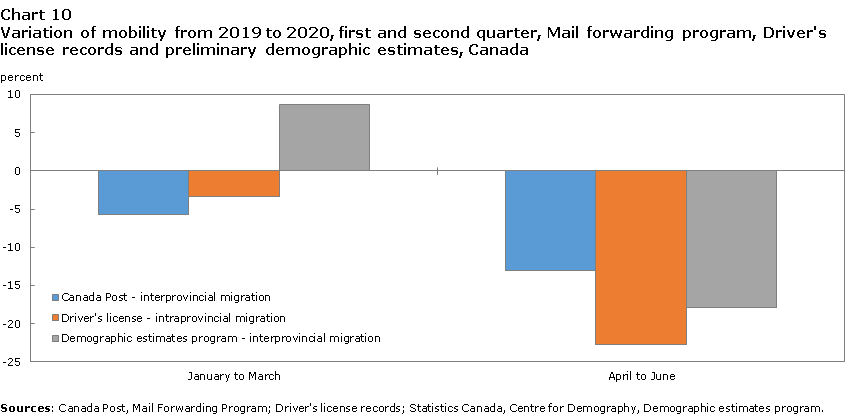
Data table for Chart 10
| Data source | January to March | April to June |
|---|---|---|
| percent | ||
| Canada Post - interprovincial migration | -5.7 | -13.1 |
| Driver's license - intraprovincial migration | -3.3 | -22.8 |
| Demographic estimates program - interprovincial migration | 8.6 | -17.9 |
| Sources: Canada Post, Mail Forwarding Program; Driver's license records; Statistics Canada, Centre for Demography, Demographic estimates program. | ||
According to both the Canada Post data and the data related to the usual DEP method, the decrease in the number of interprovincial in-migrants and out-migrants in the second quarter was generalized across provinces and territories (see Charts 11 and 12). Only in-migrants to Nunavut posted an increase (+16%) according to the usual DEP method. In addition, changes were similar from one source to another, with differences of less than 10 percentage points in most provinces and territories, among both in-migrants and out-migrants.
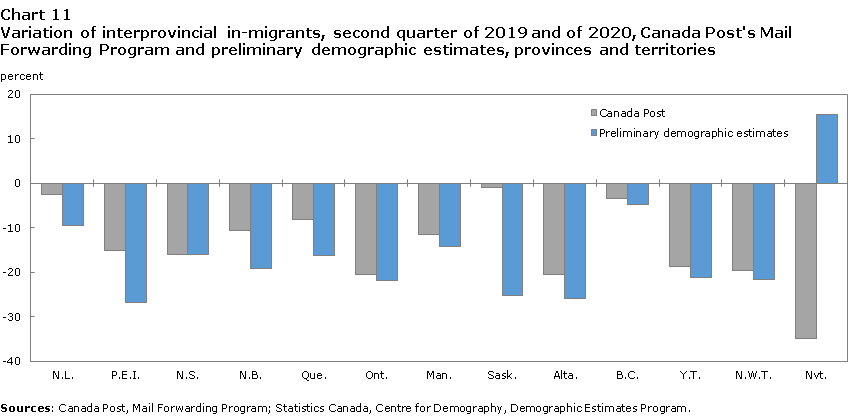
Data table for Chart 11
| Data source | N.L. | P.E.I. | N.S. | N.B. | Que. | Ont. | Man. | Sask. | Alta. | B.C. | Y.T. | N.W.T. | Nvt. |
|---|---|---|---|---|---|---|---|---|---|---|---|---|---|
| percent | |||||||||||||
| Canada Post | -2.4 | -15.0 | -16.0 | -10.7 | -8.1 | -20.5 | -11.5 | -0.9 | -20.5 | -3.3 | -18.6 | -19.7 | -35.0 |
| Preliminary demographic estimates | -9.6 | -26.7 | -16.1 | -19.1 | -16.2 | -21.8 | -14.3 | -25.2 | -26.0 | -4.7 | -21.2 | -21.7 | 15.5 |
| Sources: Canada Post, Mail Forwarding Program; Statistics Canada, Centre for Demography, Demographic Estimates Program. | |||||||||||||
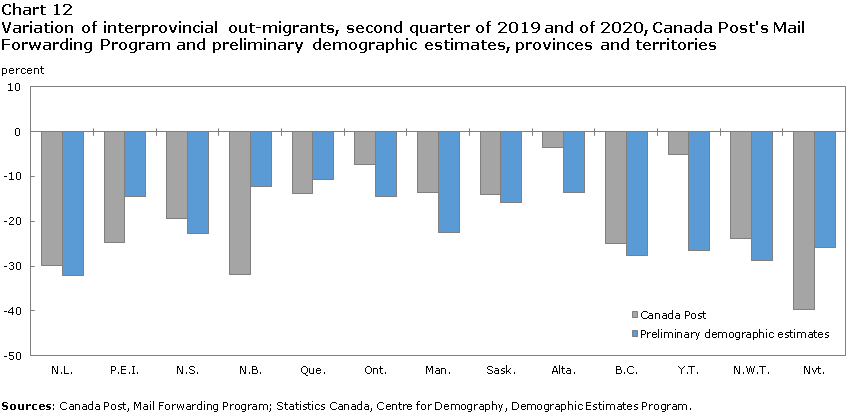
Data table for Chart 12
| Data source | N.L. | P.E.I. | N.S. | N.B. | Que. | Ont. | Man. | Sask. | Alta. | B.C. | Y.T. | N.W.T. | Nvt. |
|---|---|---|---|---|---|---|---|---|---|---|---|---|---|
| percent | |||||||||||||
| Canada Post | -29.9 | -24.8 | -19.3 | -31.9 | -13.8 | -7.3 | -13.6 | -14.1 | -3.5 | -24.9 | -5.2 | -23.9 | -39.7 |
| Preliminary demographic estimates | -32.2 | -14.6 | -22.7 | -12.2 | -10.6 | -14.4 | -22.5 | -15.8 | -13.5 | -27.7 | -26.6 | -28.7 | -25.9 |
| Sources: Canada Post, Mail Forwarding Program; Statistics Canada, Centre for Demography, Demographic Estimates Program. | |||||||||||||
Factors justifying the decision not to adjust the interprovincial migration estimates
A decrease in internal mobility in Canada during the second quarter of 2020 was captured by the three data sources studied, as expected in the context of COVID-19. The DEP estimates calculated using the usual method showed a decrease in the intensity of interprovincial migration similar to those shown by the Canada Post data, for most provinces and territories. Since the extent and direction of the changes observed in estimates of interprovincial migration according to the usual method were validated by alternate data sources, the DEP decided not to make any adjustments.
Strategies for the third quarter of 2020 estimates
- Monitor developments in the field based on press reviews and scientific monitoring;
- Further analyze monthly and quarterly mobility based on provincial driver’s licence microdata files and aggregate data provided by Canada Post.
Conclusion
The DEP will continue to closely monitor all aspects of the COVID-19 pandemic that may affect the demographic behaviours of the Canadian population. With the possible arrival of a second wave of the COVID-19 pandemic during the months covered by the third and the fourth quarters of 2020, adjustments may continue to be necessary. The DEP is dedicated in continuing being responsive to the rapidly evolving situation of the global pandemic by releasing meaningful and reliable estimates. Another copy of this technical supplement will therefore accompany the release of the next quarter's population estimates in the event the situation justifies it.
Sources
Aassve, A., N. Cavalli, L. Mencarini, S. Plach and M. Livi Bacci. 2020. “The COVID-19 Pandemic and Human Fertility”. Science. July 24, 2020. Volume 369, number 6502. Pages 370-371.
Balbo, N., I. Kashnitsky, A. Melegaro, F. Meslé, M.C. Mills, H.A.G. de Valk and D. Vono de Vilhena. 2020. “Demography and the Coronavirus Pandemic”. Population & Policy Compact 25. Berlin: Max Planck Society/Population Europe.
Centres for Disease Control and Prevention (CDC). 2020. Data on COVID-19 during Pregnancy. Updated August 19, 2020.
Ellington, S., P. Strid, V.T. Tong, K. Woodworth, R.R. Galang, L.D. Zambrano, J. Nahabedian, K. Anderson and S.M. Gilboa. 2020. “Characteristics of Women of Reproductive Age with Laboratory-Confirmed SARS-CoV-2 Infection by Pregnancy Status — United States, January 22–June 7, 2020”. Morbidity and Mortality Weekly Report. Centres for Disease Control and Prevention. June 26, 2020. Volume 69, number 25. Pages 769–775.
Kearney, M.S. and P.B. Levine. 2020. Half a Million Fewer Children? The Coming COVID Baby Bust. Brookings Institution. Washington, D.C. June 15, 2020.
Lindberg, L.D., A. VandeVusse, J. Mueller and M. Kirstein. 2020. “Early Impacts of the COVID-19 Pandemic: Findings from the 2020 Guttmacher Survey of Reproductive Health Experiences”. New York. Guttmacher Institute. June 2020.
Luppi, F., B. Arpino and A. Rosina. 2020. “The Impact of COVID-19 on Fertility Plans in Italy, Germany, France, Spain and UK”. SocArXiv Papers. May 22, 2020.
Matysiak, A., T. Sobotka and D. Vignoli. 2020. “The Great Recession and Fertility in Europe: A Sub-national Analysis”. European Journal of Population.
OECD. 2020. “Managing international migration under COVID-19”. OECD Policy Responses to Coronavirus (COVID-19). June 10, 2020. 19 pages.
Phoswa, W.N. and O.P. Khaliq. 2020. “Is Pregnancy a Risk Factor of COVID-19?”. European Journal of Obstetrics & Gynecology and Reproductive Biology. June 27, 2020.
Prabhu, M., K. Cagino, K.C. Matthews, R.L. Friedlander, S.M. Glynn, J.M. Kubiak, Y.J. Yang, Z. Zhao, R.N. Baergen, J.I. DiPace, A.S. Razavi, D.W. Skupski, J.R. Snyder, H.K. Singh, R.B. Kalish, C.M. Oxford and L.E. Riley. 2020. “Pregnancy and Postpartum Outcomes in a Universally Tested Population for SARS-CoV-2 in New York City: A Prospective Cohort Study”. BJOG: An International Journal of Obstetrics and Gynaecology. July 7, 2020. 10.1111/1471-0528.16403. Doi: 10.1111/1471-0528.16403. Online ahead of print.
Sobotka, T., V. Skirbekk and D. Philipov. 2011. “Economic Recession and Fertility in the Developed World”. Population and Development Review. Volume 37, number 2. Pages 267-306.
Statistics Canada. 2020. “Travel between Canada and other countries, May 2020”. The Daily. July 22, 2020.
United Nations. 2019. International Migrant Stock 2019. POP/DB/MIG/Stock/Rev.2019.
- Date modified: