
Demographic Documents
Technical Supplement: Production of Demographic Estimates for the First Quarter of 2020 in the Context of COVID-19

Archived Content
Information identified as archived is provided for reference, research or recordkeeping purposes. It is not subject to the Government of Canada Web Standards and has not been altered or updated since it was archived. Please "contact us" to request a format other than those available.
Skip to text
Text begins
Introduction
The production of demographic estimates is based on the use of several well-documentedNote methods that have been presented and discussed with the various partners and collaborators of the Demographic Estimates Program (DEP). These methods rely on administrative data sources that are not necessarily optimal in terms of timeliness, completeness and coverage. The models used in the production processes make it possible to produce reliable and accurate population estimates despite these constraints.
In the context of the COVID-19 pandemic, the resulting crisis may have invalidated some of the assumptions of the models used in the production of population estimates. The DEP is committed to continuing to produce demographic estimates of the best possible quality, even in the current pandemic context. To achieve this, the methods of estimation of each of the demographic components have been re-evaluated. Where necessary, adjustments have been made to the usual methods.
This document outlines the re-evaluation process that was conducted for each demographic component in the circumstances surrounding the emergence of the pandemic. The context and usual method are described for each component. Relevant considerations in reassessing the estimates for the first quarter of 2020 are then presented. Following this, the factors justifying the choice of whether or not to make an adjustment are presented, with a description of the adjustment if applicable. Finally, the strategies under consideration for the production of the estimates for the second quarter of 2020 are briefly discussed.
Births
Context
Given the social and economic disruptions associated with the COVID-19 pandemic, there may be fluctuations in the number of births in the near future. There are two schools of thought that support competing assumptions about the potential impact of the current crisis on fertility levels. Some specialists suggest that the lockdown measures may have led to an increase in intimate relations between couples, which would result in an increase in births nine months later. On the other hand, a majority of specialists agree that the climate of uncertainty and concern should instead lead to a decrease in fertility.
Usual method
For the final estimates, the number of births is derived directly from vital statistics provided by Statistics Canada’s Centre for Population Health Data. These are generally received within about two years of the estimates reference period.
For preliminary or updated estimates, the ratio method is used since vital statistics are not available when the estimates are produced. The number of births is estimated using fertility rates by the mother’s age group, which are based on the most recent year for which final estimates are available.
Relevant considerations in the context of COVID-19
- According to most experts, the economic uncertainty and concerns caused by the pandemic could reduce birth rates:
- “… uncertainty and scarcity are likely to reduce the birthrate as individuals, couples and families decide to delay, postpone or forego having a child” (Liz Allen, Australian National UniversityNote );
- “Economic uncertainty really impacts fertility”; “This is likely to lead to even further drops in fertility and births as well” (Rogelio Sáenz, University of TexasNote );
- “Many people in childbearing ages were already worried about their futures, and now they may face unemployment as well”; “That kind of anxiety is not conducive to having a child” (Jennifer Johnson-Hanks, University of CaliforniaNote );
- “A climate of fear is not psychologically ideal for becoming pregnant and there is currently quite a lot of tension”; “Economic crises are usually associated with a decline in births” (Richard Marcoux, Laval UniversityNote ).
- Existing scientific literature shows that, during economic upheavals, fertility has generally declined:
- During the Great Recession of 2008, fertility rates declined the most in regions where the labour market situation had deteriorated the most (Matysiak et al. 2020);
- During the 2008 economic crisis, demographers observed that young people in Europe postponed leaving the family home due to a precarious employment and housing situation. This means that children tend to live longer with their parents (Balbo et al. 2020).
- A review of several studies measuring the impact of economic recessions on fertility in developed countries has shown that, in general, fertility tends to follow economic cycles by following the same upward and downward trends. (Sobotka et al. 2011).
- Other secondary factors may have localized impacts on fertility rates in some segments of the population:
- Most fertility clinics had to close their doors for an extended period to comply with lockdown directives from various levels of government;Note
- The overseas adoption process has been interrupted due to the COVID-19 pandemic;Note
- It was harder to access family planning items and services and abortion clinics at the height of the pandemic.Note
Factors justifying the decision to not adjust birth estimates
Births in the first quarter of 2020 are the result of fertility behaviour nine months earlier, before the start of the pandemic. For this reason, no adjustments were made to the usual method for producing birth estimates in the first quarter of 2020.
Adjustment strategies under consideration for second quarter of 2020 estimates
If the current situation were to affect fertility rates, the effects would not be discernible before the end of the fourth quarter of 2020, nine months after the start of the COVID-19 pandemic. Therefore, no adjustments to birth estimates are planned for data from the second quarter of 2020.
Deaths
Context
COVID-19 came to Canada in January, 2020 with the first death being reported on March 9, 2020.Note According to PHAC, there were 96 COVID-19-related deaths in the first three months of the year (between March 9, 2020 and March 31, 2020). The Demographic Estimates Program (DEP) is considering how to take these deaths into account for the population estimates for the first quarter of 2020 (January 1, 2020 to March 31, 2020), although these 96 additional deaths will not make a significant difference to Canadian and provincial/territorial population estimates.
Usual method
To estimate the number of deaths for the first quarter of 2020, the DEP would normally rely on the usual method. Using this method, the age- and sex-specific mortality rates of the last quarter for which we have final data (quarter 1, 2017) are applied to the population at the beginning of the quarter (January 1, 2020, see Figure 1: “Centre for Demography, usual method”). Deaths for Quebec and British Columbia are not estimated, as they are provided directly to Statistics Canada by the Institut de la statistique du Québec (ISQ) and BC Stats.
Relevant considerations in the context of COVID-19
In order to take into consideration deaths from COVID-19, the DEP have considered the following strategies:
- Using the data released by the Centre for Population Health Data on May 13 that show the number of deaths in the first quarter of 2020.Note They contain deaths up until March 31 received through the NRS up until April 30. However, these data are not complete (see Figure 1: “Centre for Population Health Data (CPHD), May 13 release”). They do not contain deaths for New Brunswick, Ontario (where many of the deaths occurred), Yukon, and Nunavut. Further, numbers for Newfoundland and Labrador, Nova Scotia, and Manitoba, do not contain deaths for the last week of March, 2020.
- Using the quarterly deaths file of the Centre for Population Health Data. The quarterly file contains all death records received by the NRS up until March 31. However, these data are also incomplete, as not all death records for each of the provinces and territories have been received by Statistics Canada. Additionally, they do not contain deaths from Yukon, which are not currently sent to Statistics Canada.
- Not adjusting the data to account for COVID-19 deaths (status quo). This would be under the assumption that the deaths from other causes would likely have decreased during the pandemic (for example, from car accidents and work accidents). These would have potentially offset the number of pandemic or pandemic-related (“excess mortality”) deaths. Further, deaths from COVID-19 were very low in the first quarter (96) and therefore any adjustment would have little impact on the overall population estimates.
Factors justifying the decision to adjust death estimates
Option 1 was not selected because the data are incomplete, especially for Ontario, where many of the COVID-19 deaths occurred. Option 2 was also not selected, again because the data are incomplete. Option 3 was not selected because it is considered better to account for the COVID-19 deaths in some manner. The selected option is presented below and required only a minor modification to the system already in place, which provides the best approach to achieve the desired level of accuracy.
The DEP strategy
To prepare the first quarter estimates of 2020, the usual method was used and the number of deaths related to COVID-19, which can be found on the PHAC website, was added to the total deaths. Thus, this is status quo with the addition of COVID-19 deaths. The deaths as provided by Quebec and British Columbia is not be adjusted, since they are provided directly by the provinces and include COVID-19 deaths.
According to PHAC data, there were 96 COVID-19 deaths from January 1 to March 31, 2020. Of those, 31 occurred in Quebec and 19 in British Columbia. The numbers of deaths for the other provinces and territories are very small, the maximum being observed in Ontario, which had 33.

Data table for Chart 1
| Region | Centre for Demography, usual method | Centre for Population Health Data (CPHD), May 13 release |
|---|---|---|
| number | ||
| Newfoundland and Labrador | 1,534 | 1,131 |
| Prince Edward Island | 397 | 327 |
| Nova Scotia | 2,747 | 2,166 |
| New Brunswick | 2,172 | .. |
| Quebec | 18,450 | 16,627 |
| Ontario | 30,637 | .. |
| Manitoba | 3,082 | 2,382 |
| Saskatchewan | 2,744 | 2,450 |
| Alberta | 7,307 | 7,125 |
| British Columbia | 10,334 | 10,223 |
| Yukon | 55 | .. |
| Northwest Territories | 74 | 52 |
| Nunavut | 44 | .. |
|
.. not available for a specific reference period Notes: Usual method (Centre for Demography) refers to place of residence of the decedent. Centre for Population Health Data (CPHD) refers to place of occurrence of the death. Sources: Statistics Canada, Centre for Demography, Demographic Estimates Program; Centre for Population Health Data (CPHD). |
||
Adjustment strategies under consideration for second quarter 2020 estimates
As of May 20, 2020, PHAC had recorded 5,912 deaths in Canada, all but 96 having occurred in the second quarter (April 1, 2020 to June 30, 2020). For the quarter 2 estimates, it was considered that it would be better to avoid complex models, aiming for simplicity and transparency.
A simple solution is best, since there are many reasons why preliminary COVID-19 deaths counts may be incomplete, such as due to a high strain on the medical system. Further, the number of COVID-19 deaths may be an imperfect measure of the extent of the epidemic. For example, some people may be dying prematurely because they did not receive the care they should (such as cancelled surgeries and delayed visits to the emergency room). And, some people who died from COVID-19 would possibly have died anyway (co-morbidity and underlying health conditions). Moreover, some deaths would have been avoided because of changes in behaviour (not driving to work, less traffic). Additionally, since health care is a provincial and territorial responsibility, not all provinces and territories count their deaths in the same way. As happened with the H1N1 pandemic in 2009, some causes of death will change after revision.
The strategies we are considering to adjust the deaths estimate for the second quarter are:
- Use the same strategy as we did for quarter 1: the usual method with the addition of COVID-19 deaths as released by PHAC. This method has the benefits of simplicity and transparency. In this method, it is considered that overestimation of mortality roughly equals underestimation. We would stress that the estimates will improve as further data come in, and that it is likely that excess mortality will diverge somewhat from the published counts of COVID-19. However, it is reasonable to assume that this adjustment will bring the estimates to the “true” values.
- On June 19, the Centre for Population Health Data will release information on the mortality excess caused by COVID-19. As this information will be updated on a monthly basis, it could be used as the base for the adjustment that the Centre for Demography will make to estimate the number of deaths for the second quarter of 2020.
Immigrants and non-permanent residents
Context
The spread of COVID-19 has spurred the federal government to implement a number of measures that directly affect the number of immigrants and non-permanent residents in Canada.
Usual method
Immigration, Refugees and Citizenship Canada (IRCC) collects and processes the administrative records of immigrants and non-permanent residents (NPR). They provide the information to Statistics Canada on a monthly basis. The data are very timely: when a month ends, IRCC sends the new data to Statistics Canada three weeks later.
For immigrants, the permanent resident landing file is used to estimate the number and characteristics of people who received permanent resident status from the federal government for a given period.
For NPRs, the required files include work permits, study permits, other permits, refugee claims, permanent resident landing, applications for permanent residence and removals. This information is used to estimate the number and characteristics of individuals to whom the federal government grants non-permanent resident status. For refugee claimants, it is assumed that they will leave the country two years after their last communication with IRCC, while for permit holders, the assumption that they are in Canada for the entire duration of their permit is made. The current known limit for measuring NPRs therefore remains the same in the context of COVID-19: there is no way of knowing when NPRs arrived in Canada, when they will leave the country, or whether they actually came.
Relevant considerations in the context of COVID-19
- On March 13, 2020, the Public Health Agency of Canada advised Canadians to avoid all non-essential travel outside Canada;Note
- On March 16, 2020, the Government of Canada announced it was tightening borders and concentrating international flights at four Canadian airports.Note This measure took effect on March 18;
- On March 18, 2020, the Prime Minister of Canada announced that Canada and the United States agreed to close its respective borders to all non-essential crossings.Note Tourist travel was especially affected. The date of the official closing was the night of Friday, March 20 to Saturday, March 21;
- On March 21, 2020, the federal government maintained its closure of the Canada–U.S. border. That closure also targeted migrants wishing to enter Canada at Roxham Road to apply for refugee status.Note
Factors justifying the decision to not adjust immigrant and NPR estimates
Since the data from the IRCC files follow the same trends that are consistent with the COVID-19 calendar and the related restrictions, no adjustments to the usual method were deemed necessary.
Immigrants
Chart 2 clearly shows the impact of COVID-19 beginning in March 2020: the number of landed immigrants fell drastically in the second half of March, pulling the entire month downward. It should be noted that future permanent residents receive confirmation of permanent residency by mail and then go to a point of entry in Canada. It is at that point that they appear in the immigration data used by the Demographic Estimates Program (DEP). It is assumed that many future immigrants postponed coming to Canada due to the pandemic.

Data table for Chart 2
| Month | 2016 | 2017 | 2018 | 2019 | 2020 |
|---|---|---|---|---|---|
| number | |||||
| January | 27,279 | 21,890 | 23,549 | 18,646 | 24,727 |
| February | 32,036 | 22,826 | 25,645 | 20,250 | 25,932 |
| March | 26,923 | 28,120 | 30,813 | 27,059 | 19,128 |
| April | 28,126 | 25,120 | 28,824 | 26,899 | .. |
| May | 29,460 | 25,431 | 28,783 | 33,018 | .. |
| June | 30,708 | 27,462 | 30,070 | 34,364 | .. |
| July | 26,485 | 25,763 | 29,043 | 36,616 | .. |
| August | 21,268 | 22,206 | 25,326 | 31,584 | .. |
| September | 20,479 | 22,151 | 27,923 | 35,516 | .. |
| October | 18,319 | 21,175 | 26,395 | 31,237 | .. |
| November | 16,206 | 20,149 | 22,878 | 25,078 | .. |
| December | 19,086 | 24,219 | 21,806 | 20,917 | .. |
|
.. not available for a specific reference period Sources: Statistics Canada, Centre for Demography, Demographic Estimates Program. Immigration, Refugees and Citizenship Canada (IRCC). |
|||||
Non-permanent residents (NPRs)
The declining number of NPRs in March is presumably related to the pandemic and the border closure. This decline is due to a decrease in permits issued in March.
While January and February follow the trends from recent years, the number of permits issued in March 2020 is the opposite of what was seen over the last two years (see Charts 3 and 4).

Data table for Chart 3
| Date | 2016 | 2017 | 2018 | 2019 | 2020 |
|---|---|---|---|---|---|
| number | |||||
| February 1 | 751,962 | 845,332 | 994,193 | 1,154,392 | 1,340,155 |
| March 1 | 756,531 | 848,600 | 997,515 | 1,164,800 | 1,349,181 |
| April 1 | 755,429 | 847,020 | 997,210 | 1,161,996 | 1,327,350 |
| Sources: Statistics Canada, Centre for Demography, Demographic Estimates Program. Immigration, Refugees and Citizenship Canada (IRCC). | |||||
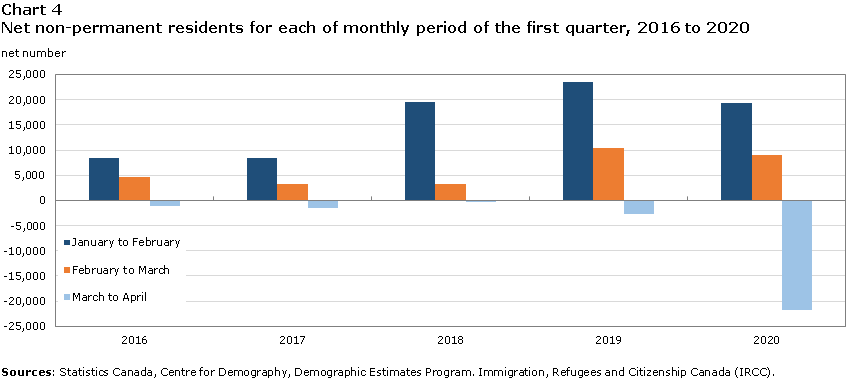
Data table for Chart 4
| Period | 2016 | 2017 | 2018 | 2019 | 2020 |
|---|---|---|---|---|---|
| number | |||||
| January to February | 8,388 | 8,401 | 19,531 | 23,519 | 19,252 |
| February to March | 4,569 | 3,268 | 3,322 | 10,408 | 9,026 |
| March to April | -1,102 | -1,580 | -305 | -2,804 | -21,831 |
| Sources: Statistics Canada, Centre for Demography, Demographic Estimates Program. Immigration, Refugees and Citizenship Canada (IRCC). | |||||
Adjustment strategies under consideration for second quarter of 2020 estimates
Due to the very current nature of the data received by IRCC, no specific adjustments are planned to the usual methods. The assumptions required to model border entry and exit of immigrants and non-permanent residents remain the same.
Emigration components
Context
Estimates of the number of emigrants, returning emigrants and net temporary emigrants require adjustments to better reflect the sudden changes in trends due to the COVID-19 pandemic.
Usual method
The Demographic Estimates Program (DEP) calculates estimates of the number of emigrants, returning emigrants and net temporary emigrants each quarter. In all three cases, the DEP measures migration that results in a change in individuals’ usual country of residence.
The preliminary estimates of the number of emigrants and returning emigrants are based on annual data from the Canada Child Benefit (CCB) and on several adjustments. These adjustments correct the CCB data for coverage, bias in the likelihood of children registered for the CCB to migrate, and registration delays in those files. For the first quarter of 2020, the estimates for these two components are modelled on the last annual CCB data deemed to be complete enough, i.e., from 2016/2017.
The preliminary estimates of net temporary emigrants are produced using data from the 2016 Reverse Record Check (RRC), the 2016 Census and estimates of the number of returning emigrants from 2011 to 2016.
For these three components, the trends observed using the most recent data are expected to continue.
Relevant considerations in the context of COVID-19
The situation changed quickly beginning in February 2020. The first flights to repatriate Canadians stuck abroad began in early February in China. Then, in mid-March, when the pandemic was spreading around the world, Air Canada announced it was suspending flights to and from Italy. Italy was one of the main epicentres for COVID-19 at the time. On March 13, the Government of Canada recommended cancelling all non-essential travel abroad. A few days later, to better control arrivals from abroad, the government tightened restrictions for entering Canada and declared that only four airports in the country could receive international flights. On March 21, the border with the United States was closed to non-essential travel. The border is still closed. Other countries also imposed severe restrictions on international travel and repatriated some of their nationals.
The COVID-19 situation has resulted in a considerable decline in international travel. It is assumed that this situation has also led to a considerable decline in the number of emigrants and returning emigrants.
Factors justifying the decision to adjust estimates of emigration components
The current DEP models are less appropriate for the first quarter of 2020. The assumption that recent trends will continue is less valid due to abrupt changes in trends stemming from the COVID-19 situation.
DEP analysts and methodologists have searched several auxiliary data sources to understand the effects of pandemic on demographic estimates. The following data were explored: monthly CCB files (the usual method is based on annual data), Global Affairs Canada’s Registration of Canadians Abroad (ROCA), crowdsourcing surveys, web panels, additional questions on the Labour Force Survey (LFS) questionnaire, Frontier Counts (FC), air and land border travel from the United States (provided by the U.S. Census Bureau) and the Canada Border Services Agency.
Of all these data, only the data from the CCB (monthly data), the ROCA and the FC are timely enough to feed the production of estimates for the first quarter of 2020. Various assessments led to the decision to use the FC data to calculate an adjustment to be applied as of March 2020. As a result of the adjustment, the numbers of emigrants, returning emigrants and net temporary emigrants are much lower in March 2020 than in previous months.
Assumptions of the adjustment
- The final estimates for the three components are the best estimate of the level and seasonality;
- The level and seasonality of the updated and preliminary estimates of the three components are accurate enough in normal circumstances;
- The seasonality of data from the FC is sufficiently realistic from 2018 to 2020;
- The monthly ratio between returning emigrants from the FC data (Canadian citizens who live abroad) and those from the DEP is sufficiently realistic in 2018 and 2019;
- This ratio did not change in 2020;
- The crisis had no effect on the three components in January and February 2020;
- The relative effect of the crisis is the same on all three emigration components;
- The effect of COVID-19 on the emigration components is the same in every province and territory.
Adjustment method
Only estimates for March 2020 have been adjusted. This adjustment was made using FC data for Canadian airports with Primary Inspection Kiosks (PIKs). These kiosks provide an electronic means for travellers arriving by commercial air to report most of the information that is otherwise collected on an E311 form.Note In these data, returning emigrants can be defined as Canadian citizens who claim to be living abroad when they arrive in Canada (see Chart 5). FC data do not provide information on the travellers’ intentions of residence in Canada. As a result, these data include returning emigrants as well as visitors.
The adjustment method is done in three steps:
- Step 1: The ratio of returning emigrants from the DEP (RET_DEP) and from FC data (RET_FC) for month m and year y (2018 and 2019 only) is calculated. The ratio is: RAT(m, y) = RET_DEP / RET_FC;
- Step 2: The average of the two RATs for the same month is calculated to obtain RAT_AVERAGE;
- Step 3: RAT_AVERAGE is applied to the FC data for the desired month. The same ratio is applied to each province.

Data table for Chart 5
| Number of international travellers | |
|---|---|
| 2018 | |
| January | 21,048 |
| February | 24,319 |
| March | 30,810 |
| April | 27,855 |
| May | 34,164 |
| June | 51,802 |
| July | 64,079 |
| August | 50,511 |
| September | 34,184 |
| October | 31,208 |
| November | 26,735 |
| December | 57,742 |
| 2019 | |
| January | 23,998 |
| February | 25,329 |
| March | 27,304 |
| April | 32,447 |
| May | 34,317 |
| June | 52,983 |
| July | 64,809 |
| August | 51,896 |
| September | 34,326 |
| October | 33,806 |
| November | 27,108 |
| December | 61,912 |
| 2020 | |
| January | 26,845 |
| February | 25,934 |
| March | 16,456 |
|
Note: Primary inspection kiosks (PIKs) were gradually introduced at major Canadian airports. In order to obtain a consistent time series, the entries included in the graph are only from airports with these kiosks as of January 2018. Source: Statistics Canada. Border enumeration. |
|
Results
As the data in Table 1 show, the overall effect of the adjustment on data from the first quarter of 2020 is relatively small. However, depending on how the COVID-19 situation evolves, the effect could be much greater for the second quarter. The DEP continues to monitor the situation closely and will explore other approaches to refine the potential adjustment for coming quarters.
| Region | Emigrants | Returning emigrants | Net temporary emigrants | |||
|---|---|---|---|---|---|---|
| Usual method | Adjusted method | Usual method | Adjusted method | Usual method | Adjusted method | |
| number | ||||||
| Canada | 14,133 | 12,686 | 6,030 | 5,013 | 6,676 | 5,834 |
| Newfoundland and Labrador | 52 | 48 | 21 | 17 | 36 | 32 |
| Prince Edward Island | 15 | 14 | 13 | 11 | 10 | 9 |
| Nova Scotia | 135 | 121 | 106 | 88 | 63 | 55 |
| New Brunswick | 52 | 47 | 40 | 33 | 51 | 45 |
| Quebec | 1,953 | 1,710 | 895 | 744 | 1,123 | 981 |
| Ontario | 6,362 | 5,736 | 2,954 | 2,455 | 3,296 | 2,880 |
| Manitoba | 380 | 339 | 191 | 159 | 88 | 77 |
| Saskatchewan | 174 | 158 | 123 | 102 | 122 | 106 |
| Alberta | 1,867 | 1,672 | 724 | 602 | 555 | 485 |
| British Columbia | 3,121 | 2,821 | 956 | 795 | 1,310 | 1,145 |
| Yukon | 13 | 12 | 3 | 3 | 7 | 6 |
| Northwest Territories | 7 | 6 | 1 | 1 | 8 | 7 |
| Nunavut | 2 | 2 | 3 | 3 | 7 | 6 |
| Source: Statistics Canada, Centre for Demography, Demographic Estimates Program. | ||||||
Adjustment strategies under consideration for the second quarter of 2020 estimates
Restrictions on international travel continued in the second quarter. As a result, adjustments may still be necessary and the DEP is evaluating various approaches. Among these, the DEP favours:
- Further exploration of the ROCA and CCB data and integration of these data with those of the FC which were used to adjust the first quarter estimates;
- Continuing methodological and data exchanges with the U.S. Census Bureau;
- Monitoring developments, including press reviews and scientific monitoring.
Interprovincial migration
Context
In the context of the COVID-19 pandemic, the internal mobility of Canadians is expected to be disrupted. However, the data used in the normal production process of the Demographic Estimates Program (DEP) do not indicate any change in the intensity of interprovincial migration in the first quarter of 2020 compared with recent years. Therefore, The DEP decided not to adjust the interprovincial migration estimates for the first quarter of 2020 (January 1 to March 31).
Usual method
Each month, the Canada Revenue Agency (CRA) provides Statistics Canada with data from the Canada Child Benefit (CCB) program, from which information can be derived on the usual province or territory of residence of children registered for the CCB program. Comparing microdata files at the beginning and at the end of the period under study helps to estimate the preliminary monthly, quarterly and annual interprovincial migration. Adjustment factors are used to reflect the program’s partial coverage, the differential propensity of children registered for the CCB to migrate and the differential propensity of adults versus children to migrate. Estimates of adults migrating across provincial or territorial boundaries are produced by calculating modelled migration ratios of adults to children, using the most recent tax data. Estimates of in-migrants, out-migrants and net interprovincial migration, and an origin–destination matrix by province or territory are published each quarter.
Relevant considerations in the context of COVID-19
The evaluation of the preliminary estimates for the first quarter of 2020, and more specifically those for March, did not reveal any changes in the intensity of interprovincial migration compared with previous years. Based on estimates calculated using CCB microdata,Note variations observed between March 2019 and March 2020 are showing a magnitude that is not uncommon when compared to the historical series. The estimates of in-migrants and out-migrants by province or territory in March 2020 were also similar to those of March 2019 (Charts 6 and 7).
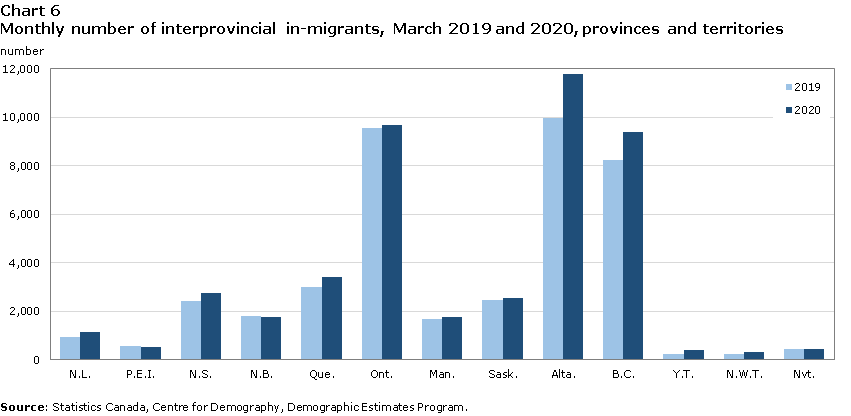
Data table for Chart 6
| Region | 2019 | 2020 |
|---|---|---|
| number | ||
| Newfoundland and Labrador | 932 | 1,143 |
| Prince Edward Island | 543 | 518 |
| Nova Scotia | 2,428 | 2,736 |
| New Brunswick | 1,782 | 1,772 |
| Quebec | 2,985 | 3,409 |
| Ontario | 9,531 | 9,686 |
| Manitoba | 1,664 | 1,763 |
| Saskatchewan | 2,466 | 2,541 |
| Alberta | 9,953 | 11,776 |
| British Columbia | 8,233 | 9,378 |
| Yukon | 245 | 407 |
| Northwest Territories | 227 | 319 |
| Nunavut | 453 | 443 |
| Source: Statistics Canada, Centre for Demography, Demographic Estimates Program. | ||

Data table for Chart 7
| Region | 2019 | 2020 |
|---|---|---|
| number | ||
| Newfoundland and Labrador | 1,496 | 1,447 |
| Prince Edward Island | 514 | 482 |
| Nova Scotia | 2,323 | 2,622 |
| New Brunswick | 1,542 | 1,444 |
| Quebec | 2,991 | 3,156 |
| Ontario | 9,407 | 11,270 |
| Manitoba | 3,036 | 3,071 |
| Saskatchewan | 3,918 | 4,690 |
| Alberta | 8,900 | 9,544 |
| British Columbia | 6,283 | 7,283 |
| Yukon | 284 | 213 |
| Northwest Territories | 413 | 447 |
| Nunavut | 335 | 222 |
| Source: Statistics Canada, Centre for Demography, Demographic Estimates Program | ||
Factors justifying the decision to not adjust the interprovincial migration estimates
- Measures to isolate travellers, travel restrictions between regions of the country or the closure of borders between provinces or within provinces only began in late March, when the quarter under review was almost over;Note Note Note
- Changes in migration trends are expected to be observed a few months after major changes are seen in economic activity. For instance, in the context of the 2014 oil crisis, unemployment rates in Alberta began to rise in late 2014.Note However, it was not until June 2015 that the interprovincial in-migration in that province showed the first signs of declining compared with trends from previous years. Consequently, the COVID-19 crisis may have led to a decline in planning new interprovincial migrations; however, it is reasonable to believe that migrations that were already planned were carried out despite the crisis, particularly when contract-related decisions could not be cancelled (reservation for a moving company, home purchase, acceptance of a job contract, etc.).
Adjustment strategies under consideration for the second quarter of 2020 estimates
- Monitor developments in the field based on press reviews and scientific monitoring;
- Efforts to acquire alternate information were made, such as with Canada Post and the mail forwarding program;
- Analyze mobility based on driver’s licence microdata files.
Conclusion
The DEP will continue to closely monitor all aspects of the COVID-19 pandemic that may affect the demographic behaviours of the Canadian population. The entire period covered by the population estimates for the second quarter of 2020 will have been affected by the COVID-19 crisis, unlike the first quarter of 2020, when only the end of the period was affected. As a result, it is expected that the magnitude of the necessary adjustments will be greater when the population estimates for the second quarter of 2020 are produced. A second copy of this technical supplement will therefore again accompany the release of the population estimates for the second quarter of 2020.
Sources
Balbo, N., I. Kashnitsky, A. Melegaro, F. Meslé, M.C. Mills, H. de Valk and D. Vono de Vilhena. 2020. “Demography and the Coronavirus Pandemic”, Population & Policy Brief, no. 25, May 2020, Berlin: Max Planck Society/Population Europe.
Matysiak, A., T. Sobotka and D. Vignoli. 2020. “The Great Recession and Fertility in Europe: A Sub-national Analysis”, Working Papers, Vienna Institute of Demography, no. 02/2018.
Sobotka, T., V. Skirbekk and D. Philipov. 2011. “Economic Recession and Fertility in the Developed World”, Population and Development Review, volume 37, issue 2, pages 267 to 306.
- Date modified: