
Annual Demographic Estimates: Canada, Provinces and Territories, 2022
Analysis: Total Population
Skip to text
Text begins
The estimates in this publication are based on 2016 Census counts, adjusted for census net undercoverage and incompletely enumerated reserves, plus the estimated population growth for the period from May 10, 2016, to the date of the estimate. The analysis in this publication is based on preliminary data. These data will be revised over the coming years, and some trends described in this publication could change as a result of these revisions. Therefore, this publication should be interpreted with caution.
The estimates in this publication should not be confused with the results of the 2021 Census, which are being released throughout 2022.
The analyses in this document focus on the period July 1, 2021 to June 30, 2022. The estimates for some demographic components were adjusted to take into account the effect of the global COVID-19 pandemic on the population of Canada.
For an explanation of how the population estimates have taken COVID-19 into account, please see: Technical Supplement: Production of Demographic Estimates for the Second Quarter of 2020 in the Context of COVID-19.
This section presents the population estimates for Canada, the provinces and territories on July 1, 2022, along with a concise analysis of the various components of population growth between July 1, 2021 and June 30, 2022.
Canada’s population approaches 39 million
On July 1, 2022, Canada’s population was estimated at 38,929,902, up 703,404 from July 1, 2021 (+1.8%).
This is the largest annual growth in number in Canadian history and the highest growth rate since 1965/1966 (+1.9%, +370,900), at the end of the baby boom. This high growth is due almost entirely to international migration (representing 93.5% of growth in 2021/2022), reflecting the easing of international border restrictions, increasing Immigration, Refugees, and Citizenship Canada targets,Note and the welcoming of people coming to Canada following the Russian invasion of Ukraine. Further, as of July 1, 2022, Canada was on track to exceed the target for 2022 (was at 53.7% of the target), which could include some catch-up following lower immigration levels during the height of the pandemic.
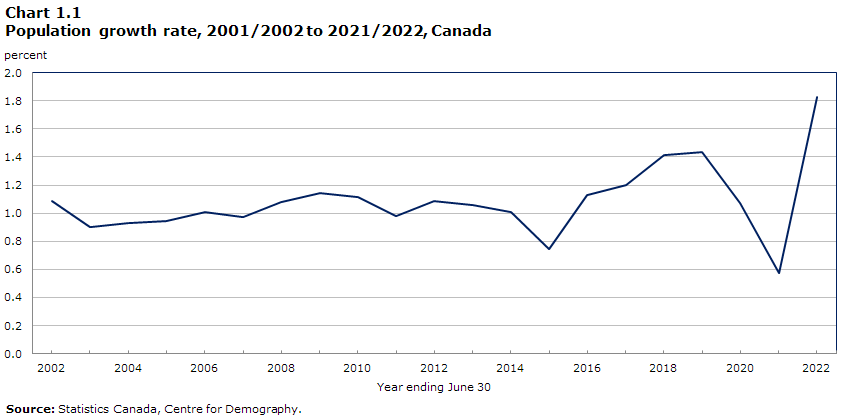
Data table for Chart 1.1
| Year ending June 30 | percent |
|---|---|
| 2002 | 1.09 |
| 2003 | 0.90 |
| 2004 | 0.93 |
| 2005 | 0.94 |
| 2006 | 1.01 |
| 2007 | 0.97 |
| 2008 | 1.08 |
| 2009 | 1.14 |
| 2010 | 1.11 |
| 2011 | 0.98 |
| 2012 | 1.09 |
| 2013 | 1.06 |
| 2014 | 1.01 |
| 2015 | 0.75 |
| 2016 | 1.13 |
| 2017 | 1.20 |
| 2018 | 1.41 |
| 2019 | 1.44 |
| 2020 | 1.07 |
| 2021 | 0.58 |
| 2022 | 1.82 |
| Source: Statistics Canada, Centre for Demography. | |
International migration is the main source of population growth
Population growth at the national level is based on two factors: natural increaseNote and international migratory increase,Note while provincial and territorial population estimates also factor in interprovincial migration.
In 2021/2022, estimated deaths were higher than the year prior (323,221 compared to 306,465 in 2020/2021, +5.5%) due to the ongoing COVID-19 pandemic, a growing population and population aging.
Natural increase totalled +45,571, which is the difference between estimated births (368,792) and estimated deaths (323,221). This is lower than the year prior (+55,148), due to higher number of deaths. This figure for 2021/2022 continues a trend of decreasing natural increase over time, reflecting decreasing fertility ratesNote and higher numbers of deaths. As such, population growth for 2021/2022 was primarily driven by international migration.
Since 1995/1996, international migration has consistently been the main driver of population growth in Canada. In the past year, over 93% of population growth stemmed from international migratory growth (93.5%), a level unmatched in recent Canadian history.
Between July 1, 2021, and July 1, 2022, international migratory increase was 657,833, the highest level estimated to date. This figure exceeds the last peak of 446,169 recorded in 2018/2019 by more than 210,000.
Emigration levels returned to pre-pandemic levels for 2021/2022 with 49,769 emigrants. For comparison, the emigration level 10-years prior was 65,393 in 2011/2012; 47,337 in 2018/2019 before the pandemic; and 35,838 in 2020/2021 during the pandemic. Returning emigration also returned to pre-pandemic levels (40,326 in 2021/2022 in comparison to 34,933 in 2020/2021) highlighting the role of easing travel restrictions on emigrants and returning emigrants.
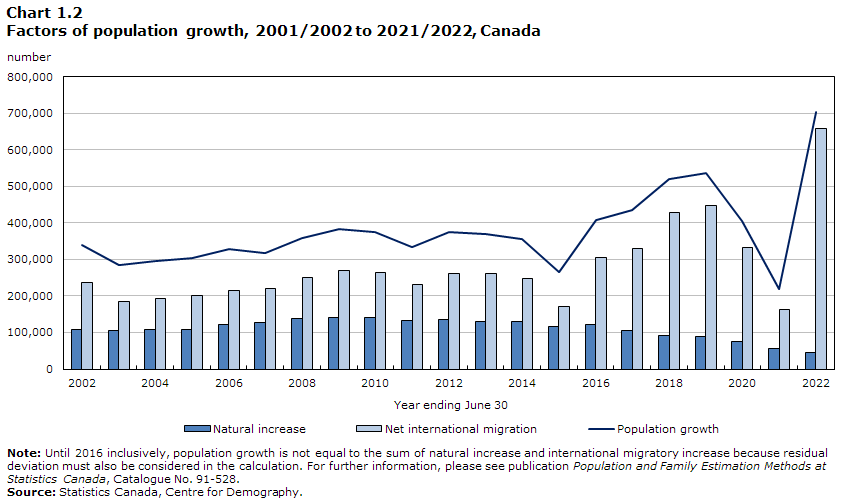
Data table for Chart 1.2
| Year ending June 30 | Natural increase | Net international migration | Population growth |
|---|---|---|---|
| number | |||
| 2002 | 107,661 | 237,935 | 339,177 |
| 2003 | 106,618 | 183,749 | 283,949 |
| 2004 | 108,933 | 194,128 | 296,627 |
| 2005 | 109,364 | 200,154 | 303,098 |
| 2006 | 120,593 | 216,093 | 327,421 |
| 2007 | 127,091 | 219,749 | 317,851 |
| 2008 | 137,170 | 249,993 | 358,093 |
| 2009 | 141,582 | 269,184 | 381,777 |
| 2010 | 142,235 | 262,750 | 375,994 |
| 2011 | 131,456 | 230,981 | 334,439 |
| 2012 | 136,430 | 260,564 | 374,894 |
| 2013 | 129,951 | 260,820 | 368,732 |
| 2014 | 129,229 | 247,290 | 354,481 |
| 2015 | 117,154 | 170,354 | 265,473 |
| 2016 | 121,492 | 304,047 | 406,579 |
| 2017 | 105,643 | 330,106 | 435,749 |
| 2018 | 92,990 | 426,858 | 519,848 |
| 2019 | 89,977 | 446,169 | 536,146 |
| 2020 | 74,253 | 331,683 | 405,936 |
| 2021 | 55,148 | 164,184 | 219,332 |
| 2022 | 45,571 | 657,833 | 703,404 |
|
Note: Until 2016 inclusively, population growth is not equal to the sum of natural increase and international migratory increase because residual deviation must also be considered in the calculation. For further information, please see publication Population and Family Estimation Methods at Statistics Canada, Catalogue No. 91-528. Source: Statistics Canada, Centre for Demography. |
|||
International migration records in several provinces
International migration refers to the total number immigrants, returning emigrants and net non-permanent residents, less emigrants and net temporary emigrants. 2021/2022 saw high international migration in all provinces and territories, with the exception of Nunavut. All provinces (except Quebec) and Yukon saw record levels of international migration, in particular the Western provinces: Manitoba (+24,666), Saskatchewan (+18,202), Alberta (+59,998) and British Columbia (+103,674). For the first time since at least 1971/1972, Ontario gained more than 300,000 people from international migration.
Record highs for non-permanent residents in several provinces
There are three main categories of non-permanent residents (NPRs): asylum claimants, work permit holders, and study permit holders. The net number of NPRs can rise or fall depending on the economic context of the country of origin and the host country, as well as the direction of certain programs in Canada and in the provinces and territories. The net number of NPRs can vary, particularly depending on the political context in their country of origin, but also on certain decisions made in Canada.
In 2021/2022, Canada and three provinces saw record gains in the net number of non-permanent residents after a year of losses in most parts of Canada during the height of the pandemic. The number of non-permanent residents in Canada increased by a record 205,238 in 2021/2022. In comparison, Canada had a net gain of 168,501 non-permanent residents in 2018/2019.
In addition to Ontario (+117,403), two other provinces set record highs for the net number of non-permanent residents: New Brunswick (+4,836) and Newfoundland and Labrador (+2,338).
Various factors may have had an impact on the international migratory growth and trends observed. For example, as Canada is committed to supporting those affected by the Russian invasion of Ukraine, the net numbers of non-permanent residents is reflective of this event. The first quarter of 2022 saw the onset of the crisis in Ukraine, which led to the arrival of Ukrainians and their families within the non-permanent resident population in the second quarter of 2022. Moreover, beginning in the second quarter of 2020, COVID-19 travel restrictions made it difficult for those holding non-permanent resident permits to enter the country for non-essential reasons. After significant border restrictions during the height of the pandemic in 2020/2021, there was a large increase in net number of study permit holders and modest gains in the net number of work permit holders in 2021/2022 (both of which make up the vast majority of non-permanent residents in Canada). In combination, these components contributed to the increase in international migratory growth observed during the year.
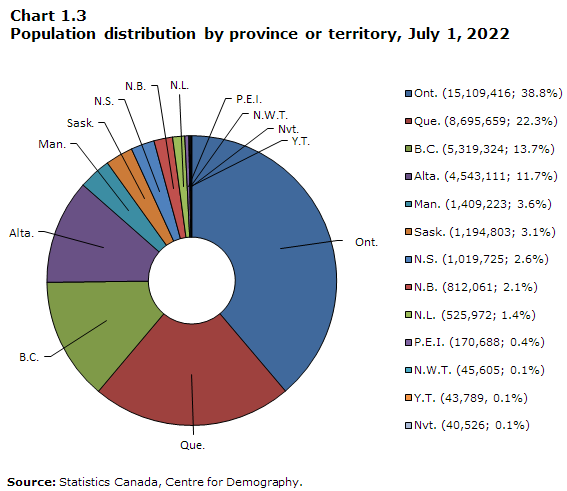
Data table for Chart 1.3
| Proportion | |
|---|---|
| Ont. | 38.8% |
| Que. | 22.3% |
| B.C. | 13.7% |
| Alta. | 11.7% |
| Man. | 3.6% |
| Sask. | 3.1% |
| N.S. | 2.6% |
| N.B. | 2.1% |
| N.L. | 1.4% |
| P.E.I. | 0.4% |
| N.W.T. | 0.1% |
| Y.T. | 0.1% |
| Nvt. | 0.1% |
| Source: Statistics Canada, Centre for Demography. | |
Slowly shifting demographic weight and population growth in Atlantic Canada
On July 1, 2022, more than 33.6 million Canadians (86.5%) resided in one of the four most populous provinces: Ontario (38.8%), Quebec (22.3%), British Columbia (13.7%) and Alberta (11.7%).
Ontario remained the country’s most populated province, with 15,109,416 people, followed by Quebec (8,695,659), British Columbia (5,319,324) and Alberta (4,543,111). Provinces and territories west of Ontario accounted for 32.4% of total population, ahead of provinces east of Ontario that accounted for 28.8% of Canada’s population.
All of Atlantic Canada saw positive population growth in 2021/2022. With the exception of Newfoundland and Labrador, positive population growth has been an observable trend in all the Atlantic provinces since 2015/2016. Newfoundland and Labrador, for the first time in the last six years, recorded positive population growth in 2021/2022 (+1.1%). Prince Edward Island (+3.5%), Nova Scotia (+2.8%) and New Brunswick (+2.7%) had the highest population growth rates across all provinces and territories in 2021/2022.
In a landmark event, Nova Scotia reached a milestone in passing the one million mark in population during the last quarter of 2021. Ontario also crossed the 15 million people mark, which occurred during the second quarter of 2022. In addition, New Brunswick reached 800,000 residents in the first quarter of 2022. Moreover, Nunavut recorded more than 40,000 residents, which occurred during the last quarter of 2021. Canada tripled the population growth rate from the year prior (+0.6%) with a growth rate of 1.8% reported for 2021/2022.
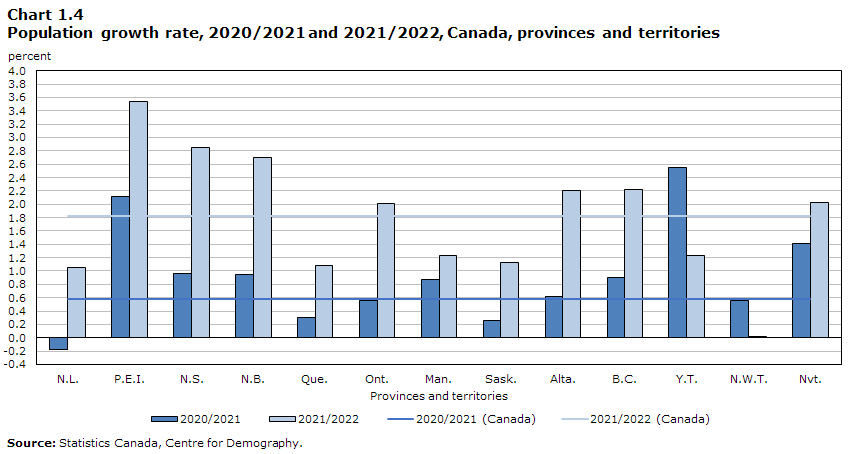
Data table for Chart 1.4
| 2020/2021 | 2021/2022 | 2020/2021 (Canada) | 2021/2022 (Canada) | |
|---|---|---|---|---|
| percent | ||||
| N.L. | -0.2 | 1.1 | 0.6 | 1.8 |
| P.E.I. | 2.1 | 3.5 | 0.6 | 1.8 |
| N.S. | 1.0 | 2.8 | 0.6 | 1.8 |
| N.B. | 0.9 | 2.7 | 0.6 | 1.8 |
| Que. | 0.3 | 1.1 | 0.6 | 1.8 |
| Ont. | 0.6 | 2.0 | 0.6 | 1.8 |
| Man. | 0.9 | 1.2 | 0.6 | 1.8 |
| Sask. | 0.3 | 1.1 | 0.6 | 1.8 |
| Alta. | 0.6 | 2.2 | 0.6 | 1.8 |
| B.C. | 0.9 | 2.2 | 0.6 | 1.8 |
| Y.T. | 2.5 | 1.2 | 0.6 | 1.8 |
| N.W.T. | 0.6 | 0.0 | 0.6 | 1.8 |
| Nvt. | 1.4 | 2.0 | 0.6 | 1.8 |
| Source: Statistics Canada, Centre for Demography. | ||||
International migration strongest driver of population growth
Population growth in the provinces and territories can be attributed to three key factors: natural increase, international migratory increase, and interprovincial migratory increase. Among these three population growth factors, international migration remains the strongest driver of population growth across all provinces, a trend that has been observed over the last few decades.
The Atlantic provinces, with the exception of Prince Edward Island, had a negative natural increase, meaning that there were more deaths in 2021/2022 than births. In a trend that began in 2011/2012, Newfoundland and Labrador continued to experience losses from natural increase (-2,294). However, after five continuous years of population loss, Newfoundland and Labrador saw an increase in total population in 2021/2022 (+5,520) meaning that gains in international and interprovincial migration were able to compensate for losses from natural increase. Prince Edward Island, for a second year in a row, recorded more births than deaths in 2021/2022 (+56).
Among the territories, Yukon and Northwest Territories saw record lows in natural increase (+72 and +270, respectively) and high gains from international migration (+550 and +255). For Nunavut, natural increase (+622) continues to remain the predominant contributor to population growth in the territory. In 2020/2021, Nunavut lost population due to interprovincial migration (-169), a trend which reversed in 2021/2022 (+183).
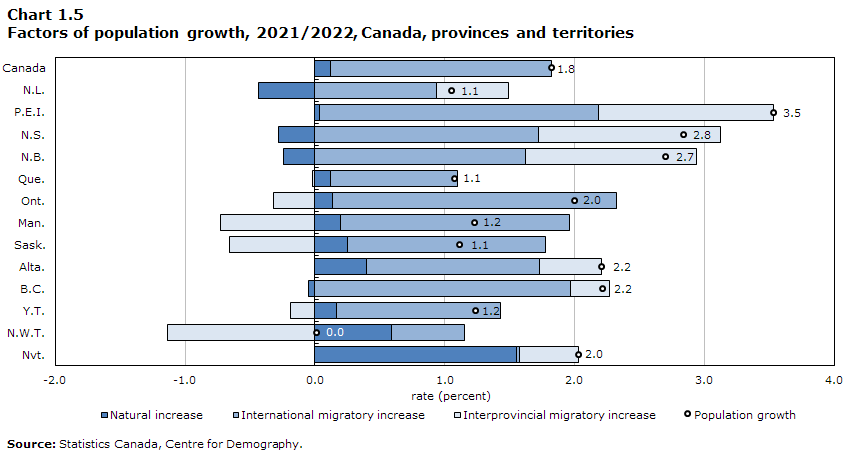
Data table for Chart 1.5
| Natural increase | International migratory increase | Interprovincial migratory increase | Population growth | |
|---|---|---|---|---|
| rate (%) | ||||
| Canada | 0.1 | 1.7 | 0.0 | 1.8 |
| N.L. | -0.4 | 0.9 | 0.6 | 1.1 |
| P.E.I. | 0.0 | 2.2 | 1.3 | 3.5 |
| N.S. | -0.3 | 1.7 | 1.4 | 2.8 |
| N.B. | -0.2 | 1.6 | 1.3 | 2.7 |
| Que. | 0.1 | 1.0 | 0.0 | 1.1 |
| Ont. | 0.1 | 2.2 | -0.3 | 2.0 |
| Man. | 0.2 | 1.8 | -0.7 | 1.2 |
| Sask. | 0.3 | 1.5 | -0.7 | 1.1 |
| Alta. | 0.4 | 1.3 | 0.5 | 2.2 |
| B.C. | -0.1 | 2.0 | 0.3 | 2.2 |
| Y.T. | 0.2 | 1.3 | -0.2 | 1.2 |
| N.W.T. | 0.6 | 0.6 | -1.1 | 0.0 |
| Nvt. | 1.6 | 0.0 | 0.5 | 2.0 |
| Source: Statistics Canada, Centre for Demography. | ||||
Record immigration levels in the vast majority of provinces and territories
Across the country, every province and territory welcomed more immigrants in 2021/2022 compared with the previous year, with record numbers of new immigrants in the vast majority of provinces. The Atlantic provinces in particular saw historic gains from immigration with Newfoundland and Labrador (2,843, +221.6%), Prince Edward Island (3,436, +184.2%), Nova Scotia (13,816, +290.3%) and New Brunswick (8,401, +212.4%) more than, or close to, tripling the number of immigrants from the year prior.
While the record number of immigrants welcomed this year can be partially attributed to the catch-up growth to compensate for record low migration in 2020/2021, all provinces and territories, with the exception of Alberta, saw historic gains in the number of immigrants. Among the provinces, Nova Scotia saw the highest increase in the number of immigrants (from 3,540 in 2020/2021 to 13,816 in 2021/2022, or +290.3%). British Columbia also saw a high number of immigrants (83,200), almost 30,000 more than the year with the second highest number of immigrants (1996/1997, 53,235). Ontario also set a record, welcoming more than 200,000 (277,235) immigrants for the first time since at least 1931/1932.
Canada’s new 2021 and 2022 immigration targets are in part responsible for the increase in the number of immigrants seen in the second half of 2021 and first half of 2022.Note In 2021/2022, Canada continued to welcome Afghan refugees in its commitment towards the resettlement of individuals and families from Afghanistan.Note However, even without this category of immigrants, immigration would have reached record levels for a second quarter due to the increasing immigration targets set by Immigration, Refugees and Citizenship Canada (IRCC). This could also be the result of catch-up growth following lower levels during the height of the pandemic.
Start of text boxThe estimated number of immigrants by province and territory is based on their intended province or territory of residence, as collected by Immigration, Refugees and Citizenship Canada (IRCC). This also applies to the calculation of international migratory growth and provincial and territorial population growth.
End of text box
Ontario continues to attract the most immigrants
In 2021/2022, 46.1% of all immigrants to Canada settled in Ontario, a slight decrease from the previous year (47.7%), which exceeds the demographic weight of the province (38.8%). The Prairie provincesNote welcomed 18.3% of immigrants to Canada, which is a similar proportion as the year prior (18.4%), but a decrease from 2019/2020 (22.4%). British Columbia saw an increase in the proportion of immigrants in comparison to the prior year (16.9% from 15.2% in 2020/2021). The Atlantic provinces saw an increase in proportion of immigrants in 2021/2022 (5.8%) while these four provinces received 3.7% of all immigrants to Canada during the height of the pandemic in 2020/2021. A smaller proportion of immigrants settled in Quebec (12.7% of all immigrants to Canada), down from 14.9% in 2020/2021 and lower than the demographic weight of the province (22.3%).
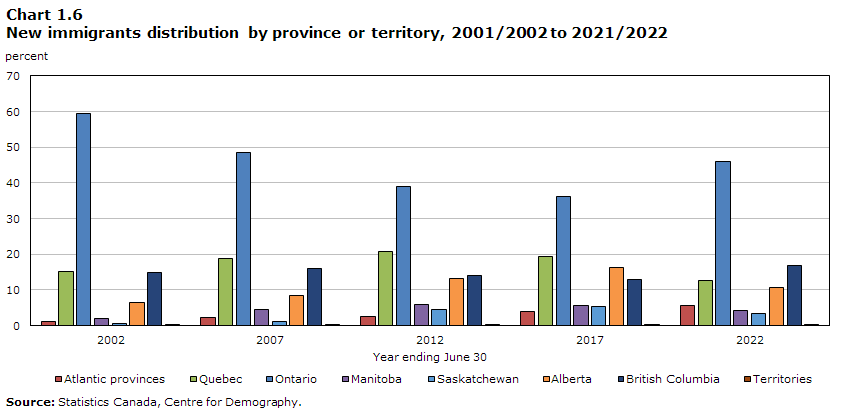
Data table for Chart 1.6
| Year ending June 30 | Atlantic provinces | Quebec | Ontario | Manitoba | Saskatchewan | Alberta | British Columbia | Territories |
|---|---|---|---|---|---|---|---|---|
| percent | ||||||||
| 2002 | 1.1 | 15.3 | 59.6 | 1.9 | 0.7 | 6.5 | 14.8 | 0.1 |
| 2007 | 2.3 | 18.9 | 48.5 | 4.5 | 1.3 | 8.5 | 15.9 | 0.1 |
| 2012 | 2.6 | 20.8 | 38.9 | 5.8 | 4.4 | 13.3 | 13.9 | 0.2 |
| 2017 | 4.1 | 19.5 | 36.1 | 5.8 | 5.3 | 16.2 | 13.0 | 0.2 |
| 2022 | 5.8 | 12.7 | 46.1 | 4.3 | 3.3 | 10.7 | 16.9 | 0.2 |
| Source: Statistics Canada, Centre for Demography. | ||||||||
Ontario supplies the majority of interprovincial migrants to its eastern neighbours
At the provincial and territorial level, population growth is the result of not only natural increase and international migration, but also migratory exchanges between provinces and territories. The Atlantic provinces gained population through interprovincial migration (Nova Scotia, +14,079; New Brunswick, +10,612; Newfoundland and Labrador, +2,930; and Prince Edward Island, +2,260) as did Alberta (+21,660), British Columbia (+15,869) and Nunavut (+183). Ontario (-47,212), Manitoba (-10,203), Saskatchewan (-7,829), Quebec (-1,749), the Northwest Territories (-517) and Yukon (-83) all lost population to other provinces and territories through interprovincial migration in 2021/2022. Ontario continued to experience a net loss in interprovincial migrants: this net loss through interprovincial migration is Ontario’s largest since at least 1971/1972, with the previous highest net loss recorded being in 1980/1981 (-33,247).
By far, Ontario supplied the majority of interprovincial migrants to its eastern neighbours: Quebec (62.1%), New Brunswick (59.5%), Nova Scotia (57.4%), Prince Edward Island (68.0%) and Newfoundland and Labrador (49.7%). For Quebec, despite the largest levels of in-migrants in the last three decades (27,861 in 2021/2022 compared to 30,035 in 1989/1990), the province continued to experience a net loss of interprovincial migrants (-1,749). This has been a consistent trend since the beginning of the current demographic accounting system (1971/1972), meaning that more people moved away from the province than those who moved to the province. However, the net loss in 2021/2022 in Quebec was the second smallest loss over the same time period, with only 2003/2004 having a smaller net loss (-822).
To the west of Ontario, Manitoba (-10,203) and Saskatchewan (-7,829) continued to experience net losses to interprovincial migration, a trend that has been observed since at least 1971/1972 in Manitoba (with the exception of 1982/1983 and 1983/1984) and since 2013/2014 in Saskatchewan. In a reversal of trends, Alberta recorded positive net interprovincial migration in 2021/2022 (+21,660) for the first time since 2014/2015. Population and economic growth are often interrelated. As the pandemic hit, Alberta saw increased unemployment rates reaching 15.3% in May 2020 and the province saw net losses of 9,458 people to other provinces in 2020/2021. With the unemployment rate decreasing to 7.8% at the beginning of the third quarter in 2021 (October 2021) and continuing the downward trajectory to 4.9% by the end of the second quarter in 2022 (June 2022),Note the net gain in population in 2021/2022 could be due to improved economic conditions in the province.Note In 2021/2022, Alberta received the greatest number of in-migrants (85,625) of any province or territory, a number more in line with the figures seen prior to the drop in oil prices, which began in the fall of 2014Note (81,540 in 2014/2015).
After Alberta, British Columbia reported the next highest net gain from interprovincial migration (+15,869). While lower than the year prior (+25,376), the positive increase in interprovincial migration is consistent with trends from the last decade in the province. Together, Alberta and Ontario supplied over 73% of the in-migrants to British Columbia in 2021/2022 (73.7%).
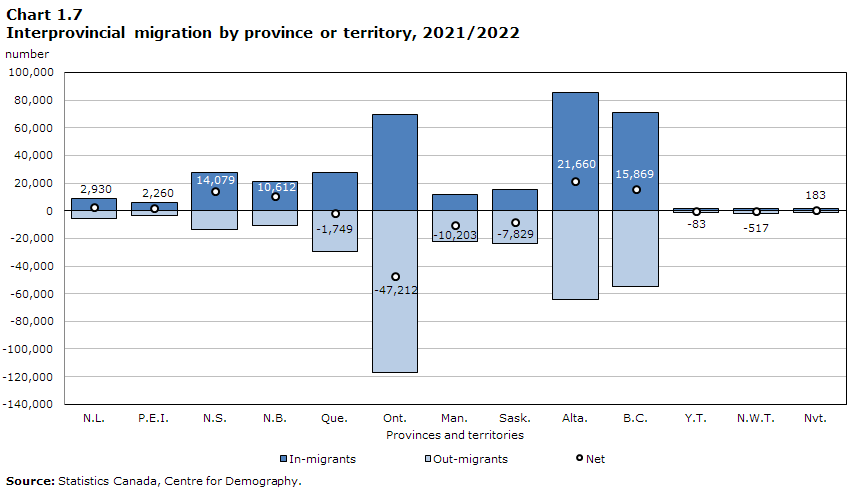
Data table for Chart 1.7
| In-migrants | Out-migrants | Net | |
|---|---|---|---|
| number | |||
| N.L. | 8,633 | -5,703 | 2,930 |
| P.E.I. | 5,823 | -3,563 | 2,260 |
| N.S. | 27,640 | -13,561 | 14,079 |
| N.B. | 21,189 | -10,577 | 10,612 |
| Que. | 27,861 | -29,610 | -1,749 |
| Ont. | 69,600 | -116,812 | -47,212 |
| Man. | 11,996 | -22,199 | -10,203 |
| Sask. | 15,555 | -23,384 | -7,829 |
| Alta. | 85,625 | -63,965 | 21,660 |
| B.C. | 70,788 | -54,919 | 15,869 |
| Y.T. | 1,484 | -1,567 | -83 |
| N.W.T. | 1,862 | -2,379 | -517 |
| Nvt. | 1,507 | -1,324 | 183 |
| Source: Statistics Canada, Centre for Demography. | |||
The largest migration flows originate from Ontario
The 30 largest migration flows are shown in Chart 1.8, in which each province or territory is assigned a colour. Migration origins and destinations are represented by the circle’s segments. Flows are the same colour as their origin, the width indicates their size and the arrow their direction.
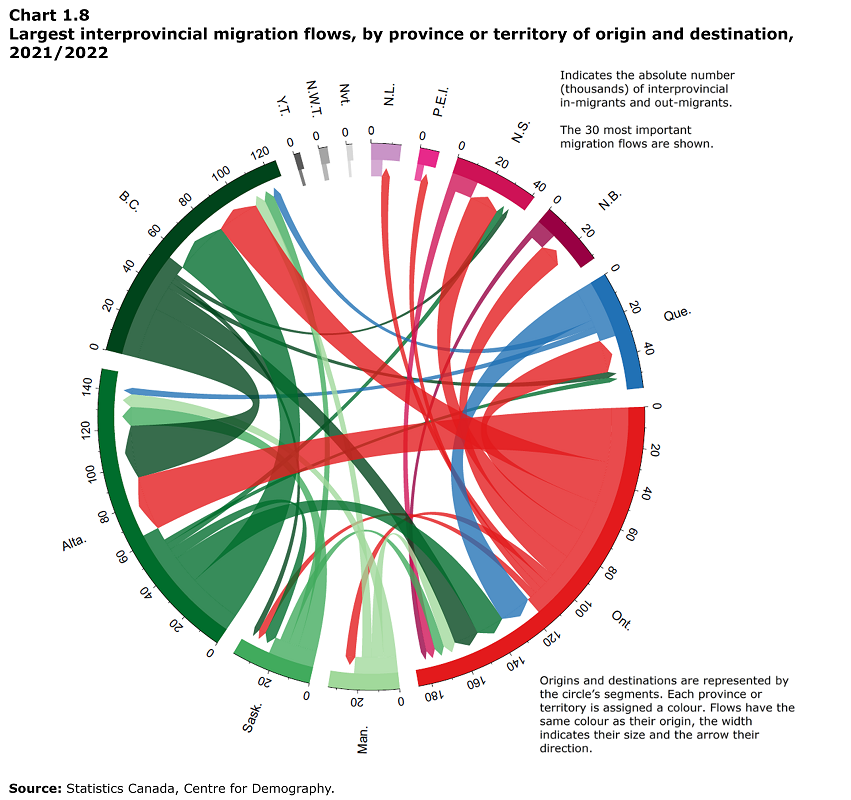
Data table for Chart 1.8
Origins and destinations are represented by the circle’s segments. Each province or territory is assigned a colour. Flows have the same colour as their origin, the width indicates their size and the arrow their direction. Indicates the absolute number (thousands) of interprovincial in-migrants and out-migrants. The 30 most important flows are shown.
| Origin | Destination | ||||||||||||
|---|---|---|---|---|---|---|---|---|---|---|---|---|---|
| N.L. | P.E.I. | N.S. | N.B. | Que. | Ont. | Man. | Sask. | Alta. | B.C. | Y.T. | N.W.T. | Nvt. | |
| N.L. | Note ...: not applicable | 79 | 714 | 440 | 303 | 1,849 | 93 | 67 | 1,630 | 383 | 0 | 93 | 52 |
| P.E.I. | 96 | Note ...: not applicable | 670 | 318 | 128 | 1,482 | 5 | 5 | 533 | 315 | 11 | 0 | 0 |
| N.S. | 957 | 394 | Note ...: not applicable | 1,998 | 938 | 4,628 | 223 | 334 | 2,316 | 1,567 | 71 | 87 | 48 |
| N.B. | 593 | 311 | 2,091 | Note ...: not applicable | 2,003 | 2,970 | 205 | 126 | 1,441 | 599 | 26 | 129 | 83 |
| Que. | 194 | 258 | 1,037 | 1,856 | Note ...: not applicable | 17,487 | 617 | 436 | 3,510 | 3,917 | 25 | 132 | 141 |
| Ont. | 4,290 | 3,962 | 15,862 | 12,607 | 17,315 | Note ...: not applicable | 5,167 | 3,759 | 29,422 | 22,750 | 474 | 507 | 697 |
| Man. | 168 | 34 | 454 | 366 | 702 | 6,316 | Note ...: not applicable | 1,690 | 6,863 | 5,461 | 22 | 27 | 96 |
| Sask. | 73 | 48 | 578 | 211 | 453 | 5,076 | 1,189 | Note ...: not applicable | 10,186 | 5,411 | 69 | 34 | 56 |
| Alta. | 1,568 | 452 | 3,494 | 1,976 | 2,606 | 15,279 | 2,203 | 6,005 | Note ...: not applicable | 29,413 | 229 | 503 | 237 |
| B.C. | 508 | 257 | 2,449 | 1,276 | 3,127 | 13,335 | 2,112 | 2,901 | 28,238 | Note ...: not applicable | 436 | 221 | 59 |
| Y.T. | 8 | 19 | 21 | 0 | 63 | 211 | 34 | 82 | 514 | 543 | Note ...: not applicable | 64 | 8 |
| N.W.T. | 164 | 9 | 127 | 102 | 118 | 363 | 100 | 62 | 893 | 303 | 108 | Note ...: not applicable | 30 |
| Nvt. | 14 | 0 | 143 | 39 | 105 | 604 | 48 | 88 | 79 | 126 | 13 | 65 | Note ...: not applicable |
|
... not applicable Source: Statistics Canada, Centre for Demography. |
|||||||||||||
Over the past year, the largest interprovincial migration flows were from Ontario to Alberta (29,422). The next highest exchanges occurred from Alberta to British Columbia (29,413) and from British Columbia to Alberta (28,238), making the net exchange relatively small (+1,175 to British Columbia). While 22,750 people moved from Ontario to British Columbia, a little over half did the same to Ontario (13,335) providing British Columbia with a net gain of 9,415 people from Ontario. Consistent with previous years, Ontario and Quebec exchanged roughly the same number of interprovincial migrants (17,487 from Quebec to Ontario and 17,315 from Ontario to Quebec).
Similarly, Ontario served as an origin source for the majority of migrants to the Atlantic provinces, with 58.0% of the migrants to Atlantic Canada originating from Ontario. This is consistent with the trends observed during the height of the pandemic in 2020/2021 during which 49.0% of all migrants to the Atlantic provinces were from Ontario. Purchasing power and migration are often interrelated and one key contributor to the observed migration trends could be the rising cost of housing in Ontario. For example, the shelter price index year-over-year change for Ontario at the onset of the pandemic was 1.3% in April 2020, which increased to 4.2% in April 2021 and further increased to 7.6% in April 2022.Note In addition, the pandemic increasingly afforded individuals with the ability to work remotely. For example, 32% of Canadian employees between the ages of 15-69 worked most of their hours from home at the beginning of 2021 (versus only 4% in 2016).Note The increased ability for individuals to telework may have contributed to increased migration from Ontario to other parts of Canada where housing may be relatively more affordable.
Notes
- Date modified: