

 |
|
 |                |
Information identified as archived is provided for reference, research or recordkeeping purposes. It is not subject to the Government of Canada Web Standards and has not been altered or updated since it was archived. Please "contact us" to request a format other than those available.
| Quarterly demographic statistics
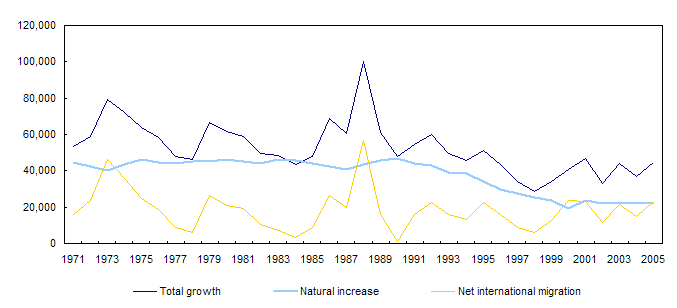
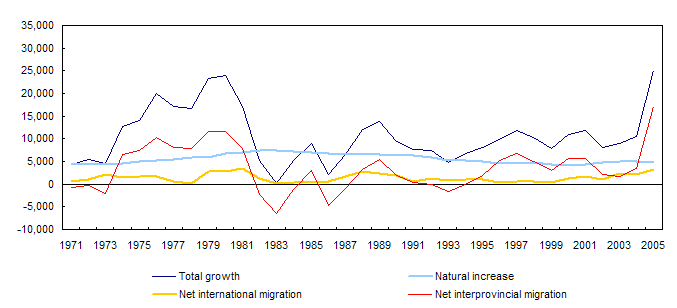
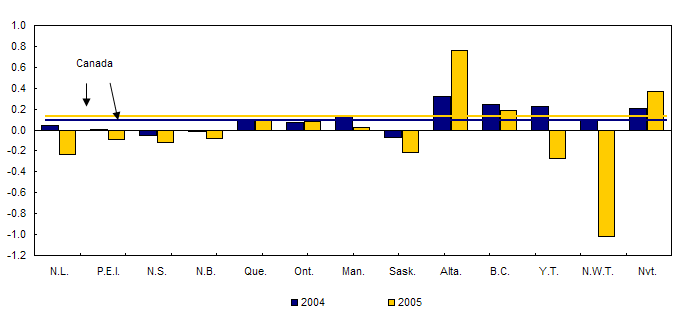
October-December 2005 Analysis In the last quarter of 2005, Canada’s population grew by 44,800, reaching 32,422,900 on January 1, 2006. Since 1995, such a large increase has occurred only in 2001, when the population grew by 46,600. This increase in population growth is mainly due to a rise in the number of immigrants arriving to Canada which raised the 2005 fourth-quarter net international migration up to 23,000 from 14,800 for the previous year. In the last three months of 2005, Canada received 55,400 immigrants, up 7,300 from the same period of the previous year. One has to go back in 2000 to see the country receive such a large number of immigrants in a fourth-quarter (57,500) (see chart 1 ).  At the provincial level, Alberta had by far the largest population increase. Alberta’s population growth rate, estimated at 0.76%, was more than five times greater than the Canadian average (0.14%). In absolute numbers, Alberta’s growth (25,100) was the highest ever attained in a fourth quarter. Only during the oil boom period in 1979-1980 was there similar growth (see chart 2 ). Alberta’s performance was mainly due to a strong increase in its net interprovincial migration. In the last quarter of 2005, the province received 17,100 more persons than it lost in its exchanges with other parts of Canada. This was an all-time high for any quarter. Net interprovincial migration accounted for more than two-thirds (68.1%) of Alberta’s population growth in the fourth quarter of 2005. By comparison, the corresponding figure for the same period in 2004 was 33.1% of the province’s total population growth.  Historically, only during the 1979-1980 period, did Alberta record net interprovincial migration figures that were similar to, although lower than, those posted in the last quarter of 2005. However, the two periods are different. In the earlier period, interprovincial movements involving Alberta were much more numerous. In conjunction with a number of in-migrants never equalled since then, the number of out-migrants was also very high. While the number of interprovincial in-migrants in the fourth quarter of 2005 did not reach the level attained in the earlier period, there were fewer out-migrants, and therefore net migration was greater. Inevitably, when one region exerts such a powerful draw, the demography of the other regions is affected. Thus, seven of Canada’s thirteen provinces and territories experienced a decrease in their population in the last three months of 2005. Only twice since 1971 have so many regions recorded a drop in the same quarter (see chart 3 ). Apart from Alberta, only British Columbia (0.19%) and Nunavut (0.37 %) registered a population growth rate above the national average. Quebec (0.09%), Ontario (0.08%) and Manitoba (0.02%) are the other regions whose population growth was positive, although below the national average. International immigration was up almost everywhere in Canada, offsetting the pull exerted by Alberta. Without this input from abroad, Manitoba would have lost population. Similarly, the demographic growth of British Columbia would have showed a 6-fold decrease and that of Quebec would have been diminished by half. As to Ontario, the increase in its net international migration made it the only region, along with Nunavut and Alberta, to have a larger population increase in the fourth quarter of 2005 than in the same quarter the previous year (see chart 4 ). The four Atlantic provinces lost population in the last quarter, as did Saskatchewan, the Yukon and the Northwest Territories. Proportionally, the Northwest Territories experienced the greatest decrease (-1.02%). Among the other regions recording losses, the Yukon (-0.27%), Newfoundland and Labrador (-0.23%) and Saskatchewan (-0.21%) were noteworthy. Along with Manitoba, which however kept a positive growth in 2005, these four regions were proportionally the most affected by the strong pull exerted by Alberta.   |
|
|
|