
Ethnicity, Language and Immigration Thematic Series
Portrait of the Filipino Populations in Canada: A Sociodemographic and Socioeconomic Analysis
Text begins
Introduction
The Portrait of the Filipino
This portrait provides a high-level descriptive analysis of the sociodemographic, socioeconomic and ethnocultural characteristics of the Filipino populations in Canada. Drawing from multiple sources, including the Census of Population, the Labour Force Survey and the General Social Survey, it examines key areas such as demographic and linguistic diversity, educational attainment, labour market outcomes, occupations, overqualification, and social inclusion. The topics explored in this portrait were shaped through informal engagement and consultation with Filipino community organizations and subject-matter experts.
By highlighting trends in demographics, linguistic profiles, religious affiliation, education, employment and social inclusion, this portrait offers a comprehensive view of how Filipino populations navigate life in Canada. Additionally, it explores how various factors, including immigrant status, gender, generation status and admission category, shape the unique experiences of Filipino individuals and families across the country, using an intersectional approach. This analysis serves as an important resource for understanding the contributions of Filipino populations to Canadian society and the challenges they face. The insights provide information to develop more targeted programs and services to address the unique needs of the Filipino populations in Canada.
Filipino populations in Canada are distinctive for their strong sense of community, high rates of labour force participation, and social networks that facilitate economic and social inclusion. As a predominantly immigrant group, with a large portion of Filipinos immigrating to Canada in recent decades, their experiences reflect a unique blend of transnational ties and adaptation to Canadian society.
Executive summary
- Over 957,000 individuals in Canada reported being Filipino in the 2021 Census, a fourfold increase since 1996. Filipinos represented 2.6% of the total population in Canada and 9.9% of the racialized population, making them the fourth-largest racialized group in 2021.
- According to the latest available population projections, the Filipino populations could number from 1.7 million to 2.4 million people by 2041, constituting 4.0% to 4.6% of the population in Canada.
- In 2021, about 6 in 10 Filipinos (60.6%) resided in Ontario (38.0%) and Alberta (22.6%), followed by British Columbia (18.2%), Manitoba (9.9%), Quebec (4.7%) and Saskatchewan (4.6%).
- Manitoba has the largest share of Filipinos (7.2% of the provincial population), followed by Alberta (5.2%), Yukon (4.9%), the Northwest Territories (4.1%) and Saskatchewan (4.0%). In contrast, Filipinos accounted for 2.6% of the population of Ontario.
- Winnipeg had the highest share of Filipinos compared with all other census metropolitan areas (CMAs). In 2021, 1 in 10 individuals residing in Winnipeg (10.3%) was Filipino.
- While the majority of Filipinos (89.7%) lived in CMAs in 2021, they accounted for the highest share of racialized populations living in census agglomerations (5.7%) and the second-highest share living in rural areas (4.7%), after the Japanese populations.
- Among census agglomerations (CAs), Brooks, Alberta, had the highest share of Filipinos. In 2021, 13.4% of the total population of Brooks was Filipino. Among rural census subdivisions, Neepawa, Manitoba, had the highest share of Filipinos. In 2021, nearly half (46.8%) of Neepawa’s total population was Filipino.
- One-quarter of the Filipino populations (24.7%) were born in Canada, while the majority (75.3%) were born outside Canada. Of the foreign-born population, 98.2% were born in the Philippines—this proportion has been above 95% since the 1996 Census. The remaining foreign-born Filipinos enumerated in the 2021 Census came from various countries, such as the United States, Saudi Arabia and the United Arab Emirates (for a total of 75 places of birth).
- Among Filipinos in Canada, 97.2% had at least one parent born in the Philippines, and 91.0% had both parents born there. Among foreign-born Filipinos born outside the Philippines, 88.2% had at least one parent born in the Philippines, and 74.8% had both parents born there.
- In 2021, nearly three-quarters (71.5%) of Filipinos were immigrants (individuals who are, or who have ever been, landed immigrants or permanent residents)—a proportion that has remained relatively stable since 1996 (between 69.5% and 74.6%). Among immigrant Filipinos, 7 in 10 (72.6%) immigrated in the previous two decades (from 2001 to 2021).
- According to the 2021 Census, 76.4% of Filipinos who had immigrated to Canada since 1980 were admitted as economic immigrants, 23.1% were sponsored by family and a few came as refugees (0.2%).
- Within the economic immigrant category, the largest group of Filipinos was admitted under the caregiver
streamNote (42.9%), reflecting a longstanding trend of Filipinos (mainly women) admitted through caregiving programs. Filipino immigrants were admitted at nearly 33 times the rate of the rest of the immigrant population in this category. - Among Filipino immigrants admitted from 1980 to 1990, 51.1% were admitted as economic immigrants and 48.5% through family sponsorship. By the 2011-to-2021 period, economic immigration rose to 82.3%, while family sponsorship declined to 17.3% and refugees remained below 0.3%.
- Among Filipinos who were admitted as economic immigrants from 1980 to 1990, 70.5% were skilled workers and 27.8% were caregivers. By 2011 to 2021, caregivers (46.1%) and provincial nominees (37.1%) became the primary streams, while the share of skilled workers fell to 11.1%.
- Three-quarters (75.3%) of the Filipino populations were first-generation immigrants, while 22.7% were in the second generation (at least one parent born abroad) and 2.0% were in the third generation or more (both parents born in Canada).
- The Filipino populations in Canada have been predominantly women since the 1996 Census. The ratio of women to men has changed from 1.4 women per man in 1996 to 1.2 women per man in 2021 as the share of Filipino women decreased. This gender distribution largely reflects the immigration admission programs, such as the caregiver programs, under which 32.8% of Filipino immigrant women were admitted to Canada.
- Over half (58.5%) of Filipinos were of working age (aged 25 to 64) in 2021. Children younger than 15 represented 18.4% of Filipinos, followed by 15.0% who were youth (15 to 24 years) and less than 1 in 10 (8.2%) who were 65 and older.
- Tagalog (Pilipino, Filipino) was the most frequently reported mother tongue (58.4%) in 2021, followed by English (44.1%). Beyond these languages, over 50 other mother tongues were reported by the Filipino populations, such as Ilocano (4.5%), Cebuano (2.6%) and Hiligaynon (1.3%).
- Nearly three in four Filipinos (72.4%) reported being Roman Catholic in 2021. Overall, 94.3% of Filipinos reported a religious affiliation; however, reporting having no religion or having secular perspectives increased across generations (11.3% of the second generation and 32.6% of the third generation or more).
- In 2021, nearly half (46.0%) of the Filipino populations aged 25 to 54 held a bachelor’s degree or higher, primarily earned outside Canada, while a notable share (31.4%) held a postsecondary certificate or diploma below the bachelor level.
- Filipino women aged 25 to 54 were more likely to hold a bachelor’s degree or higher (51.8%) than their male counterparts (38.3%) in 2021. This gender gap has more than doubled since 1996.
- According to the 2021 Census, the employment rate of Filipinos aged 25 to 54 was 84.3%, with women (82.2%) less likely to be employed than men (87.2%). Among Filipinos with a bachelor’s degree or higher, women (85.0%) were less likely to be employed than men (90.6%).
- Among immigrants aged 25 to 54 with a bachelor’s degree or higher, unemployment rates were higher among recent immigrants (6.8% for women and 4.8% for men) than among established immigrants (5.6% for women and 4.6% for men). In both groups, women had higher unemployment rates than men.
- Among recent immigrants aged 25 to 54 with a bachelor’s degree or higher, unemployment rates were highest among family-sponsored immigrants (10.7% for women and 5.7% for men), compared with economic immigrants (6.9% for women and 4.2% for men). Within the economic category, women admitted through caregiver streams (6.9%) had higher unemployment rates than those admitted as skilled workers (5.3%) or provincial nominees (5.7%).
- Among Filipinos aged 25 to 54 with a bachelor’s degree or higher, 49.5% were overqualified, meaning they worked in jobs requiring no more than a high school education despite holding a university degree. This rate was more than four times the rate among the non-racialized, non-Indigenous population (11.9%) and above the national average (18.2%).
- The overqualification rate was 50.8% for Filipino women and 47.1% for Filipino men. Among recent immigrants with Canadian-earned credentials, 27.9% of men and 30.1% of women were overqualified. However, the rates more than doubled among those educated in the Philippines (60.4% for men; 63.5% for women).
- Among those aged 25 to 54, Filipinos were more likely to work in health occupations or in sales and service occupations than the non-racialized, non-Indigenous population. In 2021, 28.0% of Filipino women worked in health occupations, more than twice the proportion of non-racialized, non-Indigenous women (11.7%). A notable share of Filipino men (24.7%) and Filipino women (29.6%) were employed in sales and service occupations.
- In 2021, 19.1% of Filipinos held professional and management occupations, compared with 36.2% of the non-racialized, non-Indigenous population. Conversely, over four in ten Filipinos (41.3%) were employed in semi-skilled, labour, and entry-level occupations, compared with 22.9% of the non-racialized, non-Indigenous population.
- Filipino populations reported a strong sense of belonging to Canada (92.0%), at a rate higher than the non-racialized, non-Indigenous population (84.7%). This held across all geographic levels studied, with 89.9% of Filipinos reporting a strong sense of belonging to their province, 89.4% to their town or city, and 87.7% to their local community.
- At the same time, Filipinos (31.6%) were nearly three times as likely as the non-racialized, non-Indigenous population (11.8%) to report having experienced discrimination, especially in a store, bank or restaurant. The most common grounds for discrimination among Filipinos were race or skin colour (22.8%), ethnicity or culture (16.3%), and language (7.9%).
Population of interest
Description for Figure 1
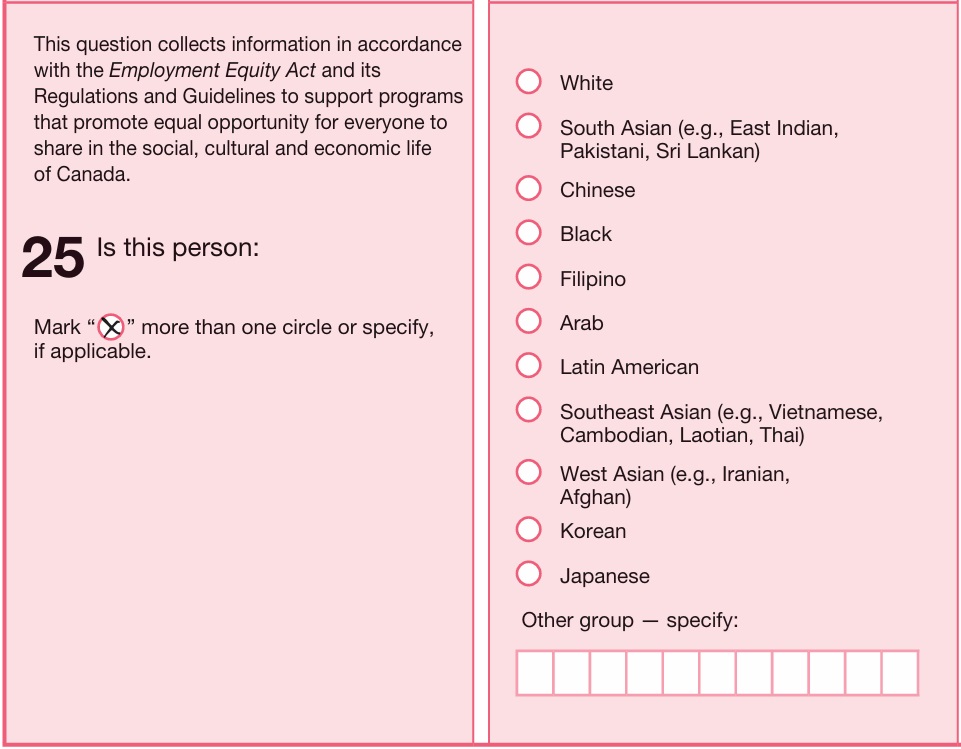
The image depicts question 25, the population group question, on the 2021 Census of Population.
It states, “This question collects information in accordance with the Employment Equity Act and its Regulations and Guidelines to support programs that promote equal opportunity for everyone to share in the social, cultural and economic life of Canada.”
The image also consists of 11 mark-in circles for respondents to report if they are “White”, “South Asian (e.g., East Indian, Pakistani, Sri Lankan)”, “Chinese”, “Black”, “Filipino”, “Arab”, “Latin American”, “Southeast Asian (e.g., Vietnamese, Cambodian, Laotian, Thai)”, “West Asian (e.g., Iranian, Afghan)”, “Korean” or “Japanese”. It also depicts the field, “Other group — specify”, where respondents may provide a write-in response to this question. Respondents may select multiple categories, or provide a write-in response with one or more mark-in responses.
In this portrait, Filipino populations were defined and measured through the population group question in the Census of Population. Since the 1996 Census, “Filipino” has been one of the population groups listed on the census questionnaire, based on the Employment Equity Act and its regulations. Respondents can choose to mark one or more population groups or specify another group. This portrait includes individuals who selected only the Filipino category or provided a write-in response associated with that category, such as Igorot or Ilocano, or did both, as well as those who selected any of the above in combination with either the White category or a write-in response associated with White. This approach is consistent with the methods used for other racialized groups in this portrait series (e.g., South Asian, Chinese, Black and Arab). The non-racialized, non-Indigenous population consists of those who neither self-reported a racialized group nor self-reported as First Nations, Métis or Inuit (Inuk).
Details on populations who reported as Filipino and one or more other racialized groups are provided in a highlight box, and these populations are excluded from the analysis. This approach is aligned with the methodology used in the portrait series and is used because respondents who identified as belonging to multiple racialized groups cannot be identified in a comparable way across census cycles. In 2021, 71,815 individuals identified as Filipino and at least one other racialized group (e.g., Chinese, South Asian, Black) or as Filipino and two or more other racialized groups.
Start of text box
A brief history of the Filipino populations in Canada
According to archival census records, the earliest documented Filipino immigrant in Canada is Benson Flores, who reported arriving in 1861 and was enumerated on Bowen Island, British Columbia, in the 1911 Census (Library and Archives Canada,
Based on the 1971 Census, fewer than 100 people who immigrated from the Philippines had arrived in Canada before 1931, and immigration remained limited in the decades that followed. Substantial migration from the Philippines and other Asian countries began only after major policy reforms in the late 1960s and 1970s. From 1965 to 1971, more than 11,000 people immigrated from the Philippines to Canada, representing about 90% of those enumerated in the 1971 Census.
Immigration from Asian countries expanded after 1967, when Canada implemented a new points-based immigration system, and no longer used the place of birth as the basis of admission (Li, 2003). This marked a turning point in the diversification of immigration flows. Soon after, the Immigration Act of 1976 explicitly promoted multiculturalism and family reunification (United Nations High Commission for Refugees, 2020). These policy changes encouraged broader immigration from Asia, including the Philippines, which in 1967 was recognized for the first time as a separate reporting category in immigration statistics by the Department of Manpower and Immigration. Before this, Filipino immigrants were grouped under “Other Countries, not British,” while countries such as China, India, Japan and Pakistan were already distinguished (Bonifacio, 2013; Department of Manpower and Immigration, 1973).
During the early 1970s, Filipino immigration increased modestly following the declaration of martial law in the
In 1992, the Live-in Caregiver Program (LCP) replaced the Foreign Domestic Movement Program, formalizing the live-in requirement and expanding eligibility (Citizenship and Immigration Canada,
Filipino immigration continued to diversify in the 2000s, especially with the rise of provincial recruitment agreements. In 2008, the governments of the four Western provinces (British Columbia, Alberta, Saskatchewan and Manitoba) signed separate memoranda of understanding with the Philippines to attract Filipino workers to address labour shortages, especially in high-demand areas like health care, construction and oil (Government of Alberta, 2008; Government of British Columbia, 2008; Government of Manitoba, 2008; Government of Saskatchewan, 2006).
In 2010, Canada increased funding for foreign credential referral services for immigrants coming from the Philippines, India and China who were federal skilled workers. The federal LCP in 1992 and its predecessor the 1981 Foreign Domestic Movement Program, and the Provincial Nominee Program are known avenues for workers who wish to gain permanent residency, and because the majority of those who work in these industries are women, the gendered split is seen in earlier waves of immigration (Citizenship and Immigration Canada, 2010).
In 2021, the Filipino populations in Canada were nearly 1 million individuals. Compared with other racialized groups in Canada, Filipino populations have more recently immigrated, with nearly half of immigrants admitted from 2012 to 2021 (Statistics Canada, 2022a). In 2016, the Philippines was the top source country (15.6%) for recent immigrants to Canada, and in 2021, it was second (11.4%) only to India (18.6%) (Statistics Canada, 2022b).
Over the last few decades, Filipino populations in Canada have established themselves as integral members of urban centres like Toronto, Vancouver, Winnipeg, Montréal, Calgary and Edmonton, as well as in other parts of the country. Currently, there are a variety of Filipino associations across Canada that foster and participate in community festivals and civic celebrations. Filipino populations in Canada have also established newspapers, magazines, and TV and radio stations (Canadian Heritage, 2025). On October 30, 2018, the House of Commons adopted a motion designating June as Filipino Heritage Month throughout Canada. This month acknowledges and celebrates the long and rich history of Filipino Canadians and the valuable contributions of the Filipino diaspora across Canada.
End of text box
Section 1: Demography, geography and immigration
Filipino populations in Canada quadruple from 1996 to 2021
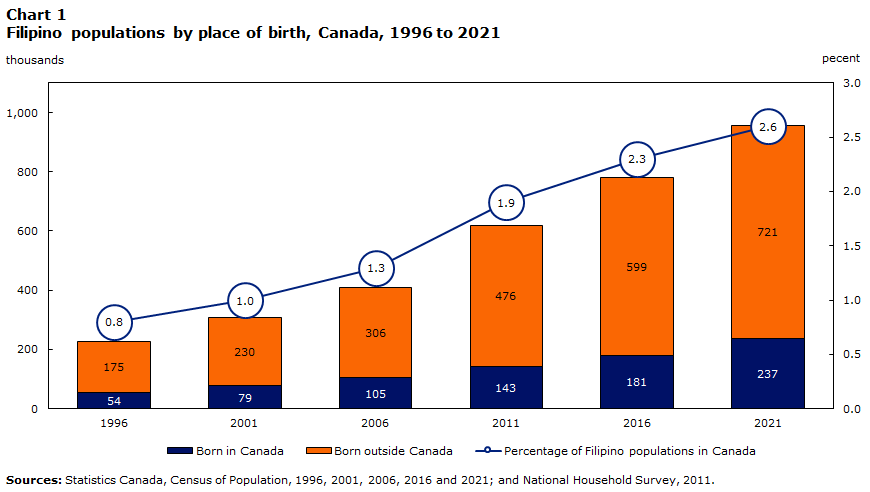
Filipino populations in Canada have quadrupled since 1996, increasing from 234,195 in 1996 to 957,355 in 2021. In 2021, Filipinos represented 2.6% of the total Canadian population and 9.9% of the racialized population, making them the fourth-largest racialized group in Canada. In comparison, in 1996, the Filipino populations accounted for 0.8% of the total Canadian population and 7.3% of the racialized population (Chart 1).
The Filipino populations in Canada was one of the fastest-growing communities from 2001 to 2021, along with the Arab and West Asian
Data table for Chart 1
| Census year | Born in Canada | Born outside Canada | Filipino populations in Canada |
|---|---|---|---|
| number | pecent | ||
| Sources: Statistics Canada, Census of Population, 1996, 2001, 2006, 2016 and 2021; and National Household Survey, 2011. | |||
| 1996 | 53,795 | 174,680 | 0.8 |
| 2001 | 78,670 | 229,905 | 1.0 |
| 2006 | 104,705 | 305,990 | 1.3 |
| 2011 | 142,850 | 476,465 | 1.9 |
| 2016 | 181,170 | 598,960 | 2.3 |
| 2021 | 236,605 | 720,755 | 2.6 |
Three-quarters of Filipinos in Canada are foreign-born, with over 98.2% born in the Philippines
In 2021, the Filipino populations in Canada reported more than 75 different places of birth. Nearly one-quarter (24.7%, or 236,600 individuals) were born in Canada, while the majority (75.3%, or 720,750 individuals), were foreign-born. Of the foreign-born population, 98.2% (707,500 individuals) were born in the Philippines, and this proportion has remained stable since 1996 (95.6% to 98.8%). The remaining 1.8% of foreign-born Filipinos in 2021 (13,250 individuals) were born in countries such as the United States, Saudi Arabia, the United Arab Emirates, Kuwait, the United Kingdom and Singapore, with each accounting for less than 0.5% of the total population. Among foreign-born Filipinos born outside the Philippines, 88.2% (11,695 individuals) had at least one parent born in the Philippines, and 74.8% had both parents born in the Philippines. In total, 97.1% of all Filipino populations had at least one parent born in the Philippines, and 91.0% had both parents born in the Philippines.
Among Filipinos born in Canada, men (51.7%, or 122,265 individuals) accounted for a slightly higher share than women (48.3%, or 114,340 individuals). In contrast, among Filipinos born in the Philippines, women made up a larger proportion, accounting for 57.8% (408,725 individuals), while men represented 42.2% (298,775 individuals). These differences reflect gendered immigration patterns from the Philippines, with women more likely than men to have immigrated to Canada.
Over three in five Filipinos in Canada reside in Ontario and Alberta
In 2021, the most common province of residence for Filipinos in Canada was Ontario, with 38.0% of these populations (363,650 people) calling the province home. Alberta had the second-largest share of the Filipino populations, with 22.6% (216,710 people), followed by British Columbia, with 18.2% (174,280 people). Manitoba had a notable Filipino presence as well, with 9.9% of the Filipino populations (94,315 people), while Saskatchewan was home to 4.6% (43,760 people). Overall, the majority (55.3%) of the Filipino populations lived in the four Western provinces. This is not the case for any other racialized group except the Japanese populations. Quebec recorded 4.7% of the Filipino populations (44,880 people). Among the Atlantic provinces, Nova Scotia had the largest share of the Filipino populations, with 0.7% (6,615 people), followed by New Brunswick at 0.5% (5,190 people), Newfoundland and Labrador at 0.2% (2,270 people), and Prince Edward Island at 0.2% (1,760 people).
| Filipino populations | ||||
|---|---|---|---|---|
| population | proportion in the total |
proportion in the total racialized |
||
| number | percent | |||
|
||||
| Canada | 957,355 | 100.0 | 2.6 | 9.9 |
| Newfoundland and Labrador | 2,270 | 0.2 | 0.5 | 13.4 |
| Prince Edward Island | 1,760 | 0.2 | 1.2 | 12.3 |
| Nova Scotia | 6,615 | 0.7 | 0.7 | 7.1 |
| New Brunswick | 5,190 | 0.5 | 0.7 | 11.7 |
| Quebec | 44,880 | 4.7 | 0.5 | 3.3 |
| Ontario | 363,650 | 38.0 | 2.6 | 7.5 |
| Manitoba | 94,315 | 9.9 | 7.2 | 32.4 |
| Saskatchewan | 43,760 | 4.6 | 4.0 | 27.5 |
| Alberta | 216,710 | 22.6 | 5.2 | 18.7 |
| British Columbia | 174,280 | 18.2 | 3.5 | 10.3 |
| Yukon | 1,945 | 0.2 | 4.9 | 38.4 |
| Northwest Territories | 1,665 | 0.2 | 4.1 | 33.8 |
| Nunavut | 36,858 | 0.4 | 0.8 | 23.5 |
The share of the Filipino populations is most notable in the Prairie provinces, where they account for a larger proportion of the total population compared with other provinces. The largest shares of the population that was Filipino were in Manitoba (7.2%), Alberta (5.2%) and Saskatchewan (4.0%). By contrast, although Ontario and British Columbia were the two most common provinces of residence for Filipinos, Filipinos made up 3.5% of the population in British Columbia and 2.6% in Ontario. Among all provinces, Manitoba had the largest share of racialized residents who were Filipino, at 32.4%. Compared with its share of Canada’s total population (11.5%) in 2021, Alberta accounted for 22.6% of the Filipino populations. Similar patterns were observed in Manitoba and Saskatchewan, which together made up 14.4% of the Filipino populations while representing 6.7% of the national population (3.6% and 3.1%, respectively). As of 2021, Filipinos accounted for more than one‑fifth (22.0%) of the racialized populations in the Prairie provinces. These proportions point to the Prairie provinces, particularly Alberta, as prominent destinations for Filipino migration. In contrast, Quebec accounted for 23.0% of the total Canadian population but was home to 4.7% of the Filipino populations. The concentration of Filipinos in English-speaking provinces in Canada can be understood in relation to historical patterns of settlement, particularly in Western Canada (see A brief history of the Filipino populations in Canada). Linguistic characteristics may have facilitated these patterns, as English is frequently reported as a mother tongue, either alone or in combination with other languages, such as Tagalog, Ilocano and Cebuano, while French is reported by a very small proportion of Filipinos (less than 1%) (see Section 2).
Filipinos account for the largest share of racialized populations in the territories
In 2021, 0.2% of the Filipino populations lived in Yukon (1,945 people), 0.2% in the Northwest Territories (1,665 people) and less than 0.1% in Nunavut (315 people). Overall, 0.4% of the Filipino populations in Canada (3,925 people) resided in the territories. Filipinos represented 4.9% of the population in Yukon, 4.1% in the Northwest Territories and 0.8% in Nunavut. Across the territories, Filipinos accounted for 3.4% of the total population.
Despite their small absolute numbers, Filipinos represented a substantial proportion of the racialized populations in each territory. In 2021, Filipinos accounted for 38.4% of the racialized populations in Yukon, 33.8% in the Northwest Territories and 23.5% in Nunavut. Taken together, Filipinos represented 34.7% of the racialized populations across the territories, the largest share among racialized groups. In 2021, the Philippines was the most common country of birth for immigrants in the Northwest Territories, Nunavut and Yukon (Statistics Canada, 2022c).
The demographic profile of Filipinos in the territories also reveals a pronounced gender pattern. Within the racialized populations, Filipino women accounted for a large share of racialized women in Yukon, the Northwest Territories and Nunavut. In 2021, Filipino women represented 41.3% of the population of racialized women in Yukon, 35.7% in the Northwest Territories and 27.7% in Nunavut.
In Yukon, early Filipino women working as nannies arrived in the mid-1980s through Canada’s Live-in Caregiver Program (LCP) and later sponsored family members to join them, helping to found a growing community in Whitehorse (Alarcon, 2024). Territorial immigration programs (for example, the Yukon Nominee Program, established in the late 2000s to help employers recruit overseas talent) have actively brought in Filipino workers for hard-to-fill roles. Over half of all workers nominated through the Yukon Nominee Program have come from the Philippines. Yukon signed a 2022 memorandum of understanding with the Philippines to streamline the hiring of Filipino workers and protect their rights under the nominee program (Government of Yukon, 2022). These labour and immigration streams, from caregiver visas to nominee and temporary worker programs, have drawn a predominance of Filipino migrants to the North. Many of these migrants are women employed in essential services (from health care and caregiving to hospitality).
The Filipino populations in Canada predominantly reside in census metropolitan areas
The Filipino populations in Canada predominantly reside in urban
Filipinos made up 10.3% of the population of the Winnipeg CMA, more than in any other
Filipinos account for the largest share of racialized populations in census agglomerations
In 2021, 5.7% of the Filipino populations (54,530 people) lived in census agglomerations (CAs)—urban areas with at least 10,000 people—the highest share among all racialized populations, compared with 2.8% for racialized populations overall.
The Filipino populations in 2021 was distributed across 110 CAs in Canada. The largest Filipino populations among CAs were observed in Wood Buffalo, Alberta (5,940), accounting for 0.6% of the total Filipino population in Canada, followed by Grande Prairie, Alberta (4,370; 0.5%); Lloydminster, Alberta and Saskatchewan (3,230; 0.3%); Brooks, Alberta (1,960; 0.2%); and Whitehorse, Yukon (1,830; 0.2%). The other CAs among the top 10 were Steinbach, Manitoba (1,515; 0.2%); Prince George, British Columbia (1,495; 0.2%); High River, Alberta (1,480; 0.2%); Prince Albert, Saskatchewan (1,455; 0.2%); and Yellowknife, Northwest Territories (1,375; 0.2%). Within CAs, Filipino populations were concentrated primarily in Western Canada, particularly in Alberta, Saskatchewan and Manitoba.
Filipinos were also overrepresented in many of these CAs, compared with the total population and the racialized populations. In 2021, Filipinos accounted for more than 10% of the total population in Brooks (13.4%) and High River (10.5%), followed by Lloydminster (9.0%) and Steinbach (8.6%). They also accounted for about 6% to 8% of the total population in Wood Buffalo (8.1%); Estevan, Saskatchewan (8.1%); Wetaskiwin, Alberta (8.0%); Swift Current, Saskatchewan (7.2%); Grande Prairie (6.9%); and Yellowknife (6.9%).
Filipinos account for the second-largest share of racialized populations in rural areas
In this portrait, a rural area is a CMA and CA influenced zone
The largest Filipino population in a rural CSD was observed in Neepawa, Manitoba (2,600), followed by Cold Lake, Alberta (720); Slave Lake, Alberta (715); Hinton, Alberta (675); Whitecourt, Alberta (650); and Banff, Alberta (600). Other rural communities with sizable Filipino populations included Humboldt, Saskatchewan (595); Whistler, British Columbia (570); Taber, Alberta (560); Peace River, Alberta (535); and Edson, Alberta (515).
In 2021, Filipinos accounted for 46.8% of the total population in Neepawa, the highest share observed among rural CSDs, followed by Slave Lake (10.7%), Humboldt (10.2%), Banff (8.8%), Peace River (8.3%), Hinton (6.9%), Whitecourt (6.6%), Taber (6.4%), Edson (6.3%), Cold Lake (4.7%) and Whistler (4.2%).
| Filipino populations | ||||
|---|---|---|---|---|
| population | proportion in the total |
proportion in the total racialized |
||
| number | percent | |||
|
||||
| Canada | 957,355 | 100.0 | 2.6 | 9.9 |
| Census metropolitan area (CMA) | 858,295 | 89.7 | 3.2 | 9.3 |
| Toronto, Ont. | 281,150 | 29.4 | 4.6 | 8.0 |
| Vancouver, B.C. | 142,125 | 14.8 | 5.5 | 10.0 |
| Calgary, Alta. | 89,055 | 9.3 | 6.1 | 15.7 |
| Winnipeg, Man. | 84,225 | 8.8 | 10.3 | 32.6 |
| Edmonton, Alta. | 80,760 | 8.4 | 5.8 | 17.5 |
| Montréal, Que. | 40,310 | 4.2 | 1.0 | 3.5 |
| Ottawa–Gatineau, Ont./Que. | 16,105 | 1.7 | 1.1 | 4.2 |
| Hamilton, Ont. | 14,955 | 1.6 | 1.9 | 8.2 |
| Saskatoon, Sask. | 14,800 | 1.5 | 4.8 | 22.2 |
| Regina, Sask. | 12,105 | 1.3 | 4.9 | 20.9 |
| Census agglomeration (CA) | 54,530 | 5.7 | 1.5 | 20.3 |
| Wood Buffalo, Alta. | 5,940 | 0.6 | 8.1 | 30.3 |
| Grande Prairie, Alta. | 4,370 | 0.5 | 6.9 | 43.5 |
| Lloydminster, Alta./Sask. | 3,230 | 0.3 | 9.0 | 59.8 |
| Brooks, Alta. | 1,960 | 0.2 | 13.4 | 27.6 |
| Whitehorse, Y.T. | 1,830 | 0.2 | 5.8 | 38.7 |
| Steinbach, Man. | 1,515 | 0.2 | 8.6 | 54.8 |
| Prince George, B.C. | 1,495 | 0.2 | 1.7 | 16.4 |
| High River, Alta. | 1,480 | 0.2 | 10.5 | 59.8 |
| Prince Albert, Sask. | 1,455 | 0.2 | 3.4 | 34.1 |
| Yellowknife, N.W.T. | 1,375 | 0.1 | 6.9 | 34.5 |
| Rural census subdivision (not a CMA or CA) | 44,530 | 4.7 | 0.8 | 24.6 |
| Neepawa, Man. | 2,600 | 0.3 | 46.8 | 88.3 |
| Cold Lake, Alta. | 720 | 0.1 | 4.7 | 46.6 |
| Slave Lake, Alta. | 715 | 0.1 | 10.7 | 55.6 |
| Hinton, Alta. | 675 | 0.1 | 6.9 | 52.5 |
| Whitecourt, Alta. | 650 | 0.1 | 6.6 | 62.8 |
| Banff, Alta. | 600 | 0.1 | 8.8 | 34.4 |
| Humboldt, Sask. | 595 | 0.1 | 10.2 | 73.5 |
| Whistler, B.C. | 570 | 0.1 | 4.2 | 33.3 |
| Taber, Alta. | 560 | 0.1 | 6.4 | 56.9 |
| Peace River, Alta. | 535 | 0.1 | 8.3 | 53.8 |
Compared with other racialized groups, Filipino populations in Canada are predominantly first generation immigrants, with fewer multigenerational ties
As of 2021, three-quarters of the Filipino populations (75.3%) in Canada were in the first
Other racialized populations in Canada had a lower proportion of first-generation immigrants (68.6%) and a higher representation of second-generation individuals (27.4%), with the third generation or more accounting for 4.0%. The broader Canadian population had a significantly different generational profile, with 26.4% being in the first generation, 17.6% in the second generation and a majority (56.0%) in the third generation or more. Most Filipino populations in Canada are still in the early stages of settlement and integration compared with other racialized groups like the Black or Chinese communities, which have more multigenerational representation (Hou, Schimmele & Stick, 2023; Lusis, 2009).
The majority of Filipino immigrants are of working age, while the second generation and third generation or more are predominantly children and youth
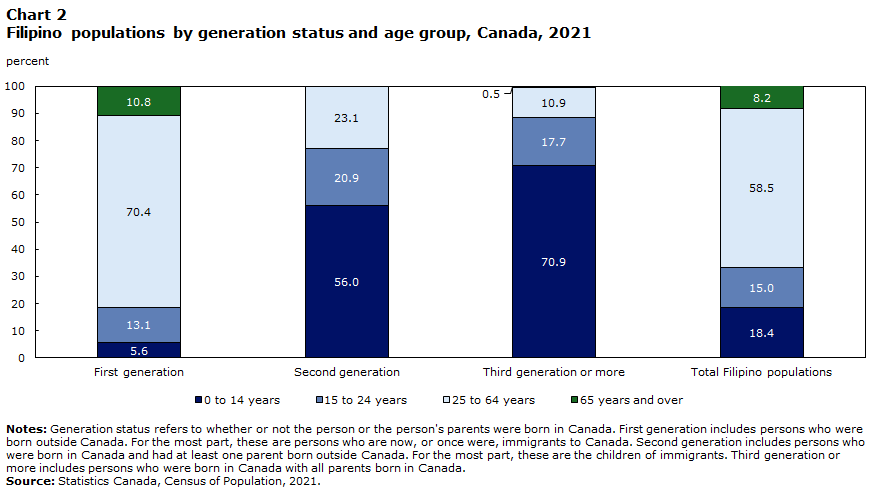
The Filipino populations in Canada are diverse in terms of age distribution across generations.
Data table for Chart 2
| Age group | First generation | Second generation | Third generation or more | Total Filipino populations |
|---|---|---|---|---|
| percent | ||||
| Notes: Generation status refers to whether or not the person or the person's parents were born in Canada. First generation includes persons who were born outside Canada. For the most part, these are persons who are now, or once were, immigrants to Canada. Second generation includes persons who were born in Canada and had at least one parent born outside Canada. For the most part, these are the children of immigrants. Third generation or more includes persons who were born in Canada with all parents born in Canada. Source: Statistics Canada, Census of Population, 2021. |
||||
| 0 to 14 years | 5.6 | 56.0 | 70.9 | 18.4 |
| 15 to 24 years | 13.1 | 20.9 | 17.7 | 15.0 |
| 25 to 64 years | 70.4 | 23.1 | 10.9 | 58.5 |
| 65 years and over | 10.8 | 0.0 | 0.5 | 8.2 |
In contrast, the second generation had a younger age structure, with 56.0% aged 14 years and younger and 23.1% aged 25 to 64. The third generation or more showed an even younger profile, with 70.9% aged 14 years and younger and 10.9% in the 25 to 64 age group. Specifically, 15.0% of Filipinos were aged 15 to 24, of whom 20.9% were in the second generation and 17.7% were in the third generation or more.
In 2021, over half (58.5%) of Filipinos were of working age (aged 25 to 64) and 15.0% were youth (aged 15 to 24). Overall, compared with the total Canadian population, Filipino populations have a notably younger age structure. In 2021, 18.4% of Filipinos were aged 14 and younger, compared with 16.5% of the overall population, while 8.2% of Filipinos were aged 65 and older, less than half the national share (18.1%). Filipino children still outnumbered Filipino seniors, a demographic pattern that contrasts with Canada’s aging population.
This relatively young age distribution is closely tied to the community’s recent migration history, compared with other racialized groups with deeper generational roots (Hou, Schimmele & Stick, 2023). The population has also aged noticeably over time, with the number of Filipino seniors (65 and older) increasing by 338% from 2001 to 2021 (Hou, Schimmele & Stick, 2023). In 2021, the majority of Filipino seniors were first-generation immigrants. A key demographic feature of this population is the prevalence of intergenerational living. In 2021, 13.5% of Filipinos were living in a multigenerational household, the second-highest rate after South Asian populations. These generational differences are addressed in Section 2 and Section 3.
Immigration continues to drive the growth of the Filipino populations in Canada
The Filipino populations in Canada have been shaped by successive waves of immigration, particularly starting in the 1990s. In 2021, immigrants—individuals who are, or who have ever been, landed immigrants or permanent residents in Canada—made up almost three-quarters (71.5%, or 684,570 individuals) of the Filipino populations. This proportion has remained relatively stable over the past 25 years, varying between 69.5% and 74.6% from 1996 to 2021. Of the immigrant Filipinos living in Canada in 2021, 7 out of 10 (72.6%) immigrated from 2001 to 2021.
Among Filipino immigrants in Canada, nearly half (46.6%, or 318,670 people) immigrated to Canada from 2011 to 2021. Immigrants admitted after 2011 represent nearly half of the total Filipino immigrant population and one-third (33.3%) of the total Filipino populations in Canada.
Filipino immigrants in Canada in 2021 can be divided into several cohorts by period of immigration. A relatively small share of Filipino immigrants (5.4%, or 37,300 individuals) immigrated to Canada before 1980. This share rose slightly for immigrants who were admitted from 1980 to 1990, to 45,815 individuals (6.7%). Filipino immigrants admitted during the 1990s accounted for 104,535 individuals (15.3%) among those living in Canada in 2021. A larger share—26.0%, or 178,255 people—immigrated from 2001 to 2010. The most recent period, from 2011 to 2021, accounted for the largest proportion of Filipino immigrants living in Canada in 2021, with 318,670 individuals (46.6%) admitted during that time. Overall, based on the period of immigration of Filipino immigrants living in Canada in 2021, the size of this population almost doubled with each decade following 1980.
Women consistently outnumbered men among Filipino immigrants across all immigration periods. For example, among those who immigrated before 1980, 59.6% were women, a pattern that persisted in later decades: women made up 61.7% of arrivals from 1991 to 2000 and 56.1% from 2011 to 2021. While the gender gap narrowed slightly in more recent periods, women continued to represent a majority (57.5%) of Filipino immigrants in Canada in 2021.
In addition to immigrants, Filipino populations in Canada include non-permanent residents (NPRs)—people from other countries with a usual place of residence in Canada and who have a work or study permit or who have claimed refugee status (asylum claimants, protected persons and related groups), and their
Filipino immigration to Canada is predominantly labour-driven
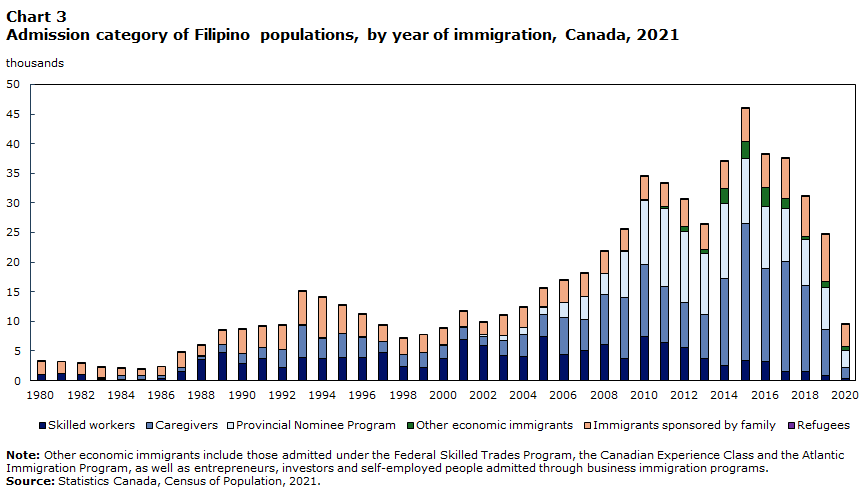
In Canada, immigrants are selected according to three broad objectives: to enhance and promote economic development, to reunite families, and to fulfill the country’s international obligations and uphold its humanitarian tradition. Changes to immigration policies and programs, along with global events, have played a key role in shaping immigration trends in Canada, including immigration trends related to the Filipino populations.
Data table for Chart 3
| Year of immigration | Skilled workers | Caregivers | Provincial Nominee Program | Other economic immigrants | Immigrants sponsored by family | Refugees |
|---|---|---|---|---|---|---|
| number | ||||||
| Note: Other economic immigrants include those admitted under the Federal Skilled Trades Program, the Canadian Experience Class and the Atlantic Immigration Program, as well as entrepreneurs, investors and self-employed people admitted through business immigration programs. Source: Statistics Canada, Census of Population, 2021. |
||||||
| 1980 | 1,020 | 0 | 0 | 15 | 2,115 | 20 |
| 1981 | 1,200 | 0 | 0 | 40 | 1,905 | 0 |
| 1982 | 1,005 | 0 | 0 | 15 | 1,785 | 10 |
| 1983 | 215 | 190 | 0 | 25 | 1,830 | 15 |
| 1984 | 150 | 630 | 0 | 25 | 1,310 | 20 |
| 1985 | 130 | 665 | 0 | 0 | 1,100 | 20 |
| 1986 | 385 | 480 | 0 | 65 | 1,490 | 0 |
| 1987 | 1,515 | 690 | 0 | 15 | 2,565 | 15 |
| 1988 | 3,495 | 620 | 0 | 35 | 1,850 | 15 |
| 1989 | 4,760 | 1,310 | 0 | 70 | 2,350 | 20 |
| 1990 | 2,930 | 1,625 | 0 | 80 | 3,940 | 10 |
| 1991 | 3,655 | 1,920 | 0 | 25 | 3,560 | 55 |
| 1992 | 2,260 | 2,915 | 0 | 85 | 3,995 | 45 |
| 1993 | 3,975 | 5,395 | 0 | 75 | 5,550 | 40 |
| 1994 | 3,650 | 3,530 | 0 | 85 | 6,835 | 15 |
| 1995 | 3,905 | 3,960 | 0 | 10 | 4,715 | 25 |
| 1996 | 3,895 | 3,300 | 235 | 40 | 3,645 | 20 |
| 1997 | 4,760 | 1,795 | 40 | 40 | 2,695 | 10 |
| 1998 | 2,340 | 2,105 | 0 | 0 | 2,680 | 10 |
| 1999 | 2,265 | 2,420 | 70 | 35 | 2,975 | 0 |
| 2000 | 3,795 | 2,065 | 230 | 20 | 2,715 | 10 |
| 2001 | 7,005 | 1,975 | 150 | 20 | 2,575 | 15 |
| 2002 | 5,930 | 1,565 | 325 | 0 | 2,000 | 20 |
| 2003 | 4,200 | 2,545 | 925 | 0 | 3,350 | 20 |
| 2004 | 4,095 | 3,650 | 1,200 | 25 | 3,335 | 45 |
| 2005 | 7,420 | 3,805 | 1,145 | 70 | 3,085 | 75 |
| 2006 | 4,395 | 6,315 | 2,400 | 45 | 3,770 | 80 |
| 2007 | 5,145 | 5,175 | 3,885 | 0 | 3,885 | 50 |
| 2008 | 6,075 | 8,380 | 3,675 | 30 | 3,600 | 20 |
| 2009 | 3,665 | 10,290 | 7,905 | 45 | 3,550 | 30 |
| 2010 | 7,475 | 12,060 | 10,940 | 95 | 3,845 | 20 |
| 2011 | 6,340 | 9,615 | 13,050 | 420 | 3,840 | 25 |
| 2012 | 5,530 | 7,665 | 11,925 | 890 | 4,635 | 20 |
| 2013 | 3,755 | 7,315 | 10,360 | 695 | 4,265 | 35 |
| 2014 | 2,505 | 14,690 | 12,675 | 2,530 | 4,560 | 40 |
| 2015 | 3,370 | 23,100 | 11,085 | 2,865 | 5,450 | 60 |
| 2016 | 3,205 | 15,760 | 10,490 | 3,165 | 5,520 | 30 |
| 2017 | 1,600 | 18,555 | 8,955 | 1,580 | 6,775 | 15 |
| 2018 | 1,575 | 14,410 | 7,765 | 620 | 6,725 | 30 |
| 2019 | 885 | 7,785 | 7,020 | 1,095 | 7,880 | 10 |
| 2020 | 285 | 1,840 | 3,015 | 545 | 3,785 | 30 |
The admission categories of Filipino
| 1980 to 1990 | 1991 to 2000 | 2001 to 2010 | 2011 to 2021 | |
|---|---|---|---|---|
| percent | ||||
Source: Statistics Canada, Census of Population, 2021. |
||||
| Economic immigrants | 51.1 | 62.1 | 80.8 | 82.3 |
| Skilled workers | 36.7 | 33.0 | 31.1 | 9.1 |
| Caregivers | 13.6 | 28.1 | 31.3 | 37.9 |
| Provincial Nominee Program | 0.0 | 0.6 | 18.3 | 30.5 |
| Other economic |
0.9 | 0.4 | 0.2 | 4.7 |
| Immigrants sponsored by family | 48.5 | 37.7 | 18.5 | 17.3 |
| Refugees | 0.3 | 0.2 | 0.2 | 0.1 |
| Other immigrants | 0.1 | 0.0 | 0.5 | 0.4 |
Historically, the composition of Filipino immigrants has evolved across immigration cohorts. Among those admitted from 1980 to 1990, just over half (51.1%) entered through economic immigration, while a similarly large share (48.5%) were admitted through family sponsorship. This near-parity shifted for the 1991-to-2000 cohort, as economic admissions increased to 62.1% and family sponsorship declined to 37.7%. By the 2001-to-2010 period, economic immigration had become the primary stream, representing 80.8% of admissions, rising further to 82.3% among those admitted from 2011 to 2021. Over the same period, family sponsorship fell steadily, from 48.5% in the 1980s to 18.5% in the 2001-to-2010 period and 17.3% in the most recent decade. Refugees consistently represented a very small share across all cohorts, decreasing from 0.3% in the 1980s to 0.1% for the 2011-to-2021 cohort.
Filipino economic immigrants enter Canada as caregivers at about 33 times the rate of other immigrant populations, while skilled worker representation is lower compared with other economic immigrant populations
The Filipino populations in Canada primarily entered through various economic immigration categories, with caregiver programs, skilled worker programs and the Provincial Nominee Program (PNP) being the most significant streams. Among the 494,475 Filipino economic immigrants, 212,295 people, or 42.9%, were admitted as caregivers, making this category a primary immigration stream for Filipino newcomers, compared with 1.3% for the rest of the economic immigrant populations. Filipinos made up the vast majority of all economic immigrants admitted as caregivers from 1980 to 2021; 82.1% of all women and 87.9% of all men admitted under this stream were Filipinos. Women accounted for approximately two-thirds (67.0%) of the Filipino caregiver population and men for one-third (33.0%). Overall, women admitted as caregivers accounted for 38.1% of all Filipino immigrants admitted to Canada from 1980 to 2021.
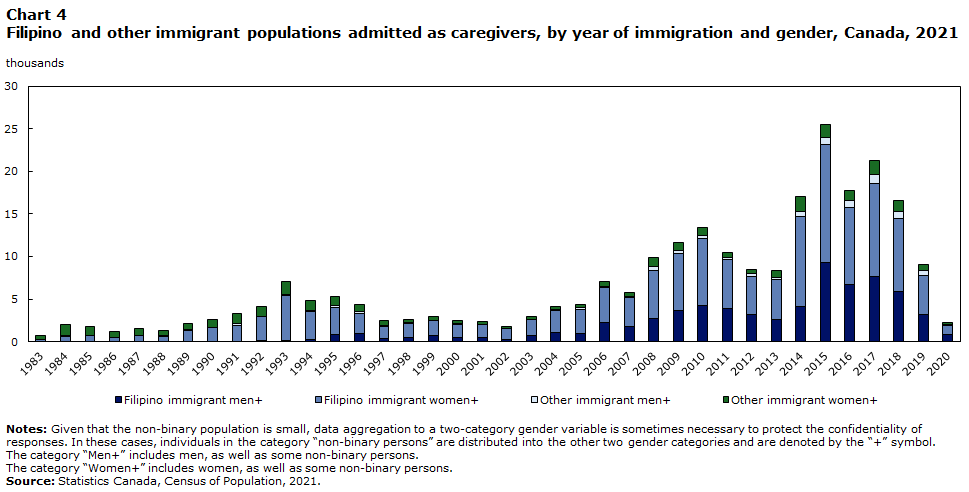
Data table for Chart 4
| Year of immigration | Filipino immigrant men+ | Filipino immigrant women+ | Other immigrant men+ | Other immigrant women+ |
|---|---|---|---|---|
| number | ||||
| Note: Given that the non-binary population is small, data aggregation to a two-category gender variable is sometimes necessary to protect the confidentiality of responses. In these cases, individuals in the category “non-binary persons” are distributed into the other two gender categories and are denoted by the “+” symbol. The category “Men+” includes men, as well as some non-binary persons. The category “Women+” includes women, as well as some non-binary persons. Source: Statistics Canada, Census of Population, 2021. |
||||
| 1983 | 10 | 180 | 15 | 515 |
| 1984 | 0 | 630 | 60 | 1,335 |
| 1985 | 10 | 655 | 65 | 1,015 |
| 1986 | 15 | 465 | 30 | 715 |
| 1987 | 30 | 665 | 40 | 800 |
| 1988 | 20 | 605 | 35 | 615 |
| 1989 | 30 | 1,280 | 60 | 705 |
| 1990 | 55 | 1,570 | 60 | 920 |
| 1991 | 70 | 1,845 | 260 | 1,125 |
| 1992 | 100 | 2,815 | 65 | 1,190 |
| 1993 | 105 | 5,290 | 115 | 1,605 |
| 1994 | 250 | 3,280 | 140 | 1,125 |
| 1995 | 875 | 3,085 | 225 | 1,090 |
| 1996 | 960 | 2,345 | 225 | 825 |
| 1997 | 405 | 1,390 | 115 | 530 |
| 1998 | 500 | 1,600 | 95 | 430 |
| 1999 | 685 | 1,740 | 90 | 395 |
| 2000 | 500 | 1,560 | 105 | 310 |
| 2001 | 490 | 1,490 | 65 | 345 |
| 2002 | 305 | 1,260 | 20 | 245 |
| 2003 | 670 | 1,880 | 75 | 285 |
| 2004 | 1,020 | 2,625 | 85 | 410 |
| 2005 | 975 | 2,835 | 145 | 425 |
| 2006 | 2,225 | 4,090 | 200 | 500 |
| 2007 | 1,760 | 3,410 | 180 | 450 |
| 2008 | 2,735 | 5,645 | 385 | 1,055 |
| 2009 | 3,655 | 6,635 | 425 | 970 |
| 2010 | 4,235 | 7,820 | 430 | 965 |
| 2011 | 3,865 | 5,750 | 285 | 620 |
| 2012 | 3,180 | 4,480 | 385 | 455 |
| 2013 | 2,585 | 4,730 | 255 | 740 |
| 2014 | 4,095 | 10,595 | 555 | 1,775 |
| 2015 | 9,340 | 13,755 | 920 | 1,475 |
| 2016 | 6,750 | 9,015 | 805 | 1,150 |
| 2017 | 7,640 | 10,915 | 1,060 | 1,610 |
| 2018 | 5,840 | 8,575 | 870 | 1,230 |
| 2019 | 3,240 | 4,545 | 530 | 695 |
| 2020 | 815 | 1,025 | 130 | 285 |
In contrast, 135,835 Filipino economic immigrants, or 27.5%, were admitted as skilled workers, a considerably lower share than among the rest of the economic immigrant populations (69.3%). The PNP accounted for 26.4% of Filipino economic immigrants (130,335 people), almost twice the rate for other immigrants (13.8%), and 3.2% of Filipino economic immigrants (16,020 people) entered through other economic immigrant
Historically, the composition of Filipino economic immigrants has shifted markedly across immigration periods. In the 1980-to-1990 cohort, nearly all Filipino economic immigrants entered through federal programs, primarily as skilled workers (71.8%), with caregivers representing 26.6%. For the 1991-to-2000 cohort, the skilled worker share declined to 53.2%, while caregiver admissions rose to 45.3%. For the 2001-to-2010 cohort, skilled workers (38.5%) and caregivers (38.7%) formed similar proportions, and the PNP, introduced in 1998 to help provinces address labour shortages and distribute immigration beyond major cities (Picot, Hou & Crossman, 2023), accounted for 22.6%. Among recent economic immigrants (those admitted from 2011 to 2021), caregivers (46.1%) and provincial nominees (37.1%) became the predominant streams, while the skilled worker share fell to 11.1%. This shift aligns with broader national trends identified by Picot et al. (2023), which show that the expansion of the PNP has increasingly directed immigration toward provincial labour needs, contributing to the growing share of Filipino newcomers admitted through the caregiver and provincial nominee streams. A more detailed analysis of labour-market outcomes by admission category, including the caregiver, skilled worker and PNP streams, is presented in Section 3.
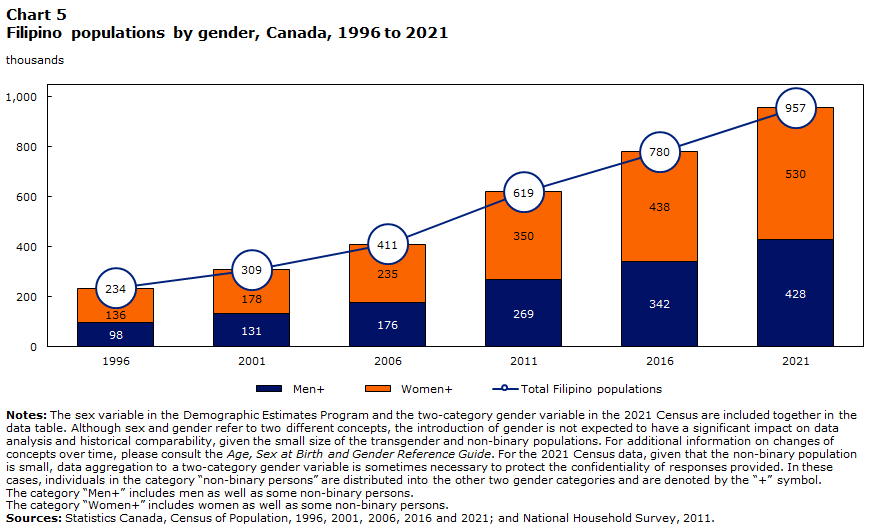
Data table for Chart 5
| Census year | Men+ | Women+ | Total Filipino populations |
|---|---|---|---|
| thousands | |||
| Notes: The sex variable in the Demographic Estimates Program and the two-category gender variable in the 2021 Census are included together in the data table. Although sex and gender refer to two different concepts, the introduction of gender is not expected to have a significant impact on data analysis and historical comparability, given the small size of the transgender and non-binary populations. For additional information on changes of concepts over time, please consult the Age, Sex at Birth and Gender Reference Guide. For the 2021 Census data, given that the non-binary population is small, data aggregation to a two-category gender variable is sometimes necessary to protect the confidentiality of responses provided. In these cases, individuals in the category “non-binary persons” are distributed into the other two gender categories and are denoted by the “+” symbol. The category “Men+” includes men as well as some non-binary persons. The category “Women+” includes women as well as some non-binary persons. Sources: Statistics Canada, Census of Population, 1996, 2001, 2006, 2016 and 2021; and National Household Survey, 2011. |
|||
| 1996 | 97,850 | 136,350 | 234,195 |
| 2001 | 130,995 | 177,585 | 308,575 |
| 2006 | 175,640 | 235,060 | 410,695 |
| 2011 | 268,885 | 350,430 | 619,315 |
| 2016 | 341,800 | 438,330 | 780,125 |
| 2021 | 427,755 | 529,600 | 957,355 |
Filipino women outnumber men, but their share has decreased over the past 25 years
Overall, the Filipino populations in Canada comprised 44.7% men and 55.3% women. From 1996 to 2021, the number of Filipino men increased by 337%, from 97,850 in 1996 to 427,755 in 2021. The number of Filipino women increased by approximately 288%, from 136,350 in 1996 to 529,600 in 2021. The ratio of women to men changed from 1.4 women per man in 1996 to 1.2 women per man in 2021.
The gender distribution varies by generation status
The distribution of the Filipino populations in Canada by generation status shows a distinct gender pattern. In 2021, women represented a larger share of the first generation, making up 57.6% of the Filipino populations in this generation, while men represented 42.4%, following the gendered immigration patterns from the Philippines. Working-age first-generation women accounted for nearly one-third (31.2%) of the total Filipino populations, compared with 21.8% of working-age first-generation men. The second generation showed a more balanced gender distribution, with men accounting for 51.7% of the population and women 48.3%. This trend persisted for the third generation or more, with men making up 51.4% and women 48.6%.
In terms of the ratio of women to men, in 2021, the Filipino populations had a ratio of 1.24 women for every man. In the first generation, this ratio was higher, at 1.36 women. For the second generation, the ratio was more balanced, calculated at approximately 0.93 women. Finally, in the third generation or more, the ratio remained close to parity, with about 0.95 women. This highlights that while the first generation of Filipinos is notably women-dominated, the gender distribution in subsequent generations diverges from the near-parity observed among Canadian-born populations. In the overall Canadian population, the gender ratios were more even across generations: 1.07 in the first generation, 0.99 in the second generation, and 1.01 in the third generation or more.
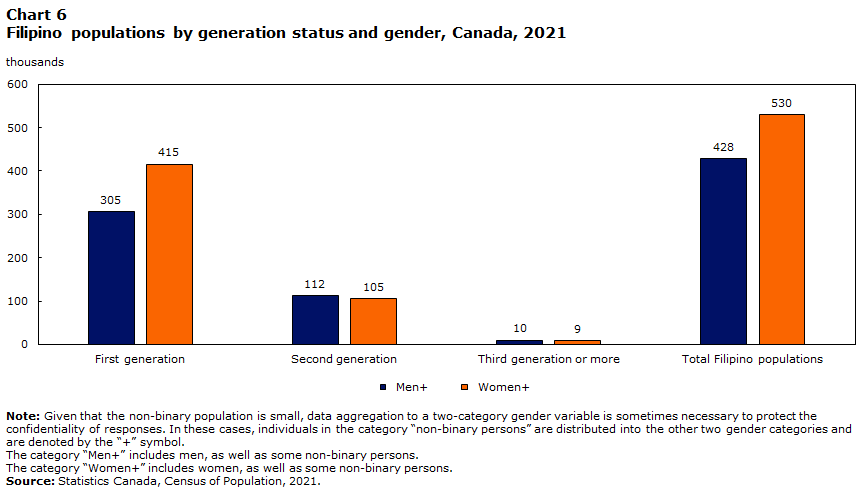
Data table for Chart 6
| Generation status | Men+ | Women+ |
|---|---|---|
| thousands | ||
| Note: Given that the non-binary population is small, data aggregation to a two-category gender variable is sometimes necessary to protect the confidentiality of responses. In these cases, individuals in the category “non-binary persons” are distributed into the other two gender categories and are denoted by the “+” symbol. The category “Men+” includes men, as well as some non-binary persons. The category “Women+” includes women, as well as some non-binary persons. Source: Statistics Canada, Census of Population, 2021. |
||
| First generation | 305,490 | 415,260 |
| Second generation | 112,355 | 104,975 |
| Third generation or more | 9,910 | 9,365 |
| Total Filipino populations | 427,755 | 529,600 |
This trend is closely linked to Canada’s immigration policies, which historically facilitated the entry of Filipino women through caregiver and nursing streams. As a result, the overrepresentation of women in the first generation was partly shaped by labour migration patterns that disproportionately recruited Filipino women into feminized care work. These structural patterns contributed to the demographic composition and the employment trajectories of the Filipino populations in Canada. Gendered differences in education, unemployment and occupational distribution are explored in depth in Section 3.
Start of text box
Filipinos belonging to multiple racialized groups
In 2021, about one in fourteen Filipinos in Canada (7.0%), or 71,815 individuals, were members of multiple racialized groups (Filipino and at least one other
Filipinos belonging to multiple racialized groups represented a highly diverse population with varied backgrounds. They were also a relatively young population, with a median age of 22. The most common combinations were Filipino and Chinese (26.0%) and Filipino and Southeast Asian (20.2%). Others identified as Filipino and South Asian (7.9%), Black (7.5%), Latin American (5.1%), Arab (2.6%), West Asian (1.6%), Japanese (1.5%) and Korean (0.7%). Additionally, one in four (24.4%), or 17,500 individuals, were part of 3 or more of the 10 main racialized groups listed in the Census of the Population, including Filipino. Among Filipinos counted as members of multiple racialized groups, 2.6% did not report belonging to any of the 10 main racialized groups, instead identifying as Filipino alongside a write-in response specifying another racialized group.
Filipinos in multiple racialized groups were also more likely to be born in Canada than the broader Filipino population. More than half (57.8%) of Filipinos belonging to multiple racialized groups were born in Canada. Among those belonging to two population groups, the highest shares of Canadian-born individuals were found among those who were Filipino and Latin American (88.2%), Filipino and Black (87.1%), and Filipino and West Asian (86.8%). In contrast, the lowest shares of Canadian-born individuals were seen among the Filipino and Southeast Asian group (30.2%) and Filipino and Chinese group (47.2%). A difference was also observed in the share of Canadian-born Filipinos belonging to multiple racialized groups, with those belonging to three or more racialized groups (67.9%) being more likely to be born in Canada than those belonging to two racialized groups (54.5%).
Among Filipinos belonging to multiple racialized groups, most of those born outside Canada were born in the Philippines (81.3%). This proportion was especially high among the Filipino and Southeast Asian (95.9%) and Filipino and Chinese (92.9%) groups. In contrast, individuals identifying as Filipino and Black or Filipino and Arab had more varied origins, with 27.3% and 33.3%, respectively, born in the Philippines. These groups showed broader migration patterns, with notable shares born in the United States (10.8%) and, Jamaica (10.1%), and among Arab and Filipino group 17.0% were born in the United Arab Emirates and 13.7% in Saudi Arabia. Among those in three or more racialized groups, the Philippines remained the most common birthplace (52.7%), followed by countries in South and East Asia, the Americas, and the Middle East.
Parental origins reflected similar diversity. While the majority of 76.8% had at least one parent born in the Philippines, especially in the Filipino and Southeast Asian (93.4%) and Filipino and Chinese (88.0%) groups, this was less common among Filipino and Black (67.7%) individuals, 13.2% of whom had at least one parents from Jamaica. Among Filipinos belonging to multiple racialized groups, 42.2% were in the first generation, 47.7% were in the second generation and 10.1% were in the third generation or more. This share was even higher among those belonging to three or more racialized groups, nearly one-quarter (23.7%) of whom were in the third generation or more. These patterns suggest that, in addition to immigration, long-term settlement in Canada contributes to the evolving diversity of the Filipino populations.
End of text box
Section 2: Linguistic and religious diversity
More than two-thirds of the Filipino populations report only Tagalog or only English as their mother tongue
Linguistic diversity, particularly in terms of mother tongue—the first language learned in childhood and still understood—is a key indicator of a population’s cultural background. Among the Filipino populations in Canada, their linguistic profile reflects their immigrant experiences and the multilingual nature of the Philippines.
In 2021, the majority of the Filipino populations reported either Tagalog or English as their sole mother tongue. Tagalog, also referred to as Pilipino or Filipino, was the most frequently reported language. About half (45.7%) of the Filipino populations in Canada indicated only Tagalog as their mother tongue. The distribution of Tagalog as a mother tongue among Filipinos in Canada closely mirrors the overall distribution of Filipino populations across provinces and territories. For example, Ontario accounted for 38.0% of the Filipino populations and 36.7% of those reporting Tagalog only as their mother tongue, with similarly aligned shares in British Columbia (18.2% and 17.9%) and Alberta (22.6% and 23.4%). In most provinces and territories, the proportion of Filipinos reporting Tagalog as their sole mother tongue was close to the national average of 45.7%, but it was notably higher in Prince Edward Island (58.2%), Manitoba (52.0%) and Nunavut (56.5%), and slightly above the average in Nova Scotia, New Brunswick, Alberta and Saskatchewan. Nationally, 1.2% of the total population reported Tagalog only as their mother tongue and identified as Filipino in 2021. This proportion was higher in the Prairie provinces—Manitoba (3.8%), Alberta (2.5%) and Saskatchewan (2.0%)—and in British Columbia (1.6%). In the territories, the proportions were also above the national average, at 2.0% in Yukon and 1.9% in the Northwest Territories, except in Nunavut (0.5%), where the share was lower. The share of individuals who reported Tagalog as their mother tongue among the total population is closely associated with the size of Filipino populations in each region, as nearly half of Filipinos in Canada declared Tagalog as their mother tongue.
A similar pattern was observed across CMAs. Toronto accounted for 29.4% of the Filipino populations and 29.1% of those who reported Tagalog only as their mother tongue, followed by Vancouver (14.8% and 14.7%), Calgary (9.3% and 9.4%), Winnipeg (8.8% and 9.8%), and Edmonton (8.4% and 8.8%). In most CMAs, the proportion of Filipinos reporting Tagalog only as their mother tongue was close to the national average of 45.7%, but it was notably higher in Winnipeg (51.8%); Saskatoon (50.6%); Lethbridge, Alberta (50.9%); Saint John, New Brunswick (53.1%); and Sherbrooke, Quebec (51.0%). The proportion of the total population reporting Tagalog only as their mother tongue and identifying as Filipino was also higher than the national average of 1.2% in several CMAs, including Winnipeg (5.3%), Red Deer (3.9%), Saskatoon (2.4%), Calgary (2.8%), Edmonton (2.8%) and Vancouver (2.4%), Regina (2.3%) and Toronto (2.1%). As with the provinces and territories, this share is closely associated with the size of Filipino populations in each CMA, as nearly half of Filipinos across Canada reported Tagalog as their mother tongue in 2021.
Among Filipino populations, 31.0% reported only English as their mother tongue. English is another official language of the Philippines. In contrast, 0.2% of Filipinos reported French as their sole mother tongue, compared with 5.0% for other racialized groups and 26.0% for the non-racialized, non-Indigenous population. This low share of French speakers among Filipinos is related to their geographic distribution, as relatively few Filipinos in the second generation and third generation or more reside in Quebec. Notably, 54.6% of Filipinos reported non-official languages as their only mother tongue, a figure comparable to that for other racialized populations (57.3%) yet higher than for the non-racialized, non-Indigenous population (8.7%). Moreover, 14.3% of Filipinos provided multiple mother tongue responses, reflecting a rich multilingual heritage. This is the highest proportion among all racialized groups, above the 8.8% observed for other racialized groups and 2.0% among the non-racialized, non-Indigenous population.
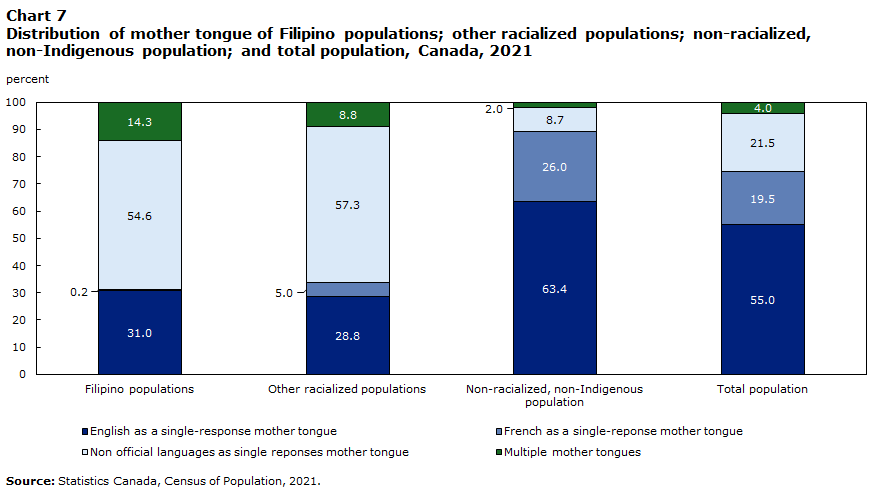
Data table for Chart 7
| Mother tongue | Filipino populations | Other racialized populations | Non-racialized, non-Indigenous population | Total population |
|---|---|---|---|---|
| percent | ||||
| Source: Statistics Canada, Census of Population, 2021. | ||||
| English as a single-response mother tongue | 31.0 | 28.8 | 63.4 | 55.0 |
| French as a single-reponse mother tongue | 0.2 | 5.0 | 26.0 | 19.5 |
| Non official languages as single reponses mother tongue | 54.6 | 57.3 | 8.7 | 21.5 |
| Multiple mother tongues | 14.3 | 8.8 | 2.0 | 4.0 |
In 2021, the most common multiple-response mother tongue combination reported by Filipinos was Tagalog and English (10.9%, or 104,125 individuals). Other frequently reported two-language combinations included Tagalog and Ilocano (0.4%, or 4,020 individuals), English and Cebuano (0.3%, or 3,230 individuals), Ilocano and English (0.3%, or 3,140 individuals), and English and French (0.3%, or 2,925 individuals). Smaller shares reported English and Hiligaynon (0.2%, or 1,595 individuals) and Tagalog and Cebuano (0.2%, or 1,495 individuals), followed by English and Bisaya (0.1%, or 1,100 individuals), Tagalog and Bisaya (0.1%, or 935 individuals), and Tagalog and Hiligaynon (0.1%, or 830 individuals).
Among Filipinos reporting multiple responses with three components or more, the most common combination was Tagalog, English and one or more other non-official languages (0.6%, or 6,060 individuals), followed by Tagalog, English and French (0.3%, or 3,055 individuals). In addition, 0.1% (885 individuals) reported Tagalog and other non-official languages. A further 0.3% (2,945 individuals) reported other multiple-response combinations.
The diversity of Filipino mother tongues mirrors the Philippines’ multilingual landscape. Overall, beyond Tagalog (Pilipino, Filipino) and English, over 50 other mother tongues were reported by the Filipino populations in Canada. Including multiple responses, 58.4% of Filipinos reported Tagalog as their mother tongue, followed by English (44.1%) and several regional languages from the Philippines, such as Ilocano (4.5%), Cebuano (2.6%) and Hiligaynon (1.3%), alone or with other languages. Other regional languages, such as Bisaya, Pampangan (Kapampangan) and Bikol, were also reported in the 2021 Census, although in smaller numbers. These languages reflect the Philippines’ rich cultural and linguistic diversity, as a country home to over 130 distinct languages (McFarland, 1994). These languages, native to specific regions in the Philippines, contribute to the diversity of the Filipino linguistic landscape in Canada. While a majority speaks the official languages of the Philippines, the use of regional languages continues to underscore the linguistic diversity of Filipino Canadians.
Some Filipinos also reported non-Philippine languages as their mother tongue, including Spanish, Arabic and German. This reflects both the Philippines’ colonial history and the diverse migration patterns of Filipinos, who have settled in Canada from various parts of the world.
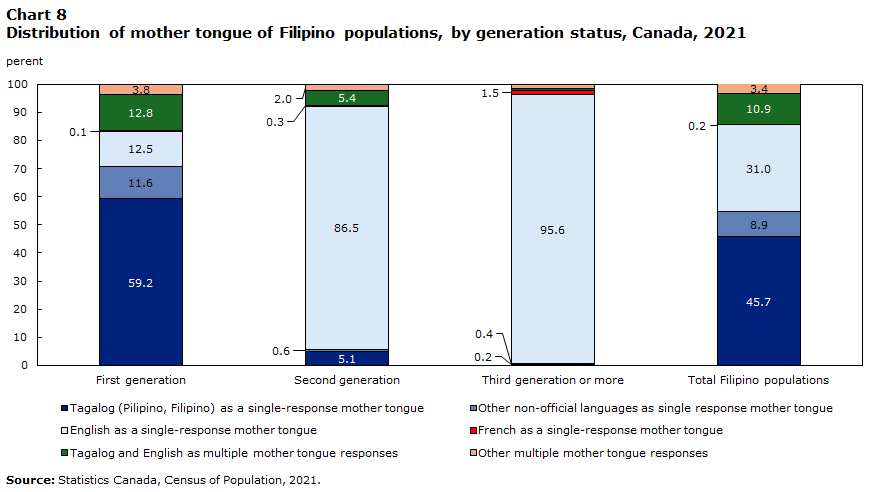
First-generation Filipinos largely report non-official languages as their mother tongue, while second-generation Filipinos most often report English
The linguistic diversity of the Filipino populations in Canada varied across generations. Among the first generation, which comprised the largest group within these populations (75.3%), non-official languages were the most reported. In this generation, 70.8% reported a non-official language as their only mother tongue, with Tagalog (Pilipino, Filipino) as the most common (59.2%). Other regional languages from the Philippines, such as Ilocano (4.5%) and Cebuano (2.5%), were also frequently reported.
In contrast, second-generation Filipinos—those born and raised in Canada—reported a shift toward official languages as their mother tongue. In 2021, 86.5% reported only English as their mother tongue, while 5.1% reported only Tagalog. Other non-official languages, such as Ilocano and Cebuano, were reported by 0.6% of Filipinos. This shift reflects a generational change in early language exposure within Canadian-born populations.
The decline of non-official languages as mother tongues across generations: Non-official languages nearly disappear by the third generation or more
By the third generation or more, non-official languages as mother tongues nearly disappeared. Among Filipinos in the third generation or more, 0.6% reported a non-official language as their sole mother tongue, with Tagalog (Pilipino, Filipino) being the most common, reported by 0.4%. The vast majority (95.6%) of Filipinos in the third generation or more reported English as their only mother tongue, while 1.5% reported French as their only mother tongue.
The proportion of Filipinos reporting non-official languages, particularly Tagalog, Ilocano and Cebuano, as their mother tongue declined across generations. While first-generation immigrants often learned these languages in childhood before arriving in Canada, Filipinos in the second generation and the third generation or more were more likely to report English as their mother tongue. The share of respondents reporting Tagalog as their sole mother tongue decreased from 59.2% in the first generation to 5.1% in the second, and to 0.4% in the third generation or more. Taken together, these trends point to a strong generational shift toward English, with non-official languages nearly disappearing as mother tongues by the third generation or more.
Data table for Chart 8
| Mother tongue | First generation | Second generation | Third generation or more | Total Filipino populations |
|---|---|---|---|---|
| percent | ||||
| Source: Statistics Canada, Census of Population, 2021. | ||||
| Tagalog (Pilipino, Filipino) as a single-response mother tongue | 59.2 | 5.1 | 0.4 | 45.7 |
| Other non-official languages as single response mother tongue | 11.6 | 0.6 | 0.2 | 8.9 |
| English as a single-response mother tongue | 12.5 | 86.5 | 95.6 | 31.0 |
| French as a single-response mother tongue | 0.1 | 0.3 | 1.5 | 0.2 |
| Tagalog and English as multiple mother tongue responses | 12.8 | 5.4 | 0.7 | 10.9 |
| Other multiple mother tongue responses | 3.8 | 2.0 | 1.6 | 3.4 |
Multiple-response mother tongues also varied by generation. Reporting both Tagalog and English was most common in the first generation (12.8%), declined in the second generation (5.4%) and was less prevalent in the third generation or more (0.7%). Other multiple-response combinations followed a similar pattern, decreasing from 3.8% in the first generation to 2.0% in the second generation and 1.6% in the third generation or more. Overall, these results point to a generational shift from non-official languages, particularly Tagalog, toward English as the primary mother tongue, alongside a decline in multiple-response reporting across generations. Further insight into language retention can be drawn from the language used most often at home, or knowledge of official languages.
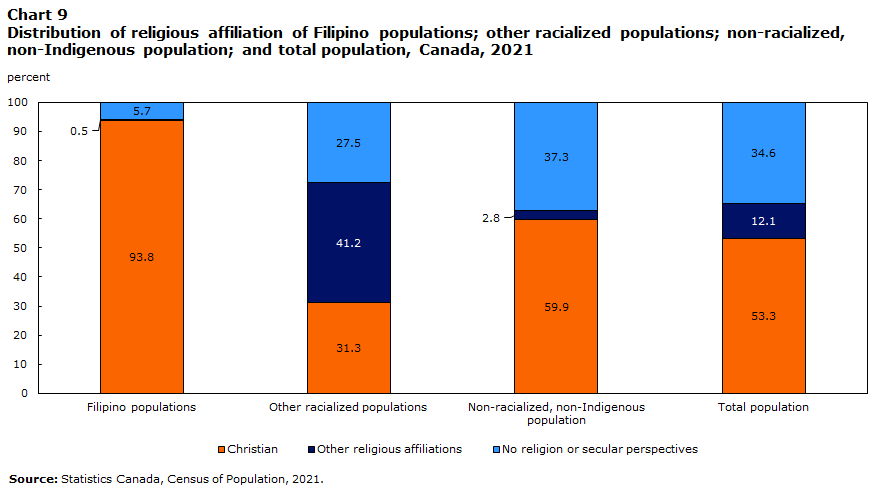
Over 9 in 10 Filipino people in Canada report a religious affiliation
In 2021, the Filipino populations in Canada reported more than 50 distinct religious affiliations. Based on the 2021 Census, the Filipino populations had a high rate of religious
Those who reported having no religion or having secular perspectives made up a small proportion of the Filipino populations (5.7%), compared with over one-third of the non-racialized, non-Indigenous population (37.3%) and about one-fourth of other racialized groups (27.5%).
Data table for Chart 9
| Religious affiliation | Filipino populations | Other racialized populations | Non-racialized, non-Indigenous population | Total population |
|---|---|---|---|---|
| percent | ||||
| Source: Statistics Canada, Census of Population, 2021. | ||||
| Christian | 93.8 | 31.3 | 59.9 | 53.3 |
| Other religious affiliations | 0.5 | 41.2 | 2.8 | 12.1 |
| No religion or secular perspectives | 5.7 | 27.5 | 37.3 | 34.6 |
Nearly three in four Filipino people in Canada report being Roman Catholic
Christianity, specifically Catholicism, is the dominant religion among the Filipino populations in Canada. More than 9 in 10 Filipino people (93.8%) identified as Christian, which is notably higher than the non-racialized, non-Indigenous population (59.9%) and other racialized populations (31.3%). More than three-quarters (77.2%) of Filipino Christians or 72.4 of Filipino populations reported being Roman Catholic. The history of the Philippines, marked by Spanish colonization and the subsequent influence of the Roman Catholic Church, has shaped current religious affiliations among Filipino populations, both in the Philippines and in diasporic communities such as those in Canada (Bonifacio, 2013).
Beyond Christian denominations, 0.5% of Filipinos reported other religious affiliations, including Islam, Judaism, Hinduism and other smaller religious groups. While these groups are numerically limited, especially compared with other racialized populations (41.2%) and the non-racialized, non-Indigenous population (2.8%), they remain present and contribute to religious diversity within Filipino populations.
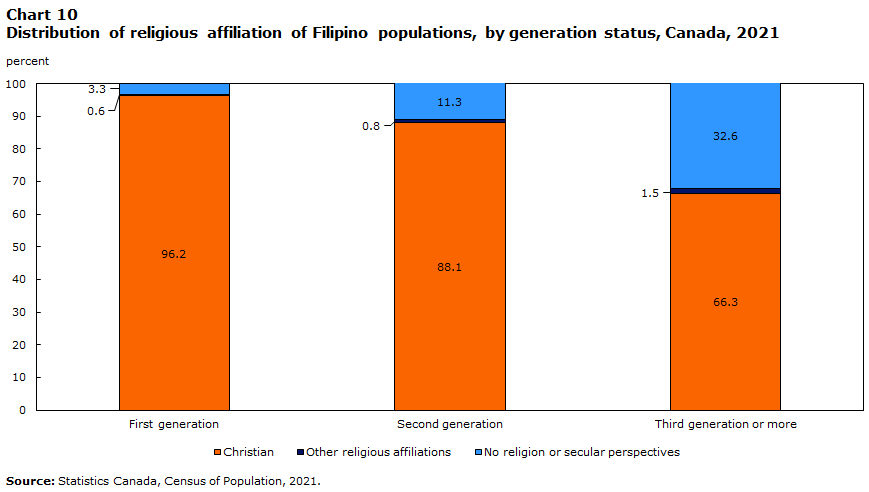
The rate of religious affiliation among the Filipino populations in Canada decreases across generations
While Catholicism remained the most significant denomination regardless of generation status, the proportion of people reporting this affiliation decreased across generations, from 74.1% in the first generation to 52.7% in the third generation or more. Meanwhile, the proportion of those who reported having no religion or having secular perspectives increased from 3.3% in the first generation to 32.6% in the third generation or more.
Data table for Chart 10
| Religious affiliation | First generation | Second generation | Third generation or more |
|---|---|---|---|
| percent | |||
| Source: Statistics Canada, Census of Population, 2021. | |||
| Christian | 96.2 | 88.1 | 66.3 |
| Other religious affiliations | 0.6 | 0.8 | 1.5 |
| No religion or secular perspectives | 3.3 | 11.3 | 32.6 |
Section 3: Education and economic outcomes
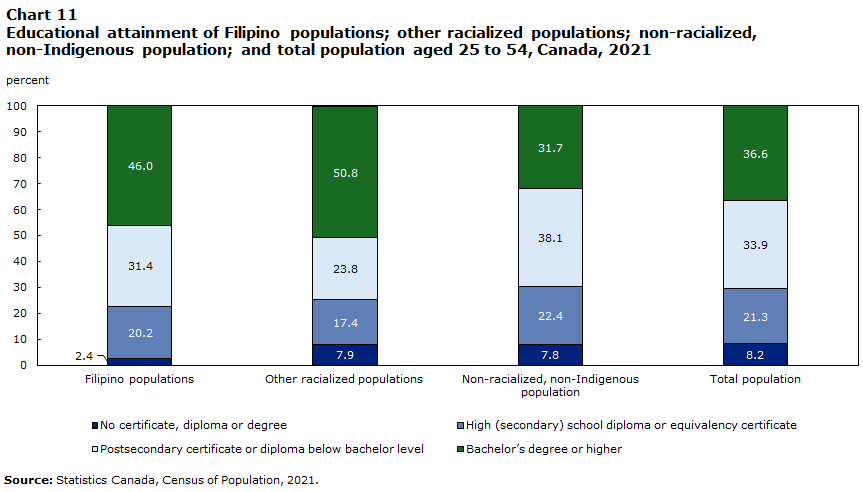
Filipino populations have greater proportions of individuals with a bachelor’s degree or higher than the non-racialized, non-Indigenous population
Nearly half (46.0%) of Filipinos aged 25 to 54 held a bachelor’s degree or higher, a greater share than the 31.7% observed among the non-racialized, non-Indigenous population. At the same time, Filipinos were among the least likely to have no formal education credentials. Among Filipinos, 2.4% had no certificate, diploma or degree, compared with 7.8% of the non-racialized, non-Indigenous population. Similarly, a smaller share of Filipinos had only a high school diploma (20.2%), compared with the non-racialized, non-Indigenous population (22.4%).
A notable share of Filipinos (31.4%) held a postsecondary certificate or diploma below the bachelor level, a rate lower than that of the non-racialized, non-Indigenous population (38.1%) but higher than that of other racialized groups (23.8%). This distribution reflects a pattern of educational attainment among Filipinos characterized by a concentration at the bachelor level. At the same time, Filipinos were more likely than other racialized groups to pursue college or trade pathways below the bachelor level, while the share with an education above the bachelor level remained comparatively lower.
Filipinos have the highest share with a post-secondary credential obtained outside Canada among racialized populations and non-racialized, non-Indigenous population
A defining characteristic of the Filipino populations’ educational profile is where credentials were obtained. Among core-aged Filipinos (25 to 54 years) with a bachelor’s degree or higher, 79.9% were internationally educated, compared with 31.3% of the total population and 14.7% of the non-racialized, non-Indigenous population. Even among those with a postsecondary certificate or diploma below the bachelor level, 43.7% of Filipinos obtained their credential abroad, compared with 9.6% of the total population and 4.0% of the non-racialized, non-Indigenous population.
Degrees in medicine, dentistry, veterinary medicine or optometry show the highest rate of international credential acquisition among Filipinos: 89.5% earned these degrees outside Canada, compared with 44.5% of the total population and 22.9% of the non-racialized, non-Indigenous population. This trend underscores the significant presence of internationally educated individuals.
Data table for Chart 11
| Educational attainment | Filipino populations | Other racialized populations | Non-racialized, non-Indigenous population | Total population |
|---|---|---|---|---|
| percent | ||||
| Source: Statistics Canada, Census of Population, 2021. | ||||
| No certificate, diploma or degree | 2.4 | 7.9 | 7.8 | 8.2 |
| High (secondary) school diploma or equivalency certificate | 20.2 | 17.4 | 22.4 | 21.3 |
| Postsecondary certificate or diploma below bachelor level | 31.4 | 23.8 | 38.1 | 33.9 |
| Bachelor’s degree or higher | 46.0 | 50.8 | 31.7 | 36.6 |
Filipinos are less likely to hold certificates, diplomas or degrees above the bachelor level than other population groups
In 2021, 5.8% of core-aged Filipinos (25 to 54 years) had completed education above the bachelor level. This share was lower than that of the non-racialized, non-Indigenous population (10.5%) and the lowest share among other racialized population. Put differently, 40.2% of Filipinos with a university education held a bachelor’s degree as their highest certificate, diploma or degree, the largest proportion among all racialized and non-racialized groups.
Bonikowska, Handler and Frenette
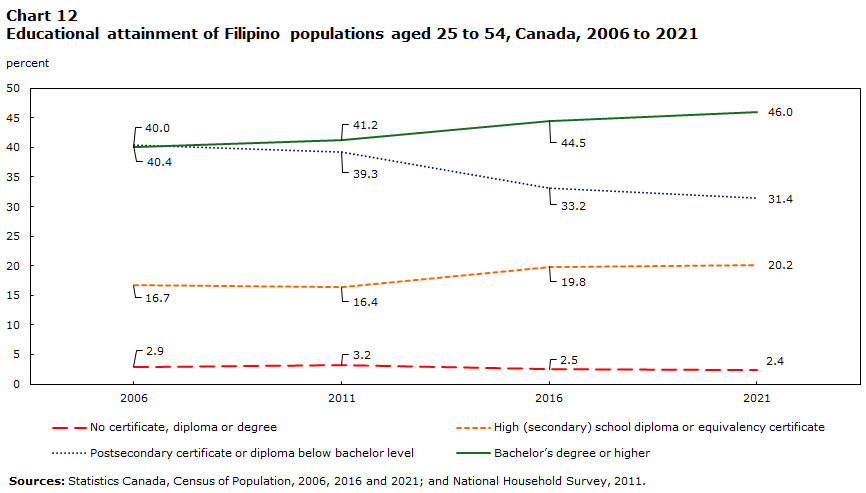
The share of Filipinos with a bachelor’s degree or higher has steadily increased from 2006 to 2021
The proportion of Filipinos aged 25 to 54 with a bachelor’s degree or higher has grown steadily over the most recent census cycles. In 2006, 40.0% of Filipinos in this age group held a bachelor’s degree or higher. By 2021, this proportion had risen to 46.0%.
At the same time, the share of Filipinos without a certificate, diploma or degree declined from 2.9% in 2006 to 2.4% in 2021. The proportion of Filipinos with a postsecondary certificate or diploma below the bachelor level also decreased—from 40.4% in 2006 to 31.4% in 2021.
Data table for Chart 12
| Educational attainment | 2006 | 2011 | 2016 | 2021 |
|---|---|---|---|---|
| percent | ||||
| Sources: Statistics Canada, Census of Population, 2006, 2016 and 2021; and National Household Survey, 2011. | ||||
| No certificate, diploma or degree | 2.9 | 3.2 | 2.5 | 2.4 |
| High (secondary) school diploma or equivalency certificate | 16.7 | 16.4 | 19.8 | 20.2 |
| Postsecondary certificate or diploma below bachelor level | 40.4 | 39.3 | 33.2 | 31.4 |
| Bachelor’s degree or higher | 40.0 | 41.2 | 44.5 | 46.0 |
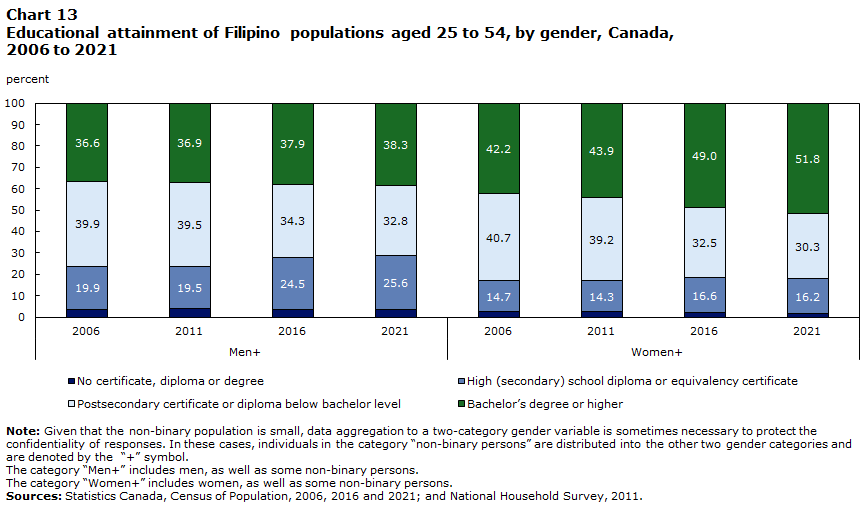
From 2006 to 2021, Filipino women are more likely than Filipino men to have a higher-level certificate, diploma or degree as their highest educational attainment
Core-aged Filipino women have consistently outpaced Filipino men in higher education. In 2021, 51.8% of Filipino women aged 25 to 54 held a bachelor’s degree or higher, compared with 38.3% of Filipino men. This gender gap has widened over time. In 2006, the share of women with a bachelor’s degree or higher was 42.2%, while it was 36.6% for men. By 2021, the gap had increased to 13.5 percentage point.
In 2021, the gender disparity was also reflected in lower levels of education. A greater share of Filipino men (32.8%) than women (30.3%) had a postsecondary certificate or diploma below the bachelor level, while men were also more likely to have only a high school diploma (25.6% of men; 16.2% of women).
Data table for Chart 13
| Educational attainment | Men+ | Women+ | ||||||
|---|---|---|---|---|---|---|---|---|
| 2006 | 2011 | 2016 | 2021 | 2006 | 2011 | 2016 | 2021 | |
| percent | ||||||||
| Note: Given that the non-binary population is small, data aggregation to a two-category gender variable is sometimes necessary to protect the confidentiality of responses. In these cases, individuals in the category “non-binary persons” are distributed into the other two gender categories and are denoted by the “+” symbol. The category “Men+” includes men, as well as some non-binary persons. The category “Women+” includes women, as well as some non-binary persons. Sources: Statistics Canada, Census of Population, 2006, 2016 and 2021; and National Household Survey, 2011. |
||||||||
| No certificate, diploma or degree | 3.7 | 4.0 | 3.3 | 3.3 | 2.4 | 2.6 | 1.9 | 1.7 |
| High (secondary) school diploma or equivalency certificate | 19.9 | 19.5 | 24.5 | 25.6 | 14.7 | 14.3 | 16.6 | 16.2 |
| Postsecondary certificate or diploma below bachelor level | 39.9 | 39.5 | 34.3 | 32.8 | 40.7 | 39.2 | 32.5 | 30.3 |
| Bachelor’s degree or higher | 36.6 | 36.9 | 37.9 | 38.3 | 42.2 | 43.9 | 49.0 | 51.8 |
First-generation Filipinos tend to have higher education levels than Filipinos born in Canada
Among the Filipino populations aged 25 to 54 in Canada, educational attainment varied notably by generation status. Despite relatively high levels of educational attainment among first-generation Filipino immigrants—nearly half (47.1%) held a bachelor’s degree or higher in 2021—subsequent generations experienced a decline in this level of education, with 38.2% of the second generation and 24.5% of the third generation or more obtaining a bachelor’s degree or higher. Moreover, the proportion of individuals whose highest credential was a high school diploma increased across generations. While 20.0% of first-generation Filipinos reported high school as their highest level of education, this proportion rose to 21.3% among the second generation and 30.8% among the third generation or more.
This lower level of university attainment among the second generation is consistent with the findings of Chen and Hou (2019) on intergenerational educational mobility in Canada. According to Chen and Hou (2019), second-generation Filipino men were the only group among major racialized populations in Canada who did not experience an improvement in university completion rates compared with their immigrant parents. They were less likely than their immigrant fathers to obtain a university degree. Filipino women showed slightly better progress, but their educational gains across generations were still modest compared with those of other groups.
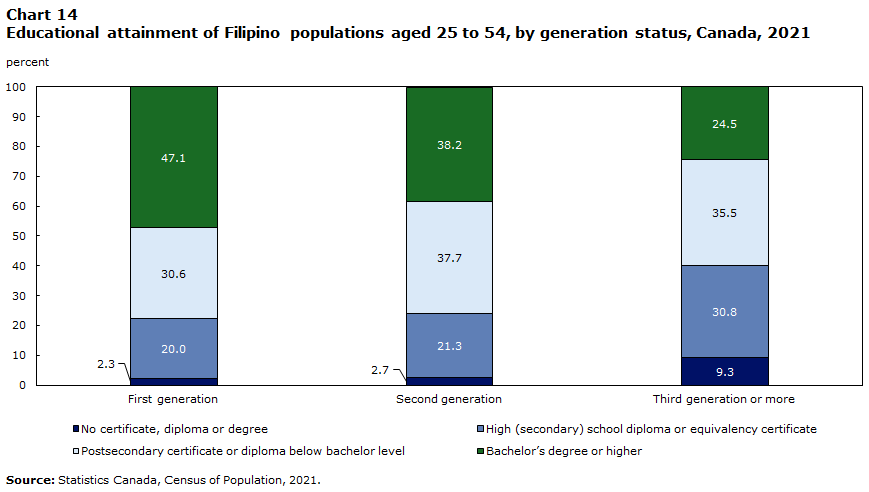
Data table for Chart 14
| Educational attainment | First generation | Second generation | Third generation or more |
|---|---|---|---|
| percent | |||
| Source: Statistics Canada, Census of Population, 2021. | |||
| No certificate, diploma or degree | 2.3 | 2.7 | 9.3 |
| High (secondary) school diploma or equivalency certificate | 20.0 | 21.3 | 30.8 |
| Postsecondary certificate or diploma below bachelor level | 30.6 | 37.7 | 35.5 |
| Bachelor’s degree or higher | 47.1 | 38.2 | 24.5 |
Filipino women of all generations have higher educational attainment than men
Across all generations, Filipino women aged 25 to 54 were more likely than men to hold a bachelor’s degree or higher. Among the first generation, 52.4% of women held a university degree, compared with 39.7% of men. The gender gap was most pronounced among the second generation, where 47.1% of women held a university degree, compared with 29.9% of men. This disparity persisted into the third generation or more, with 27.7% of women obtaining a bachelor’s degree or higher, compared with 21.1% of men.
Additionally, women were more likely than men to hold a postsecondary certificate or diploma below the bachelor level in both the second generation and the third generation or more. In contrast, men were consistently more likely to have no certificate, diploma or degree, a pattern that intensified across generations. Among first-generation Filipinos, 3.3% of men lacked formal educational credentials, compared with 1.7% of women. By the third generation or more, this gap had widened, with 11.3% of men and 7.8% of women not having any certificate or diploma. Educational attainment likewise varied among first-generation Filipino immigrants by period of immigration and admission category. The next section compares established and recent immigrants across family-sponsored and selected economic categories.
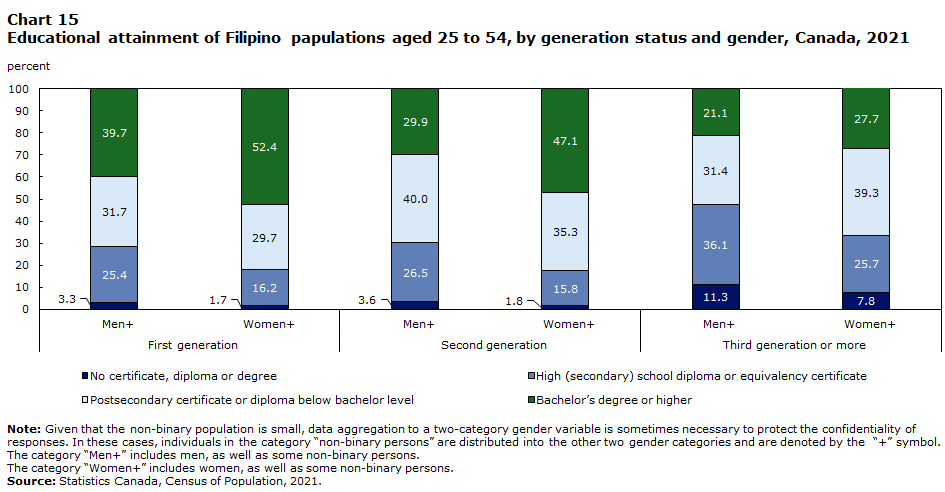
Data table for Chart 15
| Educational attainment | First generation | Second generation | Third generation or more | |||
|---|---|---|---|---|---|---|
| Men+ | Women+ | Men+ | Women+ | Men+ | Women+ | |
| percent | ||||||
| Note: Given that the non-binary population is small, data aggregation to a two-category gender variable is sometimes necessary to protect the confidentiality of responses. In these cases, individuals in the category “non-binary persons” are distributed into the other two gender categories and are denoted by the “+” symbol. The category “Men+” includes men, as well as some non-binary persons. The category “Women+” includes women, as well as some non-binary persons. Source : Statistics Canada, Census of Population, 2021. |
||||||
| No certificate, diploma or degree | 3.3 | 1.7 | 3.6 | 1.8 | 11.3 | 7.8 |
| High (secondary) school diploma or equivalency certificate | 25.4 | 16.2 | 26.5 | 15.8 | 36.1 | 25.7 |
| Postsecondary certificate or diploma below bachelor level | 31.7 | 29.7 | 40.0 | 35.3 | 31.4 | 39.3 |
| Bachelor’s degree or higher | 39.7 | 52.4 | 29.9 | 47.1 | 21.1 | 27.7 |
Recent Filipino economic immigrantsNote are more likely than established immigrants to hold a bachelor’s degree or higher
Educational attainment among first-generation Filipino immigrants varied by period of immigration, admission category and gender. Among established economic immigrants admitted before 2011, 52.5% of women and 40.3% of men aged 25 to 54 reported a bachelor’s degree or higher, and about one-third reported a postsecondary certificate or diploma below the bachelor level (32.9% of women; 34.8% of men). High school was the highest level of education for 21.8% of men and 13.2% of women, while a small proportion reported no certificate, diploma or degree (3.1% of men; 1.4% of women).
Established immigrants admitted through family sponsorship had lower levels of educational attainment: 35.5% of women and 23.5% of men reported a bachelor’s degree or higher, and similar proportions held a postsecondary certificate or diploma below the bachelor level (37.0% of men; 38.1% of women). Men sponsored by family were more likely than women to have only a high-school diploma (33.2% of men; 22.9% of women) or no credential (6.3% of men; 3.5% of women).
In contrast, recent immigrants admitted from 2011 to 2021 reported higher levels of university educational attainment across both admission categories. Among recent economic immigrants, 57.7% of women and 44.2% of men held a bachelor’s degree or higher, the highest shares observed among the broader economic immigrant groups. Approximately 27% reported a postsecondary certificate or diploma below the bachelor level, and relatively few had at most a high-school diploma (about 14.9% of women and 25.5% of men).
Recent immigrants admitted through family sponsorship also had relatively high educational attainment: 49.2% of women and 42.8% of men held a bachelor’s degree or higher. Their educational profile was more evenly distributed, with similar proportions reporting a postsecondary credential below the bachelor level or high school as their highest level.
In summary, recent Filipino immigrants had higher educational attainment, particularly those in the economic immigrant category. Across both established and recent cohorts, Filipino immigrant women were more likely than men to hold a bachelor’s degree or higher, while men were more likely to report only a high-school diploma or no credential. The next section compares the educational attainment of established and recent immigrants by gender for selected economic streams.
Among Filipino immigrants, women are more likely than men to hold a bachelor’s degree or higher across economic immigration streams, with the highest levels among recent skilled workers and the lowest among caregivers
Differences in educational attainment among Filipino immigrants also varied across specific economic immigration streams. Among established skilled workers admitted before 2011, 62.2% of women and 49.1% of men reported a bachelor’s degree or higher. Among caregivers, 44.0% of women and 23.7% of men reported a bachelor’s degree or higher, while roughly two-fifths in both groups held a postsecondary certificate or diploma below the bachelor level.
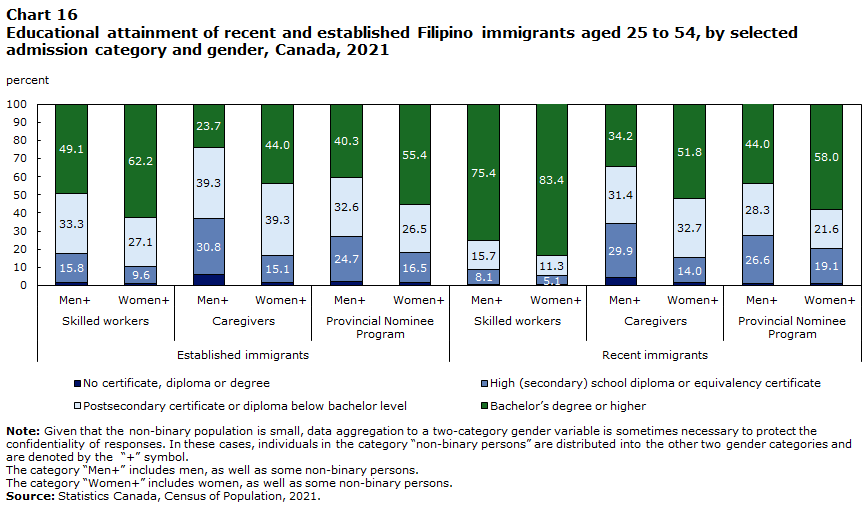
Data table for Chart 16
| Educational attainment | Established immigrants | Recent immigrants | ||||||||||
|---|---|---|---|---|---|---|---|---|---|---|---|---|
| Skilled workers | Caregivers | Provincial Nominee Program | Skilled workers | Caregivers | Provincial Nominee Program | |||||||
| Men+ | Women+ | Men+ | Women+ | Men+ | Women+ | Men+ | Women+ | Men+ | Women+ | Men+ | Women+ | |
| percent | ||||||||||||
| Note: Given that the non-binary population is small, data aggregation to a two-category gender variable is sometimes necessary to protect the confidentiality of responses. In these cases, individuals in the category “non-binary persons” are distributed into the other two gender categories and are denoted by the “+” symbol. The category “Men+” includes men, as well as some non-binary persons. The category “Women+” includes women, as well as some non-binary persons. Source: Statistics Canada, Census of Population, 2021. |
||||||||||||
| No certificate, diploma or degree | 1.8 | 1.0 | 6.1 | 1.6 | 2.3 | 1.5 | 0.8 | 0.3 | 4.4 | 1.4 | 1.2 | 1.3 |
| High (secondary) school diploma or equivalency certificate | 15.8 | 9.6 | 30.8 | 15.1 | 24.7 | 16.5 | 8.1 | 5.1 | 29.9 | 14.0 | 26.6 | 19.1 |
| Postsecondary certificate or diploma below bachelor level | 33.3 | 27.1 | 39.3 | 39.3 | 32.6 | 26.5 | 15.7 | 11.3 | 31.4 | 32.7 | 28.3 | 21.6 |
| Bachelor’s degree or higher | 49.1 | 62.2 | 23.7 | 44.0 | 40.3 | 55.4 | 75.4 | 83.4 | 34.2 | 51.8 | 44.0 | 58.0 |
Among recent immigrants, the differences across streams were more pronounced. Recent skilled workers had the highest levels of university educational attainment across all groups: 83.4% of women and 75.4% of men held a bachelor’s degree or higher. Very small proportions reported having no credential (0.3% of women; 0.8% of men).
Recent immigrants admitted through caregiver streams were less likely to have completed a bachelor’s degree: 51.8% of women and 34.2% of men held a bachelor’s degree or higher. Relatively larger proportions reported a postsecondary certificate or diploma below the bachelor level. Caregiver streams also had higher proportions of individuals with no certificate, diploma or degree (4.4% of men; 1.4% of women), compared with those admitted through skilled worker programs and the PNP.
Taken together, Filipino immigrant women consistently reported higher levels of university attainment than men across admission categories and periods of immigration. The highest levels were recorded among recent immigrants admitted through skilled worker programs, while the lowest levels were found among caregivers, who tended to have a postsecondary education below the bachelor level. Despite high levels of educational attainment, many Filipino immigrants experience occupational mismatch or downward mobility, a trend known as “deskilling” (Wall & Kow, 2023; Frank et al., 2023). The next section looks more closely at the high rates of overqualification within Filipino populations.
Nearly half of core working-age Filipinos with a bachelor’s degree or higher experience overqualification in the job market, more than four times the rate of the non-racialized, non-Indigenous population
OverqualificationNote is a key labour market indicator that refers to individuals holding a bachelor’s degree or higher while working in occupations that typically require no more than a high school diploma. This mismatch reflects labour market barriers that limit people’s access to employment opportunities aligned with their education. According to the 2021 Census, 49.5% of core working-age individuals (25 to 54 years) in the Filipino populations were overqualified, more than four times the rate among the non-racialized, non-Indigenous population (11.9%), and significantly above the national average of 18.2%. Gender-based results show that overqualification affected 50.8% of Filipino women and 47.1% of Filipino men. In contrast, the rates were 11.4% for non-racialized, non-Indigenous women and 12.7% for men.
Location of study is also closely linked to overqualification. Among Filipino degree holders educated outside Canada, 57.4% were overqualified, compared with 16.4% among those educated in Canada. Even with Canadian credentials, the rate remained higher than that among non-racialized, non-Indigenous graduates (11.1%). For those educated in the Philippines, overqualification reached 59.6% among Filipino women and 55.1% among Filipino men. Immigrant status compounds these patterns. Among first-generation immigrants in the Filipino populations, the rate stood at 52.8%, compared with 15.3% in the second generation (at least one parent born abroad) and 15.0% in the or more (both parents born in Canada). NPRs had the highest level of overqualification, with a rate of 60.4%. Among immigrants who completed their studies outside Canada, overqualification affected 58.5% of Filipino women and 55.1% of men.
| Overqualification rate | ||||
|---|---|---|---|---|
| Non-immigrants | Immigrants | |||
| Filipino populations | Non-racialized, non-Indigenous population | Filipino populations | Non-racialized, non-Indigenous population | |
| percent | ||||
| Notes: Overqualification refers to individuals with a bachelor’s degree or higher who are employed in positions that typically require a high school diploma or equivalency certificate or less. An immigrant is a person who is, or has ever been, a landed immigrant or permanent resident and has been granted the right to live in Canada permanently by immigration authorities. Immigrants who have obtained Canadian citizenship by naturalization are included in this group. Non‑immigrants include persons who are Canadian citizens by birth. Because the non-binary population is small, data are sometimes aggregated to a two-category gender variable to protect the confidentiality of responses. In these cases, individuals in the category “non-binary persons” are distributed into the other two gender categories and are denoted by the “+” symbol. The category “Men+” includes men and some non-binary individuals, while the category “Women+” includes women and some non-binary individuals. Source: Statistics Canada, Census of Population, 2021. |
||||
| Location of study within Canada | ||||
| Men+ | 18.2 | 12.3 | 18.3 | 10.4 |
| Women+ | 12.9 | 10.4 | 16.6 | 10.9 |
| Location of study outside Canada | ||||
| Men+ | 26.7 | 10.5 | 55.1 | 16.8 |
| Women+ | 20.0 | 8.9 | 58.5 | 21.1 |
Disaggregating overqualification rates by location of study and immigrant status highlights that Filipino populations consistently had higher overqualification rates than the non-racialized, non-Indigenous population for both men and women, with the largest disparities among those who completed their studies outside Canada (Table 4). In 2021, among immigrants educated outside Canada, the majority of Filipino men (55.8%) and women (59.4%) were overqualified—more than double the corresponding shares among non-racialized, non-Indigenous immigrants (21.5% for men and 25.5% for women). Marked gaps were also observed among non-immigrants who studied outside Canada. Nearly 4 in 10 Filipino men (38.2%) and women (39.5%) were overqualified, compared with about 1 in 5 among the non-racialized, non-Indigenous population (19.3% for men and 19.1% for women). Although overqualification rates were lower among those who completed their degree in Canada, disparities persisted. Filipino men and women continued to experience higher overqualification than their non-racialized, non-Indigenous counterparts among immigrants and non-immigrants.
Recent immigrant women educated in the Philippines have a higher overqualification rate than established immigrants
Whitin Filipino immigrant populations, recent immigrants, those admitted to Canada in the 10 years before the 2021 Census, experienced substantially higher overqualification rates than established immigrants admitted more than 10 years before the census. Overqualification affected 59.4% of recent immigrant men and 62.2% of recent immigrant women, while among established immigrants, the rates were lower, at 38.2% for men and 41.5% for women. Across both recent and established immigrants, Filipino women experienced higher rates of overqualification than Filipino men. Among recent immigrants with a bachelor’s degree, overqualification reached 60.1% for Filipino men and 63.4% for Filipino women, compared with 53.8% and 52.3%, respectively, among those with a university certificate, diploma or degree above the bachelor level. Established immigrants had a similar pattern: 39.7% of men and 42.6% of women with a bachelor’s degree were overqualified, compared with 28.7% of men and 34.7% of women with an education above the bachelor level.
Location of study further widened these gaps. Among recent immigrants who obtained their bachelor’s degree or higher in Canada, overqualification affected 27.9% of Filipino men and 30.1% of Filipino women. By comparison, rates were more than twice as high for those whose highest credential was earned in the Philippines—60.4% for men and 63.5% for women. Among recent immigrants, Filipino women were more likely than Filipino men to be overqualified, irrespective of their location of study. Among established Filipino immigrants, the location of study continued to be strongly associated with overqualification. Those who completed their highest credential in the Philippines had substantially higher rates—46.7% for men and 50.7% for women—roughly three times those of individuals educated in Canada (17.2% for men; 14.2% for women). These patterns are consistent with broader evidence showing that limited recognition of foreign credentials contributes to higher overqualification among immigrants (Houle & Yssaad, 2010; Wall & Kow, 2023). Overall, overqualification is most strongly linked to being a recent immigrant or to holding a credential earned in the Philippines, with women being more overqualified, though not always.
Filipino immigrants sponsored by family experience higher overqualification than economic immigrants
When admission category is considered, a clear pattern emerges. Among recent immigrants educated in the Philippines, overqualification remained very high across major admission categories. Overqualification rates among economic immigrants (59.0% for men; 64.0% for women) and among those sponsored by family (66.1% for men; 60.4% for women) were roughly two to three times higher than the levels observed for their counterparts educated in Canada. Among established immigrants with credentials earned in the Philippines, overqualification also remained elevated, at 44.0% for men and 51.6% for women among economic immigrants, and 55.0% for men and 47.0% for women among those sponsored by family, more than double the rates of those educated in Canada. In contrast, when the highest credential was obtained in Canada, overqualification remained comparatively low for established and recent immigrants. For established immigrants, overqualification was 16.8% for men and 14.0% for women among economic immigrants, and 21.2% for men and 16.4% for women among those sponsored by family. For recent immigrants, the rates rose to 27.7% for men and 32.4% for women among economic immigrants, and 31.3% for men and 20.6% for women among those sponsored by family.
Those admitted through caregiver streams record the highest overqualification rates in 2021, reaching over 70% among recent immigrants educated in the Philippines
Among economic immigrants, those admitted through caregiver streams consistently showed the highest overqualification rates. Among recent immigrants educated in the Philippines, caregiver overqualification reached 74.3% for women and 70.3% for men, roughly three times the levels observed among recent skilled workers educated in Canada. Overqualification rates were next highest among provincial nominees (60.0% for women; 58.5% for men) and skilled workers (41.9% for women; 44.7% for men). For established immigrants educated in the Philippines, caregiver overqualification also remained elevated, at 62.7% for women and 59.8% for men, compared with 55.3% for women and 51.1% for men among provincial nominees, and 34.4% for women and 35.4% for men among skilled workers. Even among recent immigrants educated in Canada, those admitted through caregiver streams continued to exhibit higher overqualification rates (43.6% for women; 29.4% for men) than provincial nominees (32.6% for women; 35.3% for men) and skilled workers (14.3% for women; 22.0% for men). Overall, the highest overqualification rates were recorded among caregivers, particularly recent immigrants educated in the Philippines. Although overqualification reveals clear inequities in occupation level and education alignment, the overall labour-market profile of core-aged Filipinos remains shaped by high participation and employment rates, as explored in the following section.
| Location of study and Admission category | Overqualification rate | |||
|---|---|---|---|---|
| Recent immigrants | Established immigrants | |||
| Men+ | Women+ | Men+ | Women+ | |
| percent | ||||
| Notes: Overqualification refers to individuals with a bachelor’s degree or higher who are employed in positions that typically require a high school diploma or equivalency certificate or less. Recent immigrants are individuals who obtained landed immigrant or permanent resident status in the 10 years preceding a census. For the 2021 Census of Population, this refers to the period from January 1, 2011, to May 11, 2021. Established immigrants are those who first obtained landed immigrant or permanent resident status more than 10 years before the census (i.e., before 2011). Because the non-binary population is small, data are sometimes aggregated to a two-category gender variable to protect the confidentiality of responses. In these cases, individuals in the category “non-binary persons” are distributed into the other two gender categories and are denoted by the “+” symbol. The category “Men+” includes men and some non-binary individuals, while the category “Women+” includes women and some non-binary individuals. Source: Statistics Canada, Census of Population, 2021. |
||||
| Location of study within Canada | ||||
| Economic immigrants | 27.7 | 32.4 | 16.8 | 14.0 |
| Skilled workers | 22.0 | 14.3 | 14.8 | 12.7 |
| Caregivers | 29.4 | 43.6 | 26.9 | 19.5 |
| Provincial Nominee Program | 35.3 | 32.6 | 27.0 | 14.4 |
| Immigrants sponsored by family | 31.3 | 20.6 | 21.2 | 16.4 |
| Location of study within the Philippines | ||||
| Economic immigrants | 59.0 | 64.0 | 44.0 | 51.6 |
| Skilled workers | 44.7 | 41.9 | 35.4 | 34.4 |
| Caregivers | 70.3 | 74.3 | 59.8 | 62.7 |
| Provincial Nominee Program | 58.5 | 60.0 | 51.1 | 55.3 |
| Immigrants sponsored by family | 66.1 | 60.4 | 55.0 | 47.0 |
Filipino populations aged 25 to 54 have higher labour market participation and employment rates and lower unemployment rates than other populations
Based on the Labour Force Survey of February 2026, among the core working-age population (25 to 54 years), the labour force participation rate of Filipinos reached 93.4%, the highest across all racialized groups. This rate surpasses that of the total population (88.4%); the racialized population (86.9%); and the non-racialized, non-Indigenous population (88.7%).
Among the working-age population, Filipinos also had the highest employment rate, at 89.6%, above the rates for the total population (82.8%); the racialized population (80.2%); and the non-racialized, non-Indigenous population (84.4%). In addition, the unemployment rate for core-aged Filipinos was among the lowest, at 4.0%, compared with 5.9% for the total population; 7.7% for the racialized population; and 4.8% for the non-racialized, non-Indigenous population.
Based on the 2021 Census, core-aged Filipinos had high levels of labour market engagement, with a participation rate of 90.4%, exceeding that of other racialized groups (82.5%) and the non-racialized, non-Indigenous population (87.5%). The employment rate for the Filipino populations was also higher, at 84.3%, compared with 73.7% for other racialized groups and 81.3% for the non-racialized, non-Indigenous population.
According to the 2021 Census, the core working-age unemployment rate for Filipinos was 6.8%, compared with 10.7% for other racialized groups; 7.2% for the non-racialized, non-Indigenous population; and 8.3% for the total population.
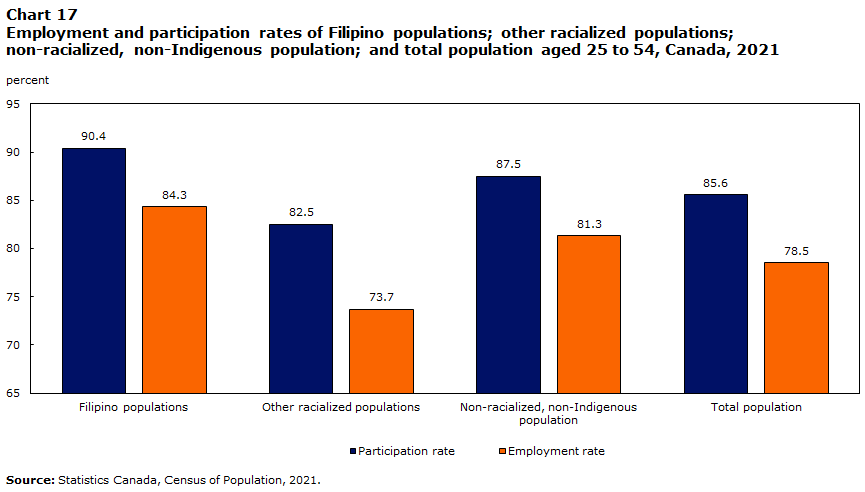
Data table for Chart 17
| Filipino populations | Other racialized populations | Non-racialized, non-Indigenous population | Total population | |
|---|---|---|---|---|
| percent | ||||
| Source: Statistics Canada, Census of Population, 2021. | ||||
| Participation rate | 90.4 | 82.5 | 87.5 | 85.6 |
| Employment rate | 84.3 | 73.7 | 81.3 | 78.5 |
Gender-based differences in labour market participation for core-aged Filipino populations show stability over time, while unemployment rates increase for men and women from 2016 to 2021
Labour market participation and employment rates varied by gender within the core-aged Filipino populations from 2016 to 2021. Among Filipino men aged 25 to 54, the participation rate decreased from 93.6% in 2016 to 93.1% in 2021, and the employment rate decreased from 89.6% to 87.2% over the same period. Among core-aged Filipino women, the participation rate decreased from 89.4% in 2016 to 88.5% in 2021, and the employment rate decreased from 85.8% to 82.2%.
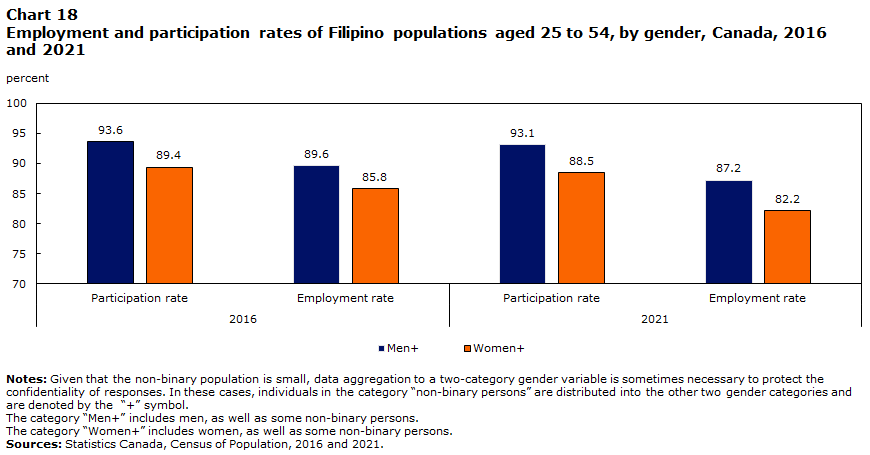
Data table for Chart 18
| Gender | 2016 | 2021 | ||
|---|---|---|---|---|
| Participation rate | Employment rate | Participation rate | Employment rate | |
| percent | ||||
| Note: Given that the non-binary population is small, data aggregation to a two-category gender variable is sometimes necessary to protect the confidentiality of responses. In these cases, individuals in the category “non-binary persons” are distributed into the other two gender categories and are denoted by the “+” symbol. The category “Men+” includes men, as well as some non-binary persons. The category “Women+” includes women, as well as some non-binary persons. Sources: Statistics Canada, Census of Population, 2016 and 2021. |
||||
| Men+ | 93.6 | 89.6 | 93.1 | 87.2 |
| Women+ | 89.4 | 85.8 | 88.5 | 82.2 |
From 2016 to 2021, unemployment rose across all generation groups within the core-aged Filipino populations. These increases align with broader labour-market disruptions associated with the COVID-19 pandemic, and this trend was also observed among the non-racialized, non-Indigenous population.
Among first-generation Filipinos, unemployment rose from 4.1% to 6.0% for men and from 4.0% to 7.0% for women. Although both groups saw increases, the gap was more important for women. Among second-generation Filipinos, unemployment increased from 5.2% to 9.0% among men and from 4.9% to 7.8% among women. Among Filipinos in the third generation or more, unemployment climbed from 7.0% to 10.2% for men, while women saw a decline from 9.3% to 7.8%, narrowing the gender gap.
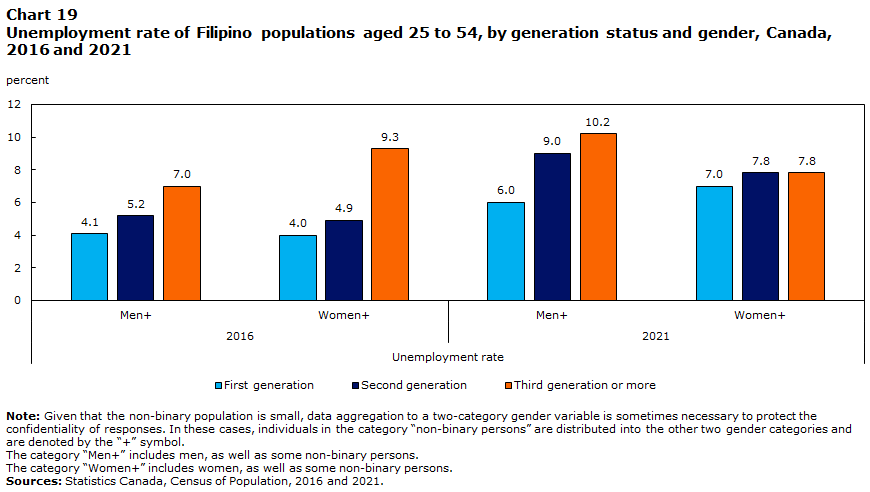
Data table for Chart 19
| Generation status | Unemployment rate | |||
|---|---|---|---|---|
| 2016 | 2021 | |||
| Men+ | Women+ | Men+ | Women+ | |
| percent | ||||
| Note: Given that the non-binary population is small, data aggregation to a two-category gender variable is sometimes necessary to protect the confidentiality of responses. In these cases, individuals in the category “non-binary persons” are distributed into the other two gender categories and are denoted by the “+” symbol. The category “Men+” includes men, as well as some non-binary persons. The category “Women+” includes women, as well as some non-binary persons. Sources: Statistics Canada, Census of Population, 2016 and 2021. |
||||
| First generation | 4.1 | 4.0 | 6.0 | 7.0 |
| Second generation | 5.2 | 4.9 | 9.0 | 7.8 |
| Third generation or more | 7.0 | 9.3 | 10.2 | 7.8 |
In both census years, first-generation Filipinos had lower unemployment rates than those in the second generation and third generation or more. As noted earlier in the portrait, the first generation is the most highly educated and exhibits the highest rates of overqualification, compared with the second generation and third generation or more. This means that the majority of first-generation Filipinos remain employed in positions below their qualification level rather than outside the labour market altogether.
Higher educational attainment within the Filipino populations is associated with stronger labour market outcomes
Filipinos in the core working-age group (25 to 54 years) had high participation and employment rates, with both increasing alongside levels of education. These labour market outcomes reflect the high educational attainment observed among Filipinos earlier in the portrait. As of 2021, the employment rate of core-aged Filipinos with a bachelor’s degree or higher was 87.0%, compared with 79.7% among those with a high school diploma and 70.2% among those without a certificate, diploma or degree. Among Filipinos with a bachelor’s degree or higher, women (85.0%) were less likely to be employed than men (90.6%).
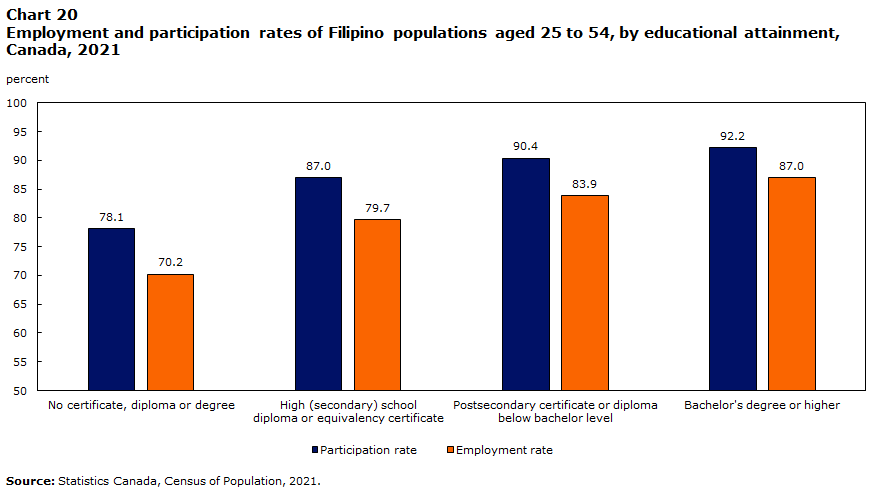
Data table for Chart 20
| No certificate, diploma or degree | High (secondary) school diploma or equivalency certificate |
Postsecondary certificate or diploma below bachelor level | Bachelor's degree or higher | |
|---|---|---|---|---|
| percent | ||||
| Source: Statistics Canada, Census of Population, 2021. | ||||
| Participation rate | 78.1 | 87.0 | 90.4 | 92.2 |
| Employment rate | 70.2 | 79.7 | 83.9 | 87.0 |
Unemployment rates also varied by gender and educational attainment. Among core-aged Filipino men, the unemployment rate ranged from 9.9% for those without a certificate, diploma or degree to 4.9% for those with a bachelor’s degree or higher. A similar pattern was observed among core-aged Filipino women, though their unemployment rates were consistently higher. Women without a certificate, diploma or degree had an unemployment rate of 10.3%, compared with 6.1% for those with a bachelor’s degree or higher. Similar to earlier results, among those with a bachelor’s degree or higher, women (6.1%) were more likely to be unemployed than men (4.9%). While higher education improves labour market outcomes for core-aged men and women, gender differences persist in employment opportunities within the Filipino populations. The following subsections look more closely at how these outcomes differ by period of immigration, gender and admission category.
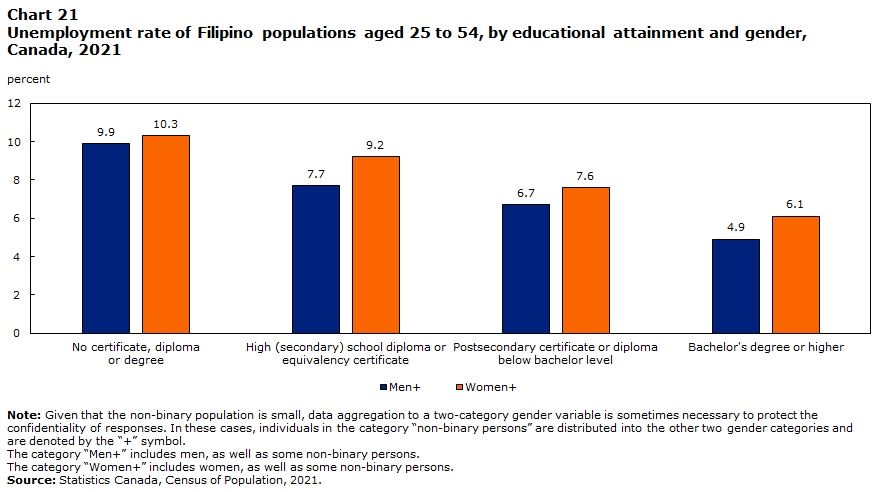
Data table for Chart 21
| Gender | Unemployment rate | |||
|---|---|---|---|---|
| No certificate, diploma or degree |
High (secondary) school diploma or equivalency certificate | Postsecondary certificate or diploma below bachelor level | Bachelor's degree or higher | |
| percent | ||||
| Note: Given that the non-binary population is small, data aggregation to a two-category gender variable is sometimes necessary to protect the confidentiality of responses. In these cases, individuals in the category “non-binary persons” are distributed into the other two gender categories and are denoted by the “+” symbol. The category “Men+” includes men, as well as some non-binary persons. The category “Women+” includes women, as well as some non-binary persons. Source: Statistics Canada, Census of Population, 2021. |
||||
| Men+ | 9.9 | 7.7 | 6.7 | 4.9 |
| Women+ | 10.3 | 9.2 | 7.6 | 6.1 |
Among Filipino immigrants aged 25 to 54 with a bachelor’s degree or higher, recent immigrants experience higher unemployment than established immigrants
Core-aged Filipinos generally had high participation and employment rates, along with comparatively low unemployment. However, the aggregated results mask important differences within the Filipino immigrant population. Among immigrants aged 25 to 54 with a bachelor’s degree or higher, unemployment rates were higher among recent immigrants (6.8% for women and 4.8% for men) than among established immigrants (5.6% for women and 4.6% for men). In both groups, women experienced higher unemployment rates than men. Despite these higher unemployment levels, recent Filipino immigrants remained strongly attached to the labour market. Among recent immigrants aged 25 to 54 with a bachelor’s degree or higher, employment rates reached 83.4% for women and 91.4% for men, though these levels were lower than those for established immigrants.
Core-aged Filipino women who immigrated recently experience the highest unemployment levels, especially those admitted under family sponsorship or through caregiver streams
Admission categories provide additional insight into labour-market patterns among core-aged Filipino immigrants. Among recent immigrants aged 25 to 54 with a bachelor’s degree or higher, family-sponsored immigrants were more likely to be unemployed (10.7% for women and 5.7% for men) than economic immigrants (6.2% for women and 4.5% for men). Filipino immigrant women with a bachelor’s degree or higher recently admitted under family sponsorship (83.0%) were also less likely to participate in the labour force than those admitted under the economic category (90.4%). For men, participation rates were 94.1% for family-sponsored immigrants and 96.4% among economic immigrants.
| Unemployment rate | ||||
|---|---|---|---|---|
| Established immigrants | Recent immigrants | |||
| Men+ | Women+ | Men+ | Women+ | |
| percent | ||||
| Notes: Recent immigrants are individuals who obtained landed immigrant or permanent resident status in the 10 years preceding a census. For the 2021 Census of Population, this refers to the period from January 1, 2011, to May 11, 2021. Established immigrants are those who first obtained landed immigrant or permanent resident status more than 10 years before the census (i.e., before 2011). Because the non-binary population is small, data are sometimes aggregated to a two-category gender variable to protect the confidentiality of responses. In these cases, individuals in the category “non-binary persons” are distributed into the other two gender categories and are denoted by the “+” symbol. The category “Men+” includes men and some non-binary individuals, while the category “Women+” includes women and some non-binary individuals. Source: Statistics Canada, Census of Population, 2021. |
||||
| Total | 4.6 | 5.6 | 4.8 | 6.8 |
| Economic immigrants | 4.7 | 5.3 | 4.5 | 6.2 |
| Skilled workers | 4.8 | 4.6 | 5.1 | 5.3 |
| Caregivers | 5.3 | 6.2 | 4.2 | 6.9 |
| Provincial Nominee Program | 4.1 | 5.3 | 4.3 | 5.7 |
| Immigrants sponsored by family | 4.2 | 6.9 | 5.7 | 10.7 |
Among established immigrants aged 25 to 54 with a bachelor’s degree or higher, unemployment levels were lower overall but followed a similar pattern. Family-sponsored immigrants were more likely to be unemployed than economic immigrants. Within the economic immigrant category, recent Filipino immigrants admitted through caregiver streams were more likely to be unemployed than those admitted as skilled workers or provincial nominees. Across admission categories, recent Filipino immigrant women were the most likely to experience unemployment. The following section examines another dimension of labour-market conditions among core-aged Filipinos by focusing on the class of workers, including paid employment and self-employment.
Filipino populations have a higher proportion of employees and lower self-employment rates than other populations
Filipino populations in Canada are predominantly composed of employees rather than self-employed individuals. In 2021, 94.6% of core-aged Filipino workers were employees, a significantly higher proportion compared with other racialized populations (84.5%) and the non-racialized, non-Indigenous population (86.6%). The share of self-employed core-aged Filipinos was 5.4%, lower than among other racialized populations (15.5%) and the non-racialized, non-Indigenous population (13.4%).
When disaggregated by gender, Filipino men and women have similar overall employment and self-employment rates. Among Filipinos aged 25 to 64, 5.7% of men and 5.7% of women were self-employed. These figures contrast with broader labour market trends in Canada, where self-employment rates were typically higher among men. Filipinos are the only major racialized group with no gender gap in self-employment rates. However, the absence of a gender gap in the rate does not equate to equal outcomes, as Filipino women disproportionately occupy lower-skilled, less stable forms of self-employment even when highly educated (Uppal, 2023), a point that is developed further in the next section.
A higher proportion of self-employed Filipino men are in professional and managerial roles, while a larger share of women work in semi-skilled, labour and entry-level occupations
Among self-employed Filipinos aged 25 to 54, 29.6% of men and 25.7% of women were in professional and management occupations: 12.3% of self-employed men and 9.3% of self-employed women were classified under training, education, experience and responsibilities
A larger share of self-employed Filipino women were classified under TEER 4 (semi-skilled occupations) and TEER 5 (labour and entry-level occupations); 32.8% of self-employed women were in these lower TEER occupations, compared with 25.3% of men. This gap is consistent across education levels. Among those with a bachelor’s degree or higher, 46.0% of self-employed men were in professional and managerial roles, compared with 33.0% of women. The largest gap was observed in TEER 1 occupations, which included 33.4% of self-employed men with a university degree, compared with 25.2% of similarly educated self-employed women.
Filipino women were more likely to be self-employed in TEER 4 and TEER 5 jobs, even with higher education levels. Among self-employed Filipinos with a bachelor’s degree or higher, 27.2% of women worked in TEER 4 and TEER 5 occupations, compared with 19.1% of men. The same trend is observed among those with lower educational attainment. Among self-employed Filipinos with only a high school diploma, 47.6% of women and 35.4% of men were in TEER 4 and TEER 5 jobs.
These patterns align with findings by Uppal (2023), who noted that Filipino women have one of the lowest self-employment rates among racialized women in Canada. Their most common self-employment occupations—Support occupations in cleaning and related services (14.4%) and Home care provider occupations (7.5%)—reflect the continuation of gendered labour roles tied to caregiving and support sectors.
Filipinos are less likely to work in professional and management occupations and more likely to work in semi-skilled, labour and entry-level occupations, compared with the non-racialized, non-Indigenous population
Among the core-aged population, Filipinos were less likely to be classified under training, education, experience and responsibilities (TEER) category 0 (management
Conversely, Filipinos were more likely to be classified under TEER 4 (semi-skilled
| Filipino populations | Non-racialized, non-Indigenous population | |||||
|---|---|---|---|---|---|---|
| Total | Men+ | Women+ | Total | Men+ | Women+ | |
| percent | ||||||
| Notes: TEER = training, education, experience and responsibilities. Management occupations (TEER 0) include occupations with management responsibilities, such as legislators, senior managers and middle managers. Professional occupations (TEER 1) require completion of a university degree (bachelor’s, master’s or doctorate) or previous experience and expertise in subject-matter knowledge from a related occupation in TEER 2 (when applicable). Semi-skilled occupations (TEER 4) usually require completion of secondary school, several weeks of on-the-job training with some secondary school education or experience in a related occupation in TEER 5 (when applicable). Labour and entry-level occupations (TEER 5) usually require a short work demonstration and have no formal educational requirements. Because the non-binary population is small, data are sometimes aggregated to a two-category gender variable to protect the confidentiality of responses. In these cases, individuals in the category “non-binary persons” are distributed into the other two gender categories and are denoted by the “+” symbol. The category “Men+” includes men and some non-binary individuals, while the category “Women+” includes women and some non-binary individuals. Source: Statistics Canada, Census of Population, 2021. |
||||||
| Professional and management occupations (TEER 0, TEER 1) | 19.1 | 17.1 | 20.6 | 36.2 | 33.4 | 39.2 |
| Semi-skilled, labour and entry-level occupations (TEER 4, TEER 5) | 41.3 | 44.4 | 39.0 | 22.9 | 22.5 | 23.2 |
Filipinos are more likely to work in health and sales and service occupations than other population groups
Sales and service occupations, as defined by the National Occupational Classification (NOC) (NOC 6), accounted for the largest share of core-aged Filipino workers (27.5%) in 2021, 2.9 percentage points higher than for other racialized populations (24.6%) and 8.7 percentage points higher than for non-racialized, non-Indigenous workers (18.8%). This sector includes retail, food services and customer support, where Filipino workers were overrepresented. Filipino women represented 4.8% of all core-aged women in sales and service occupations, and Filipino men accounted for 3.9% of core-aged men in these occupations. However, Filipinos (10.3%) were half as likely as the non-racialized, non-Indigenous population (21.1%) to be employed in management and professional sales and service occupations (TEER 0 and TEER 1). This gap persisted for men (11.0% versus 26.4%) and women (9.9% versus 17.0%). Almost two-thirds (67.3%) of Filipinos in sales and service occupations worked in semi-skilled, labour and entry-level occupations (TEER 4 and TEER 5)—70.6% of Filipino women and 62.2% of Filipino men. While sales and service jobs provide employment opportunities, they are also associated with lower wages and less job stability, compared with professional and technical occupations (Statistics Canada, 2021).
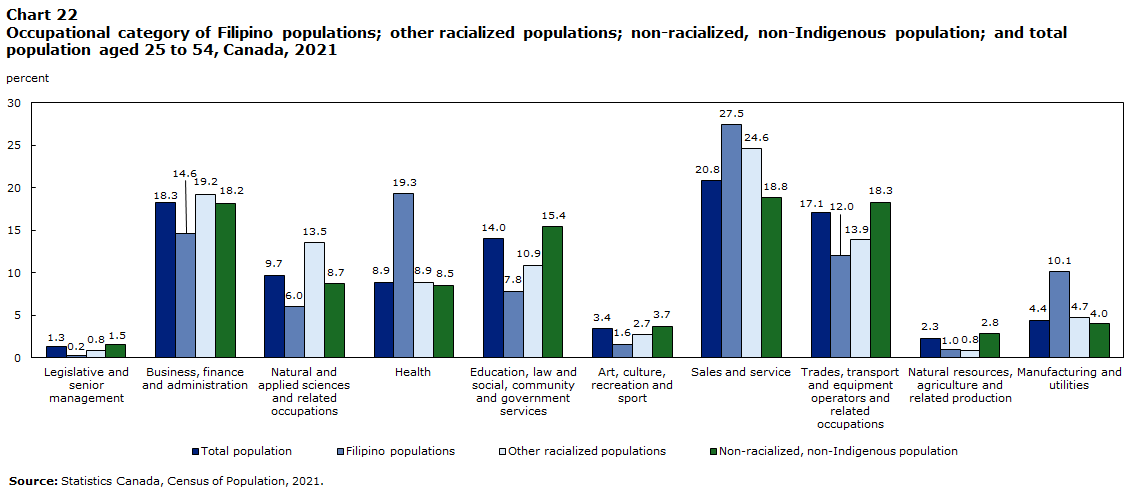
Data table for Chart 22
| Occupational category | Total population | Filipino populations | Other racialized populations | Non-racialized, non-Indigenous population |
|---|---|---|---|---|
| percent | ||||
| Source: Statistics Canada, Census of Population, 2021. | ||||
| Legislative and senior management | 1.3 | 0.2 | 0.8 | 1.5 |
| Business, finance and administration | 18.3 | 14.6 | 19.2 | 18.2 |
| Natural and applied sciences and related occupations | 9.7 | 6.0 | 13.5 | 8.7 |
| Health | 8.9 | 19.3 | 8.9 | 8.5 |
| Education, law and social, community and government services | 14.0 | 7.8 | 10.9 | 15.4 |
| Art, culture, recreation and sport | 3.4 | 1.6 | 2.7 | 3.7 |
| Sales and service | 20.8 | 27.5 | 24.6 | 18.8 |
| Trades, transport and equipment operators and related occupations | 17.1 | 12.0 | 13.9 | 18.3 |
| Natural resources, agriculture and related production | 2.3 | 1.0 | 0.8 | 2.8 |
| Manufacturing and utilities | 4.4 | 10.1 | 4.7 | 4.0 |
Among core-aged (25 to 54 years) Filipino populations in Canada, 19.3% worked in health occupations, the second most frequent occupational group for Filipinos in 2021. The share of core-aged Filipinos in health occupations was 10.8 percentage points higher than that of non-racialized, non-Indigenous workers (8.5%) and 10.4 percentage points higher than that of other racialized populations (8.9%). Filipino women represented 7.3% of core-aged women in health occupations, and Filipino men accounted for 6.9% of core-aged men. However, Filipinos (27.3%) were less likely to work in management and professional health occupations (TEER 0 and TEER 1), compared with the non-racialized, non-Indigenous population (50.8%). This gap was observed for men (31.7% versus 55.8%) and women (26.3% versus 49.8%).
Similarly, 10.1% of Filipinos worked in occupations in manufacturing and utilities, 6.1 percentage points higher than the share of non-racialized, non-Indigenous workers (4.0%) and 5.4 percentage points higher than that of other racialized populations (4.7%). Filipino women represented 8.9% of all core-aged women in these occupations, and Filipino men accounted for 7.2% of core-aged men. However, Filipinos (2.2%) were almost six times less likely to work in management and professional occupations in manufacturing and utilities (TEER 0 and TEER 1), compared with the non-racialized, non-Indigenous population (13.2%). This gap persisted for men (2.3% versus 13.2%) and women (2.0% versus 13.1%). Also, 89.4% of Filipinos in occupations in manufacturing and utilities worked in semi-skilled, labour and entry-level occupations (TEER 4 and TEER 5), compared with 64.6% for the non-racialized, non-Indigenous population. This gap persisted for men (87.9% versus 61.8%) and women (92.4% versus 74.1%).
Filipino workers (14.6%) in the core-age group were less likely to be employed in business, finance and administration occupations (NOC 1) than other racialized workers (19.2%) and non-racialized, non-Indigenous workers (18.2%), differences of 4.6 percentage points and 3.6 percentage points, respectively. Among Filipinos employed in business, finance and administration occupations in 2021, 37.3% worked in semi-skilled, labour and entry-level occupations (TEER 4 and TEER 5), compared with 22.9% for the non-racialized, non-Indigenous population. This gap was observed among men (42.4% versus 22.2%) and women (35.1% versus 23.2%).
Additionally, 12.0% of core-aged Filipinos were employed in trades, transport and equipment operators and related occupations (NOC 7), compared with 18.3% of non-racialized, non-Indigenous workers, a gap of 6.3 percentage points. While the largest share of non-racialized, non-Indigenous men (32.6%) were employed in this sector, the share was lower among Filipino men (24.7%). Their lower representation in skilled trades suggests a divergence from broader employment trends among non-racialized, non-Indigenous men, who were more likely to be employed in these fields. Among Filipinos in this sector, 39.3% worked in semi-skilled, labour and entry-level occupations (TEER 4 and TEER 5), twice the share among the non-racialized, non-Indigenous population (20.2%), with a persistent gap for men (37.0% versus 19.0%) and women (58.9% versus 32.9%).
Core-aged Filipino women are more likely to work in health assisting occupations and less likely to work in professional and specialized middle management occupations in health, compared with the non-racialized, non-Indigenous population
The occupational distribution of Filipino men and women in the core-age group differs from both that of other racialized populations and that of non-racialized, non-Indigenous workers. Filipino women (28.0%) were more likely to work in health occupations (NOC 3), compared with women in other racialized groups (13.8%) and non-racialized, non-Indigenous women (14.5%), gaps of 14.2 percentage points and 13.5 percentage points, respectively. Among all core-aged women working in health occupations, 7.3% were Filipino. In 2021, the largest population group for internationally educated health care professionals in Canada was Filipino (25.5%) (Frank et al., 2023). This trend reflects a longstanding pattern shaped by migration policies and labour market demands in Canada’s health care sector.
Among Filipino women working in health occupations, 58.5% were employed in assisting occupations in support of health services (NOC 33), compared with 24.5% for non-racialized, non-Indigenous women. Among assisting occupations in support of health services (NOC 331), the most common roles were nurse aides, orderlies and patient service associates (NOC 33102), accounting for 84.0% of all assisting occupations in support of health services. Filipino women in health occupations were less likely to work in professional occupations in health (NOC 31) (25.4%), in technical occupations in health (NOC 32) (15.2%) and in specialized middle management occupations in health care (NOC 30) (0.9%), compared with non-racialized, non-Indigenous women (47.1%, 25.7% and 2.7%, respectively).
Among Filipino men in health occupations, 45.9% worked in assisting occupations in support of health services, compared with 16.3% of non-racialized, non-Indigenous men. Filipino men in health occupations were more likely than women to work in professional occupations in health (30.5% versus 25.4%, a difference of 5.1 percentage points), but less likely to do so than non-racialized, non-Indigenous men (51.8%). They were also more likely than women to work in technical occupations in health (22.4% versus 15.2%, a difference of 7.2 percentage points). Compared with other racialized populations and the non-racialized, non-Indigenous group, Filipinos were more concentrated in assisting occupations in support of health services, while other groups had a higher share of workers in professional occupations in health. For example, physicians and veterinarians accounted for 1.5% of core-aged Filipino men and 0.5% of core-aged Filipino women working in health occupations, compared with 18.6% and 5.3%, respectively, among the non-racialized, non-Indigenous population. Filipinos were also less likely to work in specialized middle management occupations in health care (NOC 30) (1.2% of Filipino men and 0.9% of Filipino women, compared with 3.9% and 2.7%, respectively, among the non-racialized, non-Indigenous population).
Sales and service occupations is the largest occupational group for core-aged Filipinos, with roughly half of sales and service workers in support occupations
With 29.6% of Filipino women and 24.7% of Filipino men working in sales and service occupations, this was the most common occupational category for Filipino workers in the core-age group. Filipino women were more likely to work in sales and service occupations than men, with a 4.9 percentage point difference. However, roles within this sector varied by gender. Filipino women were more likely to work in customer service, personal services and cleaning-related occupations, while Filipino men were more likely to work in retail management, wholesale trade and janitorial services.
Among those employed in sales and service occupations, nearly half (50.4%) of core-aged Filipino women and 43.8% of Filipino men worked in sales and service support occupations (NOC 65). Among those in sales and service support occupations, 52.0% of core-aged Filipino women and 38.5% of Filipino men were employed in support occupations in cleaning and related services (NOC 653), a gender gap of 13.5 percentage points. The majority of Filipino women (77.2%) in this field worked as light duty cleaners, janitors or caretakers, while 47.4% of Filipino men held similar roles. Compared with other racialized populations and the non-racialized, non-Indigenous population, a higher share of Filipinos worked in cleaning and related services occupations, whereas other groups had a higher share of workers in retail sales, food services and administrative support. While core-aged Filipino men (11.0%) were more likely than core-aged Filipino women (9.9%) to be employed in middle management positions in retail and wholesale trade, higher proportions of non-racialized, non-Indigenous men (26.4%) and women (17.0%) held similar positions.
Occupational distribution among core-aged Filipino immigrants differs by period of immigration, with recent immigrants more likely to be employed in sales and service occupations and established immigrants more likely to be employed in business, finance and administration occupations, while the share employed in health occupations is similar for both groups
Among core-aged Filipino immigrants, recent immigrants were more likely than established immigrants to work in sales and service occupations (32.0% versus 23.3%) and in occupations in manufacturing and utilities (13.3% versus 8.8%). In contrast, a higher proportion of established immigrants worked in business, finance and administration occupations (17.9% versus 10.4%) and in natural and applied sciences and related occupations (7.7% versus 3.7%). The share employed in health occupations was similar across both groups, at 20.5% among established Filipino immigrants and 19.8% among recent immigrants.
Among core-aged Filipino immigrant women, a higher proportion of established immigrants (22.7%) than recent immigrants (12.8%) were employed in business, finance and administration occupations. In contrast, recent immigrant women were more likely to work in sales and service occupations (35.3% versus 25.6%). Health occupations remained important for both groups, accounting for 29.6% of established immigrant women and 28.5% of recent immigrant women.
Among core-aged Filipino immigrant men, established immigrants were more likely than recent immigrants to be employed in business, finance and administration occupations (11.8% versus 7.1%) and in natural and applied sciences and related occupations (12.9% versus 6.1%). Recent immigrants, in contrast, were more likely to work in sales and service occupations (27.5% versus 20.4%) and in occupations in manufacturing and utilities (20.5% versus 13.6%). Health occupations accounted for 8.5% of established immigrant men and 7.9% of recent immigrant men.
Established Filipino immigrants are more likely to work in professional and management occupations, while recent Filipino immigrants are more likely to work in semi-skilled, labour and entry-level occupations
Among established Filipino immigrants aged 25 to 54, 23.4% worked in professional and management occupations, compared with 11.6% of recent immigrants. Conversely, 49.3% of recent immigrants worked in TEER 4 and TEER 5 occupations, compared with 36.2% of established immigrants.
The pattern was more pronounced among Filipino men—20.5% of established immigrant men held professional and management occupations, compared with 10.3% of recent immigrant men. At the same time, 53.9% of recent immigrant men were employed in semi-skilled, labour and entry-level occupations (TEER 4 and TEER 5), compared with 39.0% of established immigrant men. Among core-aged Filipino women, established immigrants were more likely than recent immigrants to work in professional and management occupations (25.6% versus 12.6%), whereas recent immigrant women were more likely to work in semi-skilled, labour and entry-level occupations (TEER 4 and TEER 5) (46.0% versus 34.1%).
| Established immigrants | Recent immigrants | |||||
|---|---|---|---|---|---|---|
| Total | Men+ | Women+ | Total | Men+ | Women+ | |
| percent | ||||||
| Notes: TEER = training, education, experience and responsibilities. Management occupations (TEER 0) include occupations with management responsibilities, such as legislators, senior managers and middle managers. Professional occupations (TEER 1) require completion of a university degree (bachelor’s, master’s or doctorate) or previous experience and expertise in subject-matter knowledge from a related occupation in TEER 2 (when applicable). Semi-skilled occupations (TEER 4) usually require completion of secondary school, several weeks of on-the-job training with some secondary school education or experience in a related occupation in TEER 5 (when applicable). Labour and entry-level occupations (TEER 5) usually require a short work demonstration and have no formal educational requirements. Because the non-binary population is small, data are sometimes aggregated to a two-category gender variable to protect the confidentiality of responses. In these cases, individuals in the category “non-binary persons” are distributed into the other two gender categories and are denoted by the “+” symbol. The category “Men+” includes men and some non-binary individuals, while the category “Women+” includes women and some non-binary individuals. Source: Statistics Canada, Census of Population, 2021. |
||||||
| Professional and management occupations (TEER 0, TEER 1) | 23.4 | 20.5 | 25.6 | 11.6 | 10.3 | 12.6 |
| Semi-skilled, labour and entry-level occupations (TEER 4, TEER 5) | 36.2 | 39.0 | 34.1 | 49.3 | 53.9 | 46.0 |
Across major occupational groups, established Filipino immigrants were consistently more likely than recent Filipino immigrants to work in professional and management occupations and less likely to be employed in semi-skilled, labour and entry-level occupations (TEER 4 and TEER 5). In 2021, in business, finance and administration occupations (NOC 1), 28.9% of established Filipino immigrants worked in professional and management roles, compared with 18.6% of recent Filipino immigrants. A similar pattern was observed in natural and applied sciences and related occupations (NOC 2) (55.5% versus 46.4%) and in health occupations (NOC 3) (34.8% versus 16.9%). In contrast, recent Filipino immigrants were more likely to be employed in semi-skilled, labour and entry-level occupations (TEER 4 and TEER 5) than established Filipino immigrants in occupations in education, law and social, community and government services (NOC 4) (41.3% versus 20.6%). Similar differences were observed in occupations in manufacturing and utilities (NOC 9) (92.4% versus 84.9%); business, finance and administration occupations (NOC 1) (47.6% versus 35.7%); and trades, transport and equipment operators and related occupations (NOC 7) (44.3% versus 36.3%).
As Eric (2012) outlined, migration pathways have long shaped occupational outcomes for Filipino populations. Earlier cohorts who immigrated in the 1960s and 1970s were primarily professionals, especially nurses, admitted through Canada’s merit-based immigration system, which emphasized education and occupational skills. In contrast, more recent cohorts, particularly from the 1990s onward, often entered through temporary labour migration streams like the LCP. As a result, many Filipino women played caregiving and support roles in health care and domestic work, sectors that continued to dominate Filipino labour force participation. These pathways were shaped not only by Canadian immigration policy but also by enduring transnational family obligations and the global demand for Filipino care labour (Eric, 2012).
Core-aged Filipinos are underrepresented in legislative and senior management occupations
In 2021, Filipinos represented 7.2% of the core-aged population in health occupations, 7.7% of all workers in occupations in manufacturing and utilities, and 4.4% of those in sales and service occupations, well above their share in the core-aged population (3.2%). However, they were especially underrepresented in legislative and senior management occupations (0.5%).
Filipino populations remain significantly underrepresented in formal leadership roles, such as board directorships and executive positions. The study by Longpré-Verret and Richards (2021) indicates that Filipinos were among the least represented racialized groups in corporate leadership positions. Filipinos made up 0.8% of board directors and 0.9% of officers in 2016, a stark contrast to their proportion of the racialized population. A similar pattern was observed in occupational data, where Filipino populations were also less likely to hold senior management positions (0.2%) than the non-racialized, non-Indigenous population (1.5%). Patterns of occupational concentration and underrepresentation in leadership intersect with broader aspects of social inclusion. The following section explores these dimensions, focusing on sense of belonging, confidence in institutions, and engagement in civic and community activities among Filipino populations.
Section 4: Social inclusion
Filipinos are more likely than the non-racialized, non-Indigenous population to report a strong sense of belonging to Canada
Social inclusion is a process that ensures that all members of society, regardless of their ethnocultural origin, have access to the opportunities and resources they need to participate in economic, social and political life without any barriers (Statistics Canada, 2024a). A key indicator of social inclusion is a sense of belonging. This refers to how strongly individuals feel connected and attached to their local community, their town or city, their province, and Canada. In this regard, Filipino populations in Canada reported a stronger sense of belonging to Canada than the non-racialized, non-Indigenous population. In 2020, 92.0% of Filipinos had a strong sense of belonging to Canada, compared with 84.7% among the non-racialized, non-Indigenous population (Chart 23). This trend was consistent across all geographic levels, with 89.9% of Filipinos expressing a strong sense of belonging to their province, compared with 80.0% of the non-racialized, non-Indigenous population. Similarly, Filipinos were more likely to report a strong sense of belonging to their town or city (89.4% versus 75.0%) and their local community (87.7% versus 70.7%).
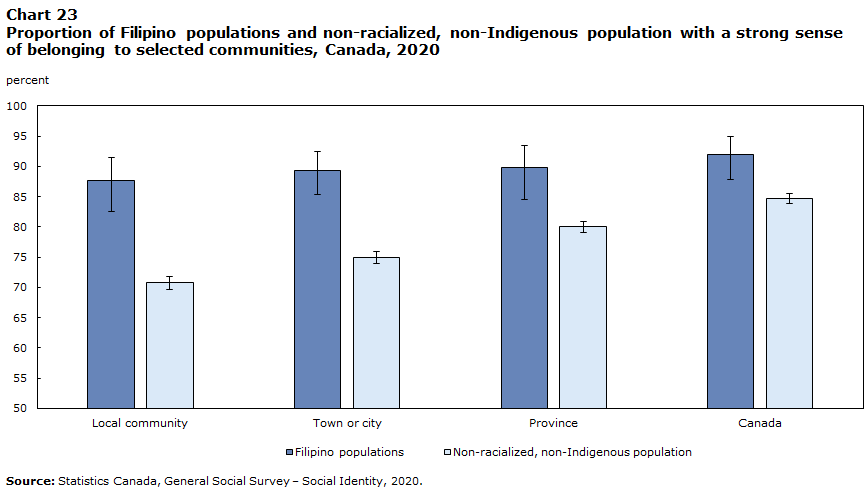
Data table for Chart 23
| Community | Filipino populations | Non-racialized, non-Indigenous population | ||||
|---|---|---|---|---|---|---|
| percent | 95% confidence interval | percent | 95% confidence interval | |||
| lower | upper | lower | upper | |||
| Source: Statistics Canada, General Social Survey – Social Identity, 2020. | ||||||
| Local community | 87.7 | 82.6 | 91.4 | 70.7 | 69.7 | 71.8 |
| Town or city | 89.4 | 85.3 | 92.5 | 75.0 | 74.0 | 76.0 |
| Province | 89.9 | 84.5 | 93.5 | 80.0 | 79.1 | 80.9 |
| Canada | 92.0 | 87.9 | 94.9 | 84.7 | 83.8 | 85.5 |
Filipinos report higher confidence in key institutions than the non-racialized, non-Indigenous population, especially in the justice system and federal Parliament
Filipino populations also had higher levels of confidence in key Canadian institutions. In 2020, 68.5% of Filipinos had high confidence in the justice system and courts, significantly higher than the 53.0% reported by the non-racialized, non-Indigenous population (Chart 24). Compared with the non-racialized, non-Indigenous population, confidence in the federal Parliament was also notably higher among Filipinos (63.3% versus 40.7%), as was confidence in the school system (67.3% versus 57.2%).
Filipinos also showed stronger confidence in financial institutions. About 62.8% of Filipinos reported high confidence in banks, compared with 51.8% of the non-racialized, non-Indigenous population. Additionally, Filipino populations were significantly more likely to express high confidence in major corporations (45.2% versus 25.8%). However, when it came to local businesses, Filipinos were less likely to report high confidence (59.3% versus 69.0%).
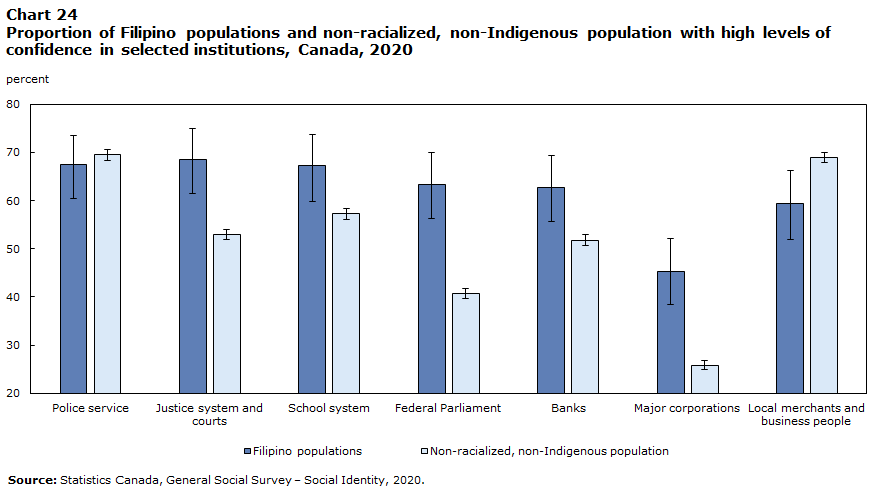
Data table for Chart 24
| Institution | Filipino populations | Non-racialized, non-Indigenous population | ||||
|---|---|---|---|---|---|---|
| percent | 95% confidence interval | percent | 95% confidence interval | |||
| lower | upper | lower | upper | |||
| Source: Statistics Canada, General Social Survey – Social Identity, 2020. | ||||||
| Police service | 67.4 | 60.4 | 73.6 | 69.5 | 68.4 | 70.6 |
| Justice system and courts | 68.5 | 61.4 | 74.9 | 53.0 | 51.9 | 54.1 |
| School system | 67.3 | 59.9 | 73.8 | 57.2 | 56.1 | 58.3 |
| Federal Parliament | 63.3 | 56.3 | 69.9 | 40.7 | 39.7 | 41.8 |
| Banks | 62.8 | 55.7 | 69.4 | 51.8 | 50.6 | 52.9 |
| Major corporations | 45.2 | 38.4 | 52.2 | 25.8 | 24.9 | 26.8 |
| Local merchants and business people | 59.3 | 52.0 | 66.2 | 69.0 | 67.9 | 70.0 |
Filipinos are more likely than the non-racialized, non-Indigenous population to engage in community and religious-affiliated groups
One of the indicators of social inclusion is engagement in civic and local activities. Filipinos were particularly involved in religious organizations, with 26.2% reporting membership in religious-affiliated groups, nearly three times the share observed among the non-racialized, non-Indigenous population (9.8%) (Chart 25).
Filipinos were likely to participate in community organizations at a rate similar to that of the non-racialized, non-Indigenous population (61.9% and 59.8%, respectively). However, they were less likely to be involved in sports or recreational organizations, at 18.5%, than the non-racialized, non-Indigenous population (29.8%).
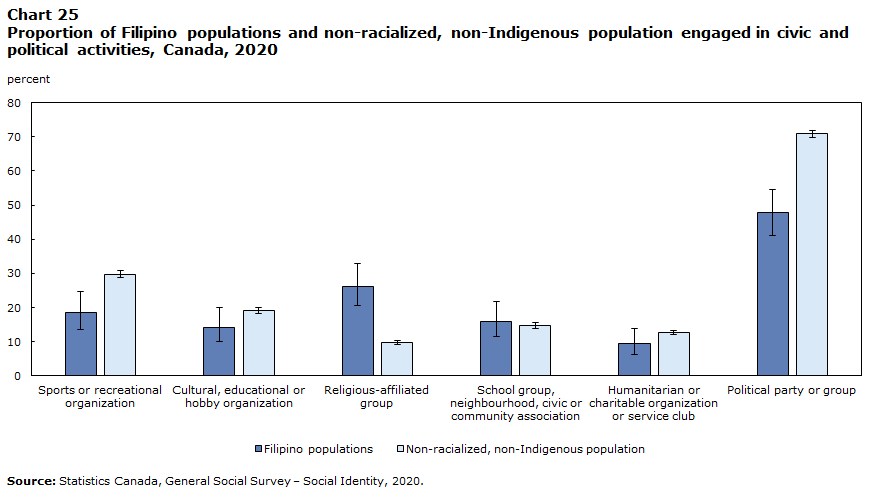
Data table for Chart 25
| Group, organization or association | Filipino populations | Non-racialized, non-Indigenous population | ||||
|---|---|---|---|---|---|---|
| percent | 95% confidence interval | percent | 95% confidence interval | |||
| lower | upper | lower | upper | |||
| Source: Statistics Canada, General Social Survey – Social Identity, 2020. | ||||||
| Sports or recreational organization | 18.5 | 13.7 | 24.6 | 29.8 | 28.9 | 30.9 |
| Cultural, educational or hobby organization | 14.3 | 10.0 | 19.9 | 19.0 | 18.2 | 19.9 |
| Religious-affiliated group | 26.2 | 20.5 | 32.9 | 9.8 | 9.2 | 10.5 |
| School group, neighbourhood, civic or community association | 16.0 | 11.6 | 21.7 | 14.7 | 13.9 | 15.5 |
| Humanitarian or charitable organization or service club | 9.5 | 6.3 | 14.0 | 12.7 | 12.0 | 13.4 |
| Political party or group | 47.9 | 41.2 | 54.6 | 70.9 | 69.9 | 71.8 |
Filipinos are nearly three times as likely as the non-racialized, non-Indigenous population to experience discrimination
Filipino populations reported significantly higher rates of discrimination (31.6%) than the non-racialized, non-Indigenous population (11.8%). The most common grounds for discrimination among Filipinos were race or skin colour (22.8%), ethnicity or culture (16.3%), and language (7.9%).
Filipinos were nearly twice as likely as the non-racialized, non-Indigenous population to experience discrimination (Chart 26) in stores, banks or restaurants (57.0% versus 30.8%). Additionally, 31.1% of Filipinos experienced discrimination at work or when applying for a job or promotion, compared with 24.8% of the non-racialized, non-Indigenous population. However, rates of discrimination when dealing with police were similar between the two groups (3.0% for Filipinos; 4.0% for the non-racialized, non-Indigenous population).
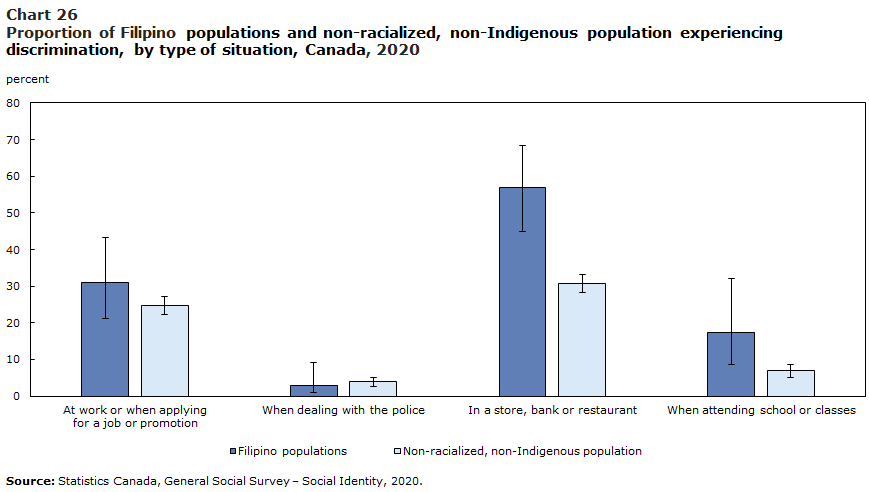
Data table for Chart 26
| Type of situation | Filipino populations | Non-racialized, non-Indigenous population | ||||
|---|---|---|---|---|---|---|
| percent | 95% confidence interval | percent | 95% confidence interval | |||
| lower | upper | lower | upper | |||
| Source: Statistics Canada, General Social Survey – Social Identity, 2020. | ||||||
| At work or when applying for a job or promotion |
31.1 | 21.1 | 43.2 | 24.8 | 22.4 | 27.4 |
| When dealing with the police | 3.0 | 1.0 | 9.1 | 4.0 | 2.9 | 5.5 |
| In a store, bank or restaurant | 57.0 | 44.9 | 68.4 | 30.8 | 28.3 | 33.4 |
| When attending school or classes | 17.3 | 8.5 | 32.2 | 7.1 | 5.6 | 9.0 |
Filipinos have smaller but more ethnically diverse social networks than the non-racialized, non-Indigenous population
Filipinos reported smaller local personal
However, Filipinos had more ethnically diverse social networks. In 2020, 40.4% of Filipinos reported having ethnically diverse networks of friends and acquaintances, more than double the proportion of the non-racialized, non-Indigenous population (17.4%). Thus, while Filipinos may have smaller personal networks, their social circles tend to be more diverse.
Filipino populations may also benefit from social ties that provide both practical and emotional support, even when those networks are smaller. According to Stick et al. (2024), immigrant women in Canada, including those from the Philippines, were among the most likely to have established local support networks, particularly in urban centres, for navigating critical aspects of settlement, including housing, employment and child care.
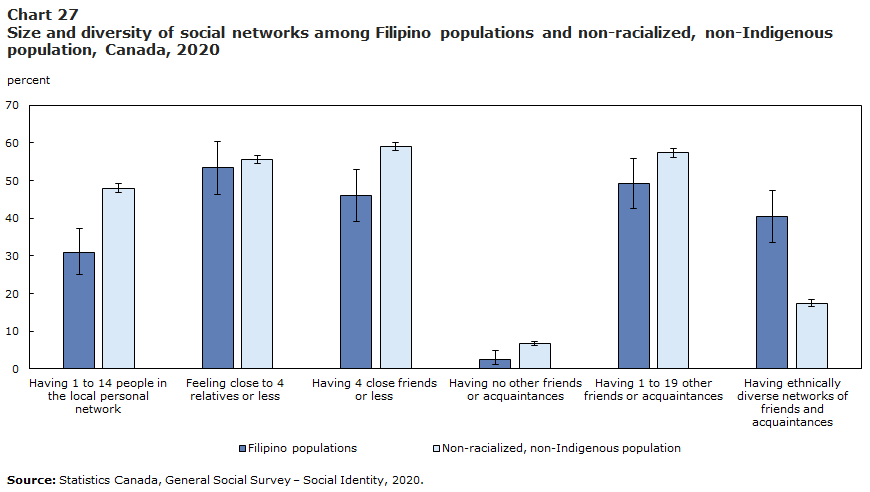
Data table for Chart 27
| Size and diversity of social networks | Filipino populations | Non-racialized, non-Indigenous population | ||||
|---|---|---|---|---|---|---|
| percent | 95% confidence interval | percent | 95% confidence interval | |||
| lower | upper | lower | upper | |||
| Source: Statistics Canada, General Social Survey – Social Identity, 2020. | ||||||
| Having 1 to 14 people in the local personal network | 30.9 | 25.1 | 37.4 | 48.0 | 46.9 | 49.2 |
| Feeling close to 4 relatives or less | 53.5 | 46.4 | 60.5 | 55.7 | 54.6 | 56.7 |
| Having 4 close friends or less | 46.0 | 39.1 | 53.0 | 59.0 | 57.9 | 60.1 |
| Having no other friends or acquaintances | 2.4 | 1.2 | 4.9 | 6.8 | 6.3 | 7.3 |
| Having 1 to 19 other friends or acquaintances | 49.3 | 42.7 | 55.9 | 57.4 | 56.2 | 58.5 |
| Having ethnically diverse networks of friends and acquaintances | 40.4 | 33.7 | 47.5 | 17.4 | 16.5 | 18.4 |
Conclusion
Filipino populations in Canada have been shaped by an evolving immigration history over recent decades. They are growing in size, quadrupling from 234,195 in the 1996 Census to 957,355 in the 2021 Census. Immigration continues to drive the growth of the Filipino populations, with recent immigrants admitted after 2011 representing nearly half of Filipino immigrants living in Canada in 2021. The Filipino populations are predominantly first generation immigrants, with fewer multigenerational ties compared with some other racialized groups. About three in four Filipinos in Canada are foreign-born, with the Philippines as the leading place of birth, although a growing share are born in Canada. Filipino populations in Canada maintain strong transnational ties to the Philippines. In 2021, 97.2% of Filipinos in Canada have at least one parent born in the Philippines. Even among those born outside the Philippines and Canada, the vast majority (88.2%) have at least one parent born there.
Filipino populations have a wide range of migration experiences and socioeconomic profiles. The majority of first-generation Filipinos are of working age (aged 25 to 64), while the second generation and the third generation or more are predominantly children and youth. Although Filipino women outnumber men, their relative share has decreased over the past 25 years. Filipino immigration to Canada has been predominantly labour-driven, with economic immigration as the main admission category. Within economic immigrants, Filipinos have been admitted mainly as skilled workers, provincial nominees and caregivers. Across immigration cohorts, admission patterns shifted from near parity between economic immigration and family sponsorship to a predominance of economic immigration, with caregiver and provincial nominee streams becoming increasingly central among recent Filipino newcomers.
The linguistic profile of Filipinos mirrors the rich, multilingual landscape of the Philippines. Almost two-thirds report Tagalog (Pilipino, Filipino) or English as their only mother tongue, with non-official languages dominating among first-generation immigrants. In contrast, second-generation Filipinos shift markedly toward English, and non-official languages are nearly nonexistent as mother tongues for the third generation or more, illustrating an intergenerational language transition. In terms of religion, over 9 in 10 Filipinos report a religious affiliation, with Catholicism remaining predominant; however, the share with no religious affiliation increased across generations.
In 2021, Filipino populations in Canada were highly represented at the bachelor’s degree level, with 46.0% of core-aged adults holding a bachelor’s degree or higher, above the rate for the non-racialized, non-Indigenous population. Filipinos also had one of the lowest proportions without formal credentials and were more likely than other non-racialized groups to have obtained their education outside Canada, particularly among first-generation immigrants. Filipino women were more likely than men to have achieved higher levels of education, a pattern that persisted and widened across generations. However, the overall level of educational attainment declined between the first generation and the third generation or more, especially among men.
Filipino populations demonstrate strong engagement in the labour market. Both in the 2021 Census and in the 2026 Labour Force Survey, the labour force participation rates of Filipinos were among the highest across racialized groups. Similarly, their unemployment rates were the lowest across racialized groups and non-racialized, non-Indigenous population. Occupational profiles reveal that many Filipino immigrants work in the health and service sectors. They are nearly five times more likely to enter Canada as caregivers than the overall racialized population, and they remain significantly underrepresented in formal leadership roles such as board directorships and executive positions. Compared with the non-racialized, non-Indigenous population, Filipinos are less likely to work in professional and management occupations and more likely to work in semi-skilled, labour, and entry-level occupations. Despite their high levels of educational attainment and labour force participation, the majority of Filipinos, particularly those educated outside Canada, experienced overqualification. The data show that nearly half of core-aged Filipinos with a bachelor’s degree or higher were overqualified for their job, with the rates rising further among those educated outside Canada. As shown throughout Section 3, overqualification remains a persistent labour-market outcome for Filipino immigrants educated outside Canada. Overqualification is markedly higher among recent immigrants, those educated in the Philippines, and those admitted through caregiver and family-sponsorship streams, with rates often two to three times higher than among their Canadian-educated counterparts. At the same time, recent Filipino immigrants, particularly women, and especially those admitted through caregiver streams, experience higher unemployment than established immigrants, even as they remain strongly attached to the labour market.
Filipinos in Canada reported a strong sense of belonging to Canada, their province, their town or city, and their local communities, along with higher levels of confidence in many key institutions compared with the non-racialized, non-indigenous population. Despite their strong sense of belonging and civic participation, Filipino populations are facing higher levels of discrimination compared with the non-racialized, non-indigenous population.
In conclusion, there is no single Filipino Canadian experience. The experiences of Filipino populations in Canada are shaped by different immigration streams, gendered labour trajectories, regional factors and generational shifts. Knowledge gaps remain in understanding intergenerational outcomes and regional disparities, as well as the experiences of Filipinos in smaller cities and rural areas, where geographic isolation may pose unique challenges to social and economic integration.
Note to readers
Data sources
This analysis was conducted principally using data from the 2021 Census of Population (long-form questionnaire). In addition, data were used from earlier years of the Census of Population long-form questionnaire (1996 to 2016) and the 2011 National Household Survey. Data from the 2020 General Social Survey – Social Identity, and the Labour Force Survey were also used.
In 2021 and 2016, a sample of 25% of Canadian households received the long-form census questionnaire, while in 2006, 2001 and 1996, 20% received the long-form census questionnaire. In 2011, 33% of households received the voluntary National Household Survey.
The long-form census questionnaire covers the population in private households (that is, excluding those in collective dwellings such as nursing homes, rooming houses, military bases or prisons). The target population of the portrait when using census data was the population in private households in occupied private dwellings, meaning the portrait also excluded people who were living outside Canada on government, military or diplomatic postings.
The long-form census questionnaire covers Canadian citizens (by birth and naturalization), permanent residents, and non-permanent residents and their families living with them in Canada. Non-permanent residents are people who hold a work or study permit or who have claimed refugee status (e.g., asylum claimants, protected persons and related groups). Foreign residents, such as representatives of a foreign government assigned to an embassy, a high commission or another diplomatic mission in Canada, as well as residents of another country who are visiting Canada temporarily, are not covered by the census.
The 2020 General Social Survey – Social Identity covers a sample of non-institutionalized persons (i.e., persons in private households in occupied private dwellings) aged 15 years or over, excluding residents of the territories and of First Nations reserves.
The Labour Force Survey is conducted on a monthly basis. Its reference week for information on employment and unemployment is usually the week containing the 15th day of the month. It covers a sample of persons aged 15 years and over whose usual place of residence is in Canada. It does not include people living on reserves, full-time members of the regular Armed Forces or persons living in institutions (including inmates of penal institutions and patients in hospitals and nursing homes).
Methods
This paper provides descriptive analysis of the characteristics of the Filipino populations in Canada.
Random rounding
To ensure confidentiality, the values, including totals, are randomly rounded either up or down to a multiple of '5' or '10.' To understand these data, you must be aware that each individual value is rounded. As a result, when these data are summed or grouped, the total value may not match the individual values since totals and sub-totals are independently rounded. Similarly, percentages, which are calculated on rounded data, may not necessarily add up to 100%.
Definitions
Admission category: Admission category refers to the name of the immigration program or group of programs under which an immigrant has been granted for the first time the right to live in Canada permanently by immigration authorities. In the 2021 Census of Population, data on admission category are available for immigrants who were admitted to Canada between January 1, 1980, and May 11, 2021.
Asylum claimant: Asylum claimant refers to a foreign national who has made a refugee claim while in Canada on a temporary basis and whose claim is pending decision. Protected person refers to a person who has made a claim in Canada and received a positive decision. For the census, protected persons leave this population if they obtain permanent residence. Related groups include those who received a negative decision or withdrew or abandoned their claim and have not yet regularized their status or departed Canada. Separate estimates for asylum claimants, protected persons and related groups are not available.
Caregiver admission category: Caregivers include immigrants granted permanent residence after providing care in Canada for children, seniors, people with disabilities or individuals with chronic disease for a determinate period of time. Most immigrants classified under this category worked as caregivers in a private residence in Canada during their qualifying period of temporary work. The first immigrants admitted under this category landed in 1982. Since then, this category has included caregivers under the Foreign Domestic Movement Program (1981 to 1992), the Live-in Caregiver Program (1992 to 2014), the Caring for Children pilot and the Caring for People with High Medical Needs pilot (2014 to 2019), and the Interim Pathway for Caregivers (2019). As of June 18, 2019, caregivers can apply for permanent residence through the Home Child Care Provider Pilot or Home Support Worker Pilot if they meet eligibility requirements.
Core working age: In this portrait, the core working age or the core-age population is individuals aged 25 to 54 years. While the working-age population is defined more broadly, the core working-age group concentrates on those with the highest levels of labour force participation and attachment.
Economic immigrant: An economic immigrant is an immigrant who has been selected for their ability to contribute to Canada's economy through their ability to meet labour market needs, to own and manage or to build a business, to make a substantial investment, to create their own employment or to meet specific provincial or territorial labour market needs.
Educational attainment: “Educational attainment”, “level of education” and “highest level of education” refer to the highest level of education that a person has successfully completed, using the classification “Highest certificate, diploma or degree”. The general hierarchy used in deriving this variable (high school, trades, college, university) is loosely tied to the 'in-class' duration of the various types of education.
Employment rate: The employment rate for a particular group (age, sex, marital status, geographic area, etc.) is the number of persons in that group who were employed in the week of Sunday, May 2 to Saturday, May 8, 2021, expressed as a percentage of the total population in that group. It is applicable to the population aged 15 years and over. The employed population includes people who did any paid work as an employee or self-employed person; did unpaid work contributing directly to the operation of a farm, business or professional practice owned and operated by a related member of the same household; or had a job but were not at work due to factors such as their own illness or disability, personal or family responsibilities, vacation or a labour dispute.
Filipino populations: In this portrait, Filipino populations were defined using the population group question in the Census of Population. Since the 1996 Census, “Filipino” has been listed as a population group on the census questionnaire, based on the Employment Equity Act and its regulations. Respondents could select one or more population groups or provide a write-in response. This definition includes individuals who marked Filipino only; wrote responses associated with Filipino, such as Igorot or Ilocano; selected Filipino and wrote a related term (e.g., selecting Filipino and writing Igorot [combination response]); selected both Filipino and White only; and selected White and wrote in Filipino. Multiple responses beyond these combinations were excluded from this analysis.
Gender: This refers to an individual’s personal and social identity as a man, woman or non-binary person (a person who is not exclusively a man or a woman) and includes the following concepts:
- gender identity, which refers to the gender that a person feels internally and individually
- gender expression, which refers to the way a person presents their gender, regardless of their gender identity, through body language, aesthetic choices or accessories (e.g., clothes, hairstyle and makeup) that may have traditionally been associated with a specific gender.
A person’s gender may differ from their sex at birth, and from what is indicated on their current identification or legal documents such as their birth certificate, passport or driver’s licence. A person’s gender may change over time. Some people may not identify with a specific gender.
The sex variable in census years before 2021 and the two-category gender variable in the 2021 Census are combined in this analysis to make historical comparisons. Although sex and gender refer to two different concepts, the introduction of gender in 2021 is not expected to have a significant impact on data analysis and historical comparability, given the small size of the transgender and non-binary populations. For additional information on changes of concepts over time, please consult the Age, Sex at Birth and Gender Reference Guide, Census of Population, 2021.
Given that the non-binary population is small, data aggregation to a two-category gender variable is sometimes necessary to protect the confidentiality of responses. In these cases, individuals in the category “non-binary persons” are distributed into the other two gender categories. Unless otherwise indicated, the category “men” includes men, boys and some non-binary people, while the category “women” includes women, girls and some non-binary people.
Generation status: A person’s generation status refers to whether the person or the person’s parents were born in Canada.
- The term “first generation” includes people who were born outside Canada.
- The term “second generation” includes people who were born in Canada and had at least one parent born outside Canada.
- The term “third generation or more” includes people who were born in Canada and whose parents were also born in Canada.
Immigrant: This refers to a person who is, or has been, a landed immigrant or permanent resident. Such a person has been granted the right to live in Canada permanently by immigration authorities. Immigrants who have obtained Canadian citizenship by naturalization are included in this group. In the 2021 Census of Population, it includes immigrants who were admitted to Canada on or prior to May 11, 2021.
Immigrant sponsored by family: An immigrant sponsored by family is an immigrant who was sponsored by a Canadian citizen or permanent resident and was granted permanent resident status based on their relationship either as the spouse, partner, parent, grandparent, child or other relative of this sponsor. The terms 'family class' or 'family reunification' are sometimes used to refer to this category.
Location of study: This refers to the country of the institution from which a person obtained their highest certificate, diploma or degree. It refers to the location of the institution granting the certificate, diploma or degree, not the location of the person at the time they obtained the qualification or were attending the institution.
Non-permanent resident: This refers to a person from another country with a usual place of residence in Canada and who has a work or study permit or who has claimed refugee status (asylum claimant, protected person and related groups). Family members living with work or study permit holders are also included, unless these family members are already Canadian citizens or landed immigrants or permanent residents.
Non-racialized, non-Indigenous population: In this portrait, the non-racialized, non-Indigenous population is measured with the category “not a visible minority” in the population group question, and excludes people who identified as First Nations, Métis or Inuit on the Indigenous group question. For more information on the visible minority and population group variables, consult the Visible Minority and Population Group Reference Guide, Census of Population, 2021.
Occupation: This refers to the kind of work performed in a job, a job being all the tasks carried out by a particular worker to complete his or her duties. An occupation is a set of jobs that are sufficiently similar in work performed. In the 2021 Census of Population, occupations are classified according to the National Occupational Classification (NOC) 2021 Version 1.0.
Overqualification: Overqualification refers to the mismatch between a worker’s educational attainment and the level of education required for their job. Overqualification occurs when individuals with a university degree hold a job that requires no more than a high school education. In this portrait, overqualification refers to individuals aged 25 to 54 years old with a bachelor’s degree or higher who, during the 2021 Census year or the previous year, held a position that typically requires a high school diploma or equivalency certificate or less. This definition excludes individuals whose highest level of education was below a bachelor’s degree, individuals in management occupations, individuals who did not work during the reference year or the year before the census, immigrants who first obtained landed immigrant or permanent resident status in or before the census year and whose last job during the reference year was outside Canada, and non-permanent residents whose last job during the reference period was outside Canada.
Place of birth: This refers to the name of the geographic location (in this Portrait, the country or area of interest) where the person was born. The geographic location is specified according to geographic boundaries current at the time of data collection, not the geographic boundaries at the time of birth.
Period of immigration: This refers to the period when the immigrant first obtained their landed immigrant or permanent resident status in Canada. This may differ from the year of first arrival in Canada.
Racialized populations: In this portrait, “racialized populations” or “racialized groups” are defined as people categorized as “visible minorities” (“South Asian”, “Chinese”, “Black”, “Filipino”, “Latin American”, “Arab”, “Southeast Asian”, “West Asian”, “Korean”, “Japanese”, “multiple visible minorities”, and “visible minority not identified elsewhere”) according to the visible minority variable. In this analysis, the racialized populations exclude Indigenous respondents. For more information about the derivation of the racialized populations, consult the Visible Minority and Population Group Reference Guide, Census of Population, 2021.
Refugee: A refugee is an immigrant who was granted permanent resident status based on a well-founded fear of returning to their home country. This category includes persons who had a well-founded fear of persecution for reasons of race, religion, nationality, membership in a particular social group or for political opinion (Geneva Convention refugees) as well as persons who had been seriously and personally affected by civil war or armed conflict, or had suffered a massive violation of human rights. Some refugees were in Canada when they applied for refugee protection for themselves and their family members (either with them in Canada or abroad), while others were abroad and were referred for resettlement to Canada by the United Nations Refugee Agency, another designated referral organization or private sponsors.
Religion: This refers to a person’s self-identified connection to or affiliation with any religious denomination, group, body, or other religiously defined community or system of belief. Religion is not limited to formal membership in a religious organization or group. For infants or children, religion refers to the specific religious group or denomination, if any, in which they are being raised. For more information about this variable, consult the Religion of person
Rural area: In this portrait, a rural area is defined using the Statistical Area Classification (SAC), which is based on the concept Metropolitan Influenced Zone (MIZ). All census subdivisions (CSDs) in the provinces and territories that lie outside census metropolitan areas (CMAs) and census agglomerations (CAs) are classified according to the degree of influence of nearby CMAs or CAs. In the provinces, these CSDs are assigned to one of four MIZ categories—strong, moderate, weak, or no influence—based on commuting flows. In the territories, CSDs located outside CAs are assigned to a separate category.
Skilled worker admission category: Skilled workers include immigrants who have been selected for their ability to meet specific labour needs as skilled workers. They were assessed based on selection criteria such as their education; language abilities; and work experience in management, professional or technical jobs.
Training, education, experience and responsibilities categories: The training, education, experience and responsibilities (TEER) categories refer to a variant of the National Occupational Classification 2021 Version 1.0 designed for analytical purposes. These categories group occupations based on the level and type of training, formal education, work experience and responsibilities typically required. They range from TEER 0 (management occupations) to TEER 5 (occupations requiring minimal training and no formal education). The TEER structure provides a consistent framework for analyzing occupational skill levels across the Canadian labour market.
TEER 0—management occupations: Management occupations refer to occupations with management responsibilities, including legislators, senior managers and middle managers.
TEER 1—professional occupations: Professional occupations require completion of a university degree (bachelor’s, master’s or doctorate) or previous experience and expertise in subject-matter knowledge from a related occupation found in TEER 2 (when applicable).
TEER 2 occupations: Occupations in TEER 2 usually require completion of a postsecondary education program of two to three years at a community college, an institute of technology or a CEGEP; completion of an apprenticeship training program of two to five years; several years of experience in a related occupation from TEER 3 (when applicable). This category also includes occupations with supervisory or significant safety responsibilities (e.g., police officers and firefighters).
TEER 3 occupations: Occupations in TEER 3 usually require completion of a postsecondary education program of less than two years at a community college, an institute of technology or a CEGEP; completion of an apprenticeship training program of less than two years; or more than six months of on-the-job training, training courses or specific work experience with some secondary school education.
TEER 4 occupations: Occupations in TEER 4 usually require completion of secondary school, several weeks of on-the-job training with some secondary school education, or experience in a related occupation from TEER 5 (when applicable).
TEER 5 occupations: Occupations in TEER 5 usually require a short work demonstration and no formal educational requirements.
Unemployment rate: The unemployment rate for a particular group (age, sex, marital status, geographic area, etc.) is the number of persons in that group who were unemployed in the week of Sunday, May 2 to Saturday, May 8, 2021, expressed as a percentage of the labour force in that group. It is applicable to the population aged 15 years and over. The unemployed population includes persons who during the above reference period were without work but had looked for work in the past four weeks ending with the reference period and were available for work; were on temporary layoff due to business conditions and were available for work; or were without work, had a job to start within four weeks from the reference period and were available for work. The labour force refers to people who were either employed or unemployed.
Urban area: An urban area refers to a census subdivision (CSD) that is a component of a census metropolitan area (CMA) or a census agglomeration (CA).
Working-age population: In this portrait, the working-age population refers to the population aged 25 to 64.
Year of immigration: This refers to the year in which a person obtained permanent residency in Canada. This may not be the same as the year that they first arrived in Canada.
References
Alarcon, K. (2024). First Filipina nanny helped community grow. Yukon News. [Web page]. Reprinted by Hidden Histories Society Yukon. https://hhsy.org/first-filipina-nanny-helped-community-grow-yukon-news-2/
Bonifacio, G. T. (2013). Pinay on the prairies: Filipino women and transnational identities. Vancouver: UBC Press. https://doi.org/10.59962/9780774825818
Bonikowska, A., Handler, T., & Frenette, M. (2024). High school graduation and postsecondary enrolment of Black, Latin American and other population groups: What explains the differences? Economic and Social Reports. Statistics Canada Catalogue no. 36-28-0001. https://doi.org/10.25318/36280001202400200003-eng
Canadian Heritage. (2025). Significant events in the history of Asian communities in Canada. https://www.canada.ca/en/canadian-heritage/campaigns/asian-heritage-month/important-events.html
Citizenship and Immigration Canada. (2010). A commitment to foreign credential recognition: Government of Canada progress report 2009. Citizenship and Immigration Canada. https://publications.gc.ca/collections/collection_2010/cic/Ci1-12-2009-eng.pdf
Citizenship and Immigration Canada. (2012, March). IMDB 2008 immigration category profiles: Live-in caregiver: findings from the Longitudinal Immigration Database (IMDB), IMDB 2008 Research Series. Catalogue no. Ci3-10/5-2012E-PDF. Ottawa, ON: Citizenship and Immigration Canada.
Chen, W.-H., & Hou, F. (2019, February 18). Intergenerational education mobility and labour market outcomes: Variation among the second generation of immigrants in Canada . Analytical Studies Branch Research Paper Series. Statistics Canada Catalogue no. 11F0019M — No. 418. https://www150.statcan.gc.ca/n1/pub/11f0019m/11f0019m2019006-eng.htm
Cornelissen, L. (2021). Profile of immigrants in nursing and health care support occupations. Insights on Canadian Society. Statistics Canada Catalogue no. 75-006-X. https://www150.statcan.gc.ca/n1/pub/75-006-x/2021001/article/00004-eng.htm
Department of Manpower and Immigration. (1973). Immigration Statistics, 1962–1972. Ottawa: Department of Manpower and Immigration.
Eric, J. (2012). The rights of passage of Filipino Canadians in Canada: Two migration cohorts. In R. S. Coloma, B. McElhinny, E. Tungohan, J. P. C. Catungal, & L. M. Davidson (Eds.), Filipinos in Canada: Disturbing invisibility, pp. 123-141. University of Toronto Press.
Frank, K., Park, J., Cyr, P., Weston, S., & Hou, F. (2023). Internationally educated health care professionals in Canada: Sociodemographic characteristics and occupational distribution. Economic and Social Reports. Statistics Canada Catalogue no. 36-28-0001. https://www150.statcan.gc.ca/n1/pub/36-28-0001/2023008/article/00004-eng.htm
Government of Alberta. (2008). Alberta and Philippines sign worker memorandum [Press release]. https://www.alberta.ca/release.cfm?xID=24453B9BFBFE5-980B-E353-4303727DAA4E4FBF
Government of British Columbia. (2008). B.C., Philippines sign worker agreement [Press release]. https://archive.news.gov.bc.ca/releases/news_releases_2005-2009/2008ECD0001-000116.htm
Government of Manitoba. (2008). Memorandum of Understanding between the Department of Labour and Employment of the Republic of the Philippines and the Department of Labour and Immigration of the Government of Manitoba, Canada concerning co-operation in human resource deployment and development. https://www.aspeninstitute.org/wp-content/uploads/2010/05/MOU_Manitoba-_Philippines.pdf
Government of Saskatchewan. (2006). Government signs immigration agreement with the Philippines to bring more skilled workers here [Press release]. https://www.saskatchewan.ca/government/news-and-media/2006/december/18/government-signs-immigration-agreement-with-the-philippines-to-bring-more-skilled-workers-here
Government of Yukon. (2022). Memorandum of Understanding between the Government of Yukon and the Department of Migrant Workers of the Republic of the Philippines on cooperation in the field of labour and human resources development. https://yukon.ca/en/memorandum-understanding-between-yukon-and-philippines-immigration
Hou, F., Schimmele, C., & Stick, M. (2023). Changing demographics of racialized people in Canada. Economic and Social Reports. Statistics Canada Catalogue no. 36-28-0001. https://www150.statcan.gc.ca/n1/pub/36-28-0001/2023008/article/00001-eng.htm
Hudon, T. (2016). Visible minority women. Women in Canada: A Gender-based Statistical Report. Statistics Canada Catalogue no. 89-503-X. https://www150.statcan.gc.ca/n1/en/pub/89-503-x/2015001/article/14315-eng.pdf?st=Jf5AMs-Y
Immigration, Refugees and Citizenship Canada. (2016). Ethnocultural brief, People of Filipino Ethnic Origin in Canada. Immigration, Refugees and Citizenship Canada.
Library and Archives Canada. (n.d.-a). Census of Canada, 1901 (Statistics Canada fonds, RG31; Fourth Census of Canada, Province of British Columbia, District of Burrard, Sub-District 1, Polling District 3, Howe Sound; p. 7) [Digitized census image]. Government of Canada.
Library and Archives Canada. (n.d.-b). Census of Canada, 1911 (Statistics Canada fonds, RG31; Fifth Census of Canada, Province of British Columbia, District of Richmond, Bowen Island; p. 6) [Digitized census image]. Government of Canada.
Kelly, P. (2021). Immigration, employment precarity and masculinity in Filipino-Canadian families. In J. Hoerder, S. Salomo, & K. Radhika (Eds.), Growing up and getting by: International perspectives on transitions to adulthood, pp. 211-230). Policy Press. https://doi.org/10.1332/policypress/9781447352891.003.0011
Kuhn, A. C. (2022). In Sight: MOVING Filipino Canadians into Leadership? [Doctoral dissertation]. Royal Roads University.
Li, P. S. (2003). Cultural diversity in Canada: The social construction of racial difference. Department of Justice Canada. https://www.justice.gc.ca/eng/rp-pr/csj-sjc/jsp-sjp/rp02_8-dr02_8/index.html
Longpré-Verret, L.-M., & Richards, E. (2021). Diversity among board directors and officers: Exploratory estimates on family, work and income. Analytical Studies Branch Research Paper Series. Statistics Canada Catalogue no. 11F0019M – No. 2021005. https://www150.statcan.gc.ca/n1/pub/11f0019m/11f0019m2021005-eng.htm
Lusis, T. (2009). Filipino immigrants in Canada: A literature review and directions for further research on second-tier cities and rural areas. Immigrant Labour Project, University of Guelph.
Malek, J. G., & Canadian Heritage. (2021). Filipinos in Canada. Published by the Canadian Historical Association with the support of the Department of Canadian Heritage, Government of Canada.
Mann, T. (Ed.). (2018). Australian law dictionary (Third edition). Oxford University Press. https://www.oxfordreference.com/display/10.1093/oi/authority.20110803100136805
McFarland, C. D. (1994). Subgrouping and number of the Philippine languages or how many Philippine languages are there. Philippine journal of linguistics, 25, 75-84.
Mendoza, M. G. (2012). Educated minorities: The experiences of Filipino Canadian University Students. Filipinos in Canada: Disturbing invisibility, 360-381. University of Toronto Press. https://doi.org/10.3138/9781442662728-024
McElhinny, B., Davidson, L. M., Catungal, J. P. C., Tungohan, E., & Coloma, R. S. (2012). Spectres of (in)visibility: Filipina/o labour, culture, and youth in Canada. In R. S. Coloma, B. McElhinny, E. Tungohan, J. P. C. Catungal, & L. M. Davidson (Eds.), Filipinos in Canada: Disturbing invisibility, 46-67. University of Toronto Press. https://utppublishing.com/doi/10.3138/9781442613492.002
Picot, G., Hou, F., & Crossman, E. (2023). The Provincial Nominee Program: Its expansion in Canada. Economic and Social Reports. Statistics Canada Catalogue no. 36-28-0001. https://doi.org/10.25318/36280001202300700004-eng
Statistics Canada. (2021). Table 98-10-0453-01 Statistics Canada. Job permanency by highest level of education, occupation major group, employment income statistics, age and gender: Canada, provinces and territories, census metropolitan areas and census agglomerations with parts. [Data table]. https://doi.org/10.25318/9810045301-eng
Statistics Canada. (2022a, October 26). The Canadian census: A rich portrait of the country's religious and ethnocultural diversity. The Daily. https://www150.statcan.gc.ca/n1/en/daily-quotidien/221026/dq221026b-eng.pdf
Statistics Canada. (2022b, October 26). Immigrants make up the largest share of the population in over 150 years and continue to shape who we are as Canadians. The Daily. https://www150.statcan.gc.ca/n1/en/daily-quotidien/221026/dq221026a-eng.pdf
Statistics Canada. (2022c, December 16). Focus on Geography Series, 2021 Census of Population – Yukon, Territory [Web page]. https://www12.statcan.gc.ca/census-recensement/2021/as-sa/fogs-spg/page.cfm?topic=9&lang=e&dguid=2021A000260
Statistics Canada. (2023). Table 17-10-0146-01 Projected population by racialized group, generation status and other selected characteristics (x 1,000)[Data table]. https://www150.statcan.gc.ca/t1/tbl1/en/tv.action?pid=1710014601
Statistics Canada. (2024a). Social Inclusion Framework for Ethnocultural Groups in Canada [Infosheet]. https://www.statcan.gc.ca/en/topics-start/gender_diversity_and_inclusion/social-inclusion-framework
Statistics Canada. (2024b, June 13). Labour market characteristics of persons with and without disabilities, 2023. The Daily. https://www150.statcan.gc.ca/n1/daily-quotidien/240613/dq240613b-eng.htm
Statistics Canada. (2024c, March 26). Table 98-10-0646-01 Legislative and senior management occupations by visible minority, selected sociodemographic characteristics and the census year: Canada, geographical regions of Canada, provinces and territories and census metropolitan areas with parts [Data table]. https://doi.org/10.25318/9810064601-eng
Stick, M., Hou, F., & Schimmele, C. (2023). The housing trajectories of Canadian-born racialized population groups. Economic and Social Reports. Statistics Canada Catalogue no. 36-28-0001. https://www150.statcan.gc.ca/n1/pub/36-28-0001/2023012/article/00003-eng.htm
Stick, M., Schimmele, C., Karpinski, M., & Arsenault, A. (2024). The social networks of immigrant women. Economic and Social Reports. Statistics Canada Catalogue no. 36-28-0001. https://doi.org/10.25318/36280001202400400006-eng
Uppal, S. (2023). Self-employment among women in Canada. Insights on Canadian Society. Statistics Canada Catalogue no. 75-006-X. https://www150.statcan.gc.ca/n1/en/pub/75-006-x/2023001/article/00014-eng.pdf
UNHCR. (2020). Seven Decades of Refugee Protection in Canada: 1950-2020. United Nations High Commissioner for Refugees. https://www.unhcr.ca/wp-content/uploads/2020/12/Seven-Decades-of-Refugee-Protection-In-Canada-14-December-2020.pdf
Wall, K., & Kow, B. (2023). A portrait of educational attainment and occupational outcomes among racialized populations in 2021. Census in Brief. Statistics Canada Catalogue no. 98-200-X. https://www150.statcan.gc.ca/n1/en/catalogue/98-200-X2021011
- Date modified: