
French-language early childhood and child care services in Canada outside Quebec, 2001 and 2016
by Catherine Frigon and Étienne Lemyre
Child care facilities can be linguistically stimulating environments for the young children who attend them. This is particularly true for children in French-language minority communities. For these children living in Canada outside Quebec, attending French-language child care can encourage the acquisition and development of French language skills and promote future integration into a French-language school environment.Note The importance of these services is included in the Government of Canada’s Action Plan for Official Languages 2018–2023, which provides for investments in the development of early childhood care services for official language minorities.
However, a 2019 survey revealed that more than one-third (36.4%) of Canadian parents had difficulty finding child care for their child.Note In light of this, this fact sheet aims to estimate the gap that may exist between the potential demand and supply of French-language early childhood care services in various regions of Canada outside of Quebec.
The information presented in this fact sheet comes from the 2001 and 2016 censuses of population, particularly the responses to parts A and B of the questions on languages used at work and languages spoken at home, as well as the questions on labour market activities.
In this fact sheet, “French-speaking children” means children living in Canada outside Quebec who are likely to attend a French-language child care facility. These are defined as all children aged 1 to 4 who lived in a census familyNote with at least one parentNote who spoke French most often at home.Note As a result, the children included in this study are those who either lived in a two-parent family where both parents spoke French most often at home, in a two-parent family where only one parent spoke French most often at home, or in a single-parent family where the parent spoke French most often at home. Children under 1 year of age are excluded from this study as they are not accepted in many child care facilities. In Canada in 2017, 15% of parents with children under the age of 1 used child care, while this was the case for 51% of parents with children aged 1, as well as for over 70% of parents with children aged 2 to 4.Note
Although these children are considered the most likely to attend French-language child care, it is important to note that not all parents who speak French at home choose to use French-language child care services. Similarly, parents who do not speak French at home may choose to use French-language child care. For these reasons, this fact sheet focuses on the potential demand for French-language child care rather than the actual demand.
“Child care workers” include home child care providersNote and early childhood educators and assistants (according to the National Occupational Classification [NOC]). Another study on child care staff in Canada used the same NOC codes.Note In contrast, the workers included in this fact sheet are limited to those who worked in the child daycare services industry (according to the North American Industry Classification System) at a fixed address in Canada outside Quebec, and who used French most often at work.Note Although these workers are most likely to provide child care in French, there is no guarantee that they will do so. Similarly, workers who used French at least regularly at work could also provide French-language child care. It is also possible that they were working with children younger or older than 1 to 4 years of age. This fact sheet therefore focuses on the potential supply of French-language child care services rather than on the actual supply.
Finally, in order to assess the alignment between potential supply of and demand for French-language early childhood care services, this study proposes ratios of the number of French-speaking children to child care workers for different geographical areas.Note
| Provinces or territories | 2001 | 2016 | ||||
|---|---|---|---|---|---|---|
| Children aged 1 to 4 | Children aged 1 to 4 | |||||
| Total | With at least one parent who spoke French most often at home | Total | With at least one parent who spoke French most often at home | |||
| Number | Percentage | Number | Percentage | |||
| Total: Canada outside Quebec | 1,061,600 | 29,795 | 2.8 | 1,148,210 | 33,735 | 2.9 |
| Newfoundland and Labrador | 20,030 | 75 | 0.4 | 17,855 | 130 | 0.7 |
| Prince Edward Island | 6,200 | 165 | 2.7 | 5,600 | 135 | 2.4 |
| Nova Scotia | 38,480 | 955 | 2.5 | 33,600 | 750 | 2.2 |
| New Brunswick | 30,470 | 8,630 | 28.3 | 27,520 | 7,555 | 27.4 |
| Ontario | 541,865 | 16,265 | 3.0 | 555,305 | 18,355 | 3.3 |
| Manitoba | 55,675 | 925 | 1.7 | 62,065 | 1,345 | 2.2 |
| Saskatchewan | 48,485 | 290 | 0.6 | 56,335 | 410 | 0.7 |
| Alberta | 148,090 | 1,440 | 1.0 | 207,985 | 3,060 | 1.5 |
| British Columbia | 165,825 | 980 | 0.6 | 174,500 | 1,775 | 1.0 |
| Territories | 6,490 | 80 | 1.2 | 7,450 | 225 | 3.0 |
| Sources: Statistics Canada, 2001 and 2016 censuses of population. | ||||||
In 2016, close to 1,150,000 children aged 1 to 4 lived with at least one parent in a census family in Canada outside of Quebec. Among them, 33,735 (2.9%) had at least one parent who spoke French most often at home. This proportion was relatively stable compared to 2001 (2.8%).
The numbers and proportions of French-speaking children increased in Ontario and the western provinces from 2001 to 2016. In Alberta, the number of children with a parent who spoke French most often at home more than doubled during this period. However, the numbers and proportions of French-speaking children decreased from 2001 to 2016 in the Atlantic provinces, except for Newfoundland and Labrador.
| Provinces or territories | 2001 | 2016 | ||||
|---|---|---|---|---|---|---|
| Child care workers | Child care workers | |||||
| Total | Who used French most often at work | Total | Who used French most often at work | |||
| Number | Percentage | Number | Percentage | |||
| Total : Canada outside Quebec | 127,195 | 3,925 | 3.1 | 137,900 | 6,310 | 4.6 |
| Newfoundland and Labrador | 1,935 | 15 | 0.7 | 2,645 | 30 | 1.1 |
| Prince Edward Island | 790 | 25 | 3.0 | 940 | 30 | 3.4 |
| Nova Scotia | 4,350 | 85 | 2.0 | 4,840 | 150 | 3.1 |
| New Brunswick | 3,695 | 975 | 26.4 | 4,655 | 1,625 | 35.0 |
| Ontario | 61,620 | 2,335 | 3.8 | 66,130 | 3,545 | 5.4 |
| Manitoba | 7,630 | 230 | 3.0 | 8,880 | 290 | 3.3 |
| Saskatchewan | 5,875 | 45 | 0.8 | 6,965 | 105 | 1.5 |
| Alberta | 17,620 | 120 | 0.7 | 21,525 | 295 | 1.4 |
| British Columbia | 22,755 | 70 | 0.3 | 20,500 | 190 | 0.9 |
| Territories | 930 | 25 | 2.1 | 810 | 30 | 4.5 |
| Sources: Statistics Canada, 2001 and 2016 censuses of population. | ||||||
In 2016, there were nearly 138,000 child care workers in Canada outside of Quebec. Among them, 6,310 (4.6%) used French most often at work. This proportion was lower in 2001 (3.1%). From 2001 to 2016, the numbers and proportions of child care workers who used French most often at work increased in each province and territory. In New Brunswick, this proportion increased from 26.4% in 2001 to 35.0% in 2016.
Data table for Chart 1
| Provinces | Number of French-speaking children per child care worker using French most often at work | |
|---|---|---|
| Ratio | ||
| 2001 | 2016 | |
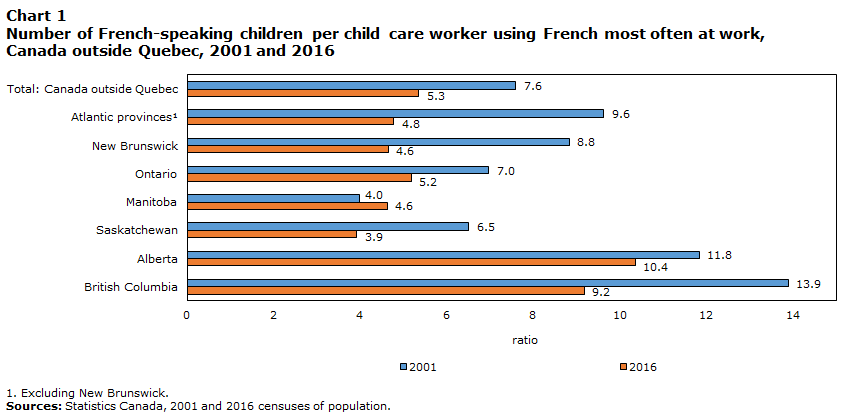
| Total: Canada outside Quebec | 7.6 | 5.3 |
| Atlantic provincesData table for Chart 1 Note 1 | 9.6 | 4.8 |
| New Brunswick | 8.8 | 4.6 |
| Ontario | 7.0 | 5.2 |
| Manitoba | 4.0 | 4.6 |
| Saskatchewan | 6.5 | 3.9 |
| Alberta | 11.8 | 10.4 |
| British Columbia | 13.9 | 9.2 |
|
||
Chart 1 shows that the ratios of French-speaking children to child care worker decreased in every province from 2001 to 2016, except Manitoba. In 2016, the ratios ranged from 3.9 to 10.4 French-speaking children for every child care worker. The ratio decreased by nearly half from 2001 to 2016 in New Brunswick (from 8.8 to 4.6 French-speaking children per child care worker) and elsewhere in the Atlantic provinces (from 9.6 to 4.8 French-speaking children per child care worker). During the period studied, the number of French-speaking children decreased in the Atlantic provinces (with the exception of Newfoundland and Labrador), while the number of child care workers increased.
Although the ratio of French-speaking children to worker decreased over the study period in Alberta (11.8 children per worker in 2001 and 10.4 in 2016) and British Columbia (13.9 children per worker in 2001 and 9.2 in 2016), it was still about twice as high as the ratio in Ontario in 2016 (7.0 children per worker in 2001 and 5.2 in 2016). For context, according to the different provincial legislations, current regulations for child-to-worker ratios vary from 3 children to 10 children per worker, depending on the age of the children. Accordingly, for all provinces except Alberta and British Columbia, the ratios were near the middle of this range.
The decline in ratios fuelled by the growth in the number of child care workers using French at work is a sign of the growing availability of French-language child care services across the country during the period under study, despite higher ratios in Alberta and British Columbia. In addition, with the exception of these two provinces, the ratios of French-speaking children to child care worker were lower in 2016 than the total ratios of children per worker, regardless of language (5.9 children per worker in New Brunswick, 7.0 in Manitoba, 8.1 in Saskatchewan and 8.4 in Ontario). Therefore, the availability of early childhood care services for French-speaking children seemed somewhat better than for the general population. It was the opposite in Alberta and British Columbia, where the total child-to-worker ratios (9.7 and 8.5, respectively) were lower than those for French-speaking children.
Data table for Chart 2
| Census metropolitan areas (CMAs) or census agglomerations (CAs) | Number of French-speaking children per child care worker using French most often at work |
|---|---|
| Ratio | |
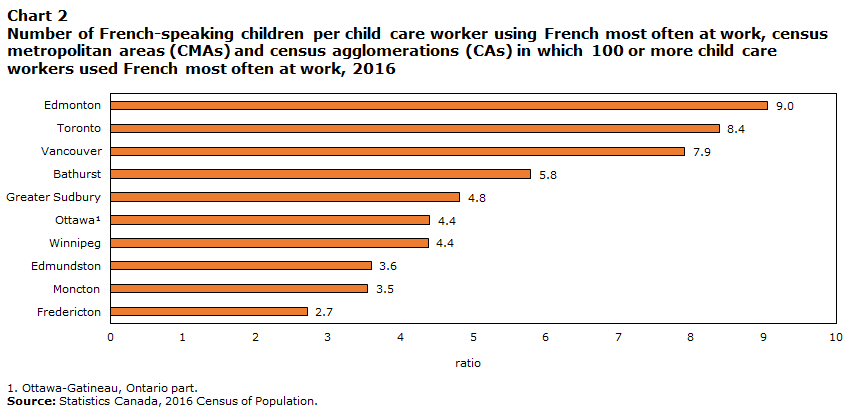
| Edmonton | 9.0 |
| Toronto | 8.4 |
| Vancouver | 7.9 |
| Bathurst | 5.8 |
| Greater Sudbury | 4.8 |
| OttawaData table for Chart 2 Note 1 | 4.4 |
| Winnipeg | 4.4 |
| Edmundston | 3.6 |
| Moncton | 3.5 |
| Fredericton | 2.7 |
|
|
Chart 2 shows that the ratios were below 5 French-speaking children per child care worker in the census metropolitan areas (CMAs) or census agglomerations (CAs) of Greater Sudbury (4.8), Ottawa (4.4),Note Winnipeg (4.4), Edmundston (3.6), Moncton (3.5) and Fredericton (2.7). The highest ratios were observed in the following CMAs: Edmonton (9.0), Toronto (8.4) and Vancouver (7.9). These three CMAs all had small proportions of French-speaking children (Edmonton: 2.0%, Toronto: 1.5% and Vancouver: 1.0%). With the exception of Bathurst (5.8), the CAs and CMAs in New Brunswick had the lowest ratios. This province also had the highest numbers and proportions of French-speaking children and child care workers who used French most often at work. There could therefore be a link between the proportion of the population that is French-speaking, the geographic dispersion of that population and the balance between the potential supply of and demand for child care services in that language.
Many other children were likely to attend French-language child care, especially those with at least one parent who spoke French at home at least regularly.Note Similarly, workers who used French at work at least regularlyNote were also likely to provide child care in French. In 2016, 68,060 children aged 1 to 4 (5.9%) had at least one parent who spoke French at home at least regularly in Canada outside Quebec. Moreover, 8,785 (6.4%) child care workers used French at work at least regularly. For context, the child-to-worker ratios calculated from these numbers are generally higher than those presented above. Insights may therefore vary depending on the criteria used.
For all the ratios presented, the geography used is relatively broad. However, parents indicated that proximity to child care is among the main reasons they choose a child care facility.Note Thus, even if the children-to-worker ratios are low, this does not necessarily mean that services are available locally. Regulations also vary according to the age of each child and by province. A more detailed study could be used to assess the extent to which the supply of services meets the demand for each age group and family composition, at a more local level.
This fact sheet showed that the ratios of children likely to attend French-language child care to each child care worker who used French most often at work decreased from 2001 to 2016 in Canada outside of Quebec, except for Manitoba. The availability of French-language child care services thus seems to have improved over the period under study. Nevertheless, the ratios of French-speaking children per child care worker remained higher in Alberta and British Columbia, as well as in some CMAs and CAs where a small proportion of the population is French-speaking.
Once available, information from the 2022 Survey on the Official Language Minority Population will make it possible to conduct a more in-depth study on the subject, particularly through new questions on early childhood.
- Date modified: