
Insights on Canadian Society
Child care workers in Canada
by Sharanjit Uppal and Katherine Savage

Skip to text
Text begins
Start of text box
This study uses data from the Census of Population and the Labour Force Survey to examine the personal and job characteristics of child care workers and how some of these characteristics have changed over time. It also studies the changes in employment among child care workers since the start of the COVID-19 pandemic.
- Based on data from the Labour Force Survey, in 2019, there were nearly 302,000 individuals employed as child care workers across Canada, making up 1.6% of the total employed population.
- According to the 2016 Census of Population, approximately one-third of child care workers are immigrants or non-permanent residents, while they represent one-quarter of workers in all other occupations.
- The self-employment rate among child care workers is higher than the rate for all other workersNote in Canada, though it has been declining over time. In 2019, 25% of child care workers were self-employed, down from 59% in 1987. By comparison, 15% of all other workers were self-employed in 2019.
- Paralleling the rise in dual-earner families over time and the demand for child care services, the proportion of child care workers working full time has been increasing over time. In 1987, 57% of them worked 30 hours or more per week. This proportion had increased to 76% by 2019.
- Since the start of the COVID-19 pandemic, employment among child care workers has fluctuated more, compared with employment in Canada as a whole. In February 2021, a year after the pandemic hit Canada, employment among child care workers was 21% below that in February 2020. In comparison, total employment in Canada decreased by 3% over the same period.
End of text box
Introduction
Women’s labour force participation in Canada has been increasing over the past few decades, leading to an increase in the proportion of dual-earner families.Note At the same time, the proportion of lone-parent families has also been increasing.Note The increase in lone-parent and dual-earner families with children has had a number of effects, one of which is a greater demand for child care services. For example, between October 2018 and January 2019, about 60% of children aged 5 and younger participated in some form of child care.Note This was a notable increase from 42% in 1994 to 1995.Note However, child care is still unaffordable for many Canadian families.Note The availability of affordable daycare facilities may further increase female labour force participation.Note Also, access to high-quality child care has been shown to be important to early childhood development and the future academic success of children.Note To increase the use and the accessibility of child care services, the Canadian federal government, in its 2021 budget, allocated $30 billion over five years toward a new Canada-wide early learning and child care plan.
Over the years, much discussion has been focused on the availability and adequacy of child care services, but less so on child care workers themselves. These workers play a key role in providing child care services and are an integral element of the child care ecosystem and landscape. The focus of this article is on child care workers; it summarizes their personal and employment characteristics and shows how these have changed over time. This is crucial to further understand who makes up the occupational groups that play an important role in children’s development and how these workers have evolved in comparison with other workers over time.
This article also looks at the effect of the COVID-19 pandemic on the employment of child care workers. The pandemic led to the closure of schools and child care centres starting in mid-March 2020, and, in most parts of Canada, school closures remained in effect until the end of the school year. However, many child care centres started reopening in May, and all schools reopened in September 2020. The closure of schools and child care centres and their subsequent reopening is likely to disproportionately affect the employment of child care workers. This article presents monthly changes in employment since the start of the COVID-19 pandemic and draws comparisons with 2019.
There are many different types of workers within the broader group of child care workers. For example, there are child care workers who work in schools and in licensed centres, licensed and unlicensed home care providers working in their own home, child care providers providing care for children in the child’s home (i.e. nannies), relatives providing care for a related child, and other child care workers such as those providing drop-in child care services in commercial establishments. Existing research on child care workers follows different approaches to classify them based on the availability of data for various subgroups. Some studies have grouped child care workers based on their place of work—at home or elsewhere—while others have looked at industry and whether they are employees or self-employed.Note Note Note In the absence of information available on licensing, type of establishment as well as the age of children in care, this study uses the 2016 National Occupational Classification (NOC) to look at two broad groups of child care workers: (1) early childhood educators and assistants (NOC 4214) and (2) home child care providers (NOC 4411) (see box “Data sources, methods and definitions” for the detailed classification). Wherever possible, results for each of the two groups are presented separately.Note
This study uses data from the Census of Population and the Labour Force Survey (LFS) to examine the personal and job characteristics of child care workers and how some of these characteristics have changed over time (see box “Data sources, methods and definitions”). It also studies the changes in employment among child care workers since the start of the COVID-19 pandemic.
Census data are used to provide a portrait of the personal characteristics of child care workers. An advantage of using census data is that a detailed analysis can be conducted using disaggregated data. For example, the two occupational categories of child care workers can be analyzed separately. Moreover, detailed statistics can be provided by province.
Data from the LFS are used to summarize job characteristics of child care workers. The LFS contains detailed labour market information, such as job permanency, tenure, union status and hourly earnings. Wherever census data are used, some comparisons are made between 1991 and 2016. LFS data are annual from 1987 to 2019. However, monthly data from 2019, 2020 and 2021 are used to study the impact of COVID-19. The first section of the article presents personal characteristics of child care workers. Job characteristics are presented in the second section. The last section focuses on the effect of the pandemic on child care workers’ employment.
In 2016, Quebec had the highest proportion of child care workers relative to its employed population
According to the 2016 Census of Population, nearly 280,000 individuals were employed as child care workers in Canada.Note They consisted of 194,000 (or 69%) early childhood educators and assistants and 86,000 (or 31%) home child care providers. Together, child care workers represented 1.6% of the entire labour force.
| Canada, province or territory | Early childhood educators and assistants | Home child care providers | Total, child care workers | All other workers |
|---|---|---|---|---|
| percent | ||||
| Canada | 100 | 100 | 100 | 100 |
| Newfoundland and Labrador | 0.7 | 1.5 | 1.0 | 1.3 |
| Prince Edward Island | 0.3 | 0.3 | 0.3 | 0.4 |
| Nova Scotia | 1.6 | 2.4 | 1.9 | 2.5 |
| New Brunswick | 1.7 | 1.9 | 1.8 | 2.0 |
| Quebec | 43.1 | 11.2 | 33.3 | 22.8 |
| Ontario | 31.5 | 42.2 | 34.8 | 38.4 |
| Manitoba | 3.5 | 4.0 | 3.6 | 3.6 |
| Saskatchewan | 2.1 | 4.1 | 2.7 | 3.2 |
| Alberta | 6.7 | 17.5 | 10.0 | 12.2 |
| British Columbia | 8.5 | 14.5 | 10.3 | 13.4 |
| Yukon, Northwest Territories and Nunavut | 0.3 | 0.3 | 0.3 | 0.3 |
| Source: Statistics Canada, Census of Population, 2016. | ||||
Ontario (35%) and Quebec (33%) accounted for the largest shares of child care workers, given their larger shares of the total employed population (Table 1). However, Quebec (2.4%) had the highest ratio of child care workers to the total employed population among all provinces and territories (Chart 1). Nova Scotia and Newfoundland and Labrador (1.2% each) had the lowest proportion. Quebec’s partially subsidized child care program differs from other provinces, and, as a result, a greater proportion of parents use child care services in this province.Note Although Quebec still has the lowest child care costs in Canada, there are other provinces, including Manitoba, Prince Edward Island, and Newfoundland and Labrador, where more than half of child care centres are funded with set parent fees.Note
Among child care workers, early childhood educators and assistants were more likely to be working in Quebec (43%), though Ontario (42%) had proportionally more home child care providers.

Data table for Chart 1
| Canada, province or territory | Early childhood educators and assistants | Home child care providers |
|---|---|---|
| percent | ||
| Canada | 1.1 | 0.5 |
| Newfoundland and Labrador | 0.6 | 0.6 |
| Prince Edward Island | 0.9 | 0.4 |
| Nova Scotia | 0.7 | 0.5 |
| New Brunswick | 1.0 | 0.5 |
| Quebec | 2.1 | 0.2 |
| Ontario | 0.9 | 0.5 |
| Manitoba | 1.1 | 0.7 |
| Saskatchewan | 0.8 | 0.7 |
| Alberta | 0.6 | 0.7 |
| British Columbia | 0.7 | 0.5 |
| Yukon, Northwest Territories and Nunavut | 1.1 | 0.5 |
| Source: Statistics Canada, Census of Population, 2016. | ||
More than 95% of child care workers are women
In 2016, both early childhood educators and assistants, and home child care providers were among the top five of all occupations with the highest proportion of women, each at 96% (Table 2). The other three in the top five occupations held predominantly by women were dental assistants (99%), medical administrative assistants (97%), and dental hygienists and dental therapists (97%). The high proportion of women child care workers has changed little since 1991, when 96% of early childhood educators and assistants and 97% of home child care providers were women.
Child care workers are more likely to be younger than all other workers. In 2016, 64% were 15 to 44 years of age. By comparison, 55% of workers in all other occupations were in the same age group; however, the effect of the aging of the population is apparent, as it is with almost every other occupational group. In 1991, 81% of child care workers were aged 15 to 44.
| Characteristic | Early childhood educators and assistants | Home child care providers | Total, child care workers | All other workers |
|---|---|---|---|---|
| Sex | percent | |||
| Women | 96.4 | 96.0 | 96.3 | 47.4 |
| Men | 3.6 | 4.0 | 3.7 | 52.6 |
| Age | years | |||
| Median age | 39.4 | 41.0 | 39.9 | 42.7 |
| Age group | percent | |||
| 15 to 24 years | 12.3 | 11.9 | 12.2 | 12.7 |
| 25 to 34 years | 25.7 | 21.4 | 24.4 | 20.9 |
| 35 to 44 years | 27.3 | 26.3 | 27.0 | 21.3 |
| 45 to 54 years | 21.9 | 20.1 | 21.3 | 23.4 |
| 55 to 64 years | 11.3 | 15.2 | 12.5 | 17.2 |
| 65 years and older | 1.6 | 5.1 | 2.7 | 4.5 |
| Highest certificate, diploma or degree | ||||
| No certificate, diploma or degree | 5.4 | 13.8 | 8.0 | 10.1 |
| Secondary (high) school diploma or equivalency certificate | 15.6 | 33.2 | 21.0 | 25.4 |
| Apprenticeship or trades certificate or diploma | 7.7 | 5.7 | 7.1 | 10.6 |
| College, CEGEP or other non-university certificate or diploma | 47.3 | 23.4 | 40.0 | 22.2 |
| University certificate or diploma below bachelor level | 5.0 | 4.2 | 4.7 | 3.0 |
| University certificate, diploma or degree at bachelor level or above | 19.0 | 19.7 | 19.2 | 28.7 |
| Immigrant status | ||||
| Non-immigrant | 72.4 | 55.9 | 67.3 | 74.9 |
| Immigrant | 26.6 | 33.4 | 28.7 | 23.8 |
| Non-permanent resident | 1.0 | 10.7 | 4.0 | 1.3 |
| Presence of children | ||||
| No children | 41.3 | 52.9 | 44.9 | 56.6 |
| Youngest child is younger than 2 years | 7.0 | 5.1 | 6.4 | 5.5 |
| Youngest child is 2 to 5 years | 12.5 | 10.6 | 11.9 | 8.0 |
| Youngest child is 6 to 14 years | 21.6 | 16.1 | 19.9 | 13.9 |
| Youngest child is 15 to 24 years | 14.6 | 11.2 | 13.6 | 12.5 |
| Youngest child is 25 years or older | 2.9 | 3.9 | 3.3 | 3.4 |
| Visible minority | ||||
| Total visible minority population | 23.7 | 39.0 | 28.4 | 21.2 |
| South Asian | 5.2 | 4.9 | 5.1 | 5.4 |
| Chinese | 2.4 | 2.9 | 2.5 | 4.3 |
| Black | 4.8 | 3.1 | 4.3 | 3.1 |
| Filipino | 2.1 | 21.1 | 7.9 | 2.6 |
| Latin American | 2.5 | 2.2 | 2.4 | 1.4 |
| Arab | 3.7 | 1.2 | 2.9 | 1.1 |
| Southeast Asian | 0.4 | 1.3 | 0.7 | 0.9 |
| West Asian | 1.0 | 0.7 | 0.9 | 0.7 |
| Korean | 0.7 | 0.2 | 0.5 | 0.5 |
| Japanese | 0.2 | 0.3 | 0.2 | 0.3 |
| Visible minority, n.i.e.Table 2 Note 1 | 0.5 | 0.4 | 0.4 | 0.4 |
| Multiple visible minorities | 0.4 | 0.7 | 0.5 | 0.6 |
| Not a visible minority | 76.3 | 61.0 | 71.6 | 78.8 |
|
||||
The majority of child care workers have a postsecondary education
More than 7 in 10 (71%) child care workers had a postsecondary education in 2016. However, there were differences among the two groups of child care workers. Early childhood educators and assistants were more likely to have an education level above a high school diploma (79%), compared with home child care providers (53%). The proportion of child care workers with a postsecondary education increased notably between 1991 and 2016 (from 41% to 71%).
Educational requirements to work as a child care worker have changed in recent decades. While there may not be any postsecondary level of education requirements for home child care providers, educational requirements to work in regulated daycares vary by province. For example, in Ontario child care centres, one-third of the staff with an infant group or a toddler group must have a two year early childhood education (ECE) diploma and two-thirds of staff with a preschool-age group must have a two year ECE diploma.Note In Quebec, the requirement is for two-thirds of staff working directly with children to have a three-year Diplôme d’études collégiales (DEC) or a one-year Attestation d’études collégiales (AEC), along with three years of experience. Similarly, other provinces have their own requirements, usually at or below this level.Note
In 2016, 77% of early childhood educators and assistants in Quebec had a postsecondary education, compared with 84% in Ontario. The province with the highest proportion of early childhood educators and assistants with a postsecondary education was Prince Edward Island, at 86%.
In 2016, nearly one-third of child care workers were immigrants or non-permanent residents
In 2016, 33% of child care workers were immigrants or non-permanent residents, compared with 25% among all other occupations.Note The proportion of immigrants and non-permanent residents among child care workers increased over the years, from 18% in 1991 to 33% in 2016. During the same time period, this proportion rose from 19% to 25% among all other occupations.Note
There are differences among the two groups of child care workers regarding immigrant status. In 2016, home child care providers were 10 times more likely to be non-permanent residents, compared with early childhood educators and assistants (11% vs. 1%). They were also more likely to be immigrants (33% vs. 27%).
Since 1991, the proportion of early childhood educators and assistants who were immigrants has increased from 19% to 27%. Over the same period, the proportion of immigrant home child care providers increased somewhat more—from 17% to 33%. However, the proportion of home child care providers who were non-permanent residents decreased over this period (15% to 11%).
Child care workers were also more likely than workers in all other occupations to belong to a group designated as a visible minority. Specifically, 39% of home child care providers belonged to a population group designated as a visible minority. By comparison, 24% of early childhood educators and assistants and 21% of all other workers belonged to a visible minority group.
Filipino workers were particularly overrepresented among home child care providers: 21% of all workers in these occupations in Canada were Filipino (compared with 3% in all other occupations).
In 2019, 25% of child care workers were self-employed, down from 60% in 1987
In the following section, data from the LFS are used. The definition of child care workers is the same as the one used in the census. However, given a smaller sample size, the two groups of workers could not be studied separately. An advantage of the LFS is the availability of annual data, which makes it possible to study trends over time.
LFS data show that child care workers are more likely to be self-employed than workers in all other occupations. In 2019, 25% were self-employed, compared with 15% among all other occupations (Chart 2). While the self-employment rate among child care workers remained relatively stable from the mid-1980s to the end of the 1990s, it has declined significantly since then. Specifically, the proportion of all child care workers who were self-employed decreased from 60% in 1997 to 25% in 2019. By contrast, the self-employment rate among all other occupations increased marginally over the same time period.

Data table for Chart 2
| Year | Child care workers | All other workers |
|---|---|---|
| percent | ||
| 1987 | 59.4 | 12.5 |
| 1988 | 59.5 | 12.8 |
| 1989 | 58.0 | 12.9 |
| 1990 | 57.2 | 13.0 |
| 1991 | 53.2 | 13.7 |
| 1992 | 58.5 | 14.1 |
| 1993 | 57.3 | 14.5 |
| 1994 | 56.7 | 14.6 |
| 1995 | 54.8 | 14.6 |
| 1996 | 54.4 | 15.2 |
| 1997 | 59.5 | 16.1 |
| 1998 | 58.8 | 16.2 |
| 1999 | 55.7 | 16.0 |
| 2000 | 53.9 | 15.5 |
| 2001 | 45.2 | 14.7 |
| 2002 | 48.3 | 14.4 |
| 2003 | 46.7 | 14.8 |
| 2004 | 44.5 | 14.8 |
| 2005 | 45.4 | 15.1 |
| 2006 | 39.8 | 14.8 |
| 2007 | 38.7 | 14.9 |
| 2008 | 36.6 | 15.0 |
| 2009 | 36.9 | 15.5 |
| 2010 | 34.6 | 15.3 |
| 2011 | 34.3 | 15.0 |
| 2012 | 32.7 | 14.9 |
| 2013 | 33.0 | 15.1 |
| 2014 | 32.4 | 14.8 |
| 2015 | 30.7 | 14.9 |
| 2016 | 28.4 | 15.1 |
| 2017 | 29.8 | 14.9 |
| 2018 | 28.2 | 14.9 |
| 2019 | 25.2 | 15.0 |
| Source: Statistics Canada, Labour Force Survey, 1987 to 2019. | ||
Although the self-employment rate declined among both types of child care workers—early childhood educators and assistants, and home child care providers—a part of this decline may be attributed to the changes in the composition of child care workers. Between the late 1980s and the late 2010s, the proportion of early childhood educators and assistants among child care workers increased. Given that self-employment rates are lower among this group compared with home child care providers, this led to part of the decline in the self-employment rate among child care workers as a whole.Note One of the reasons for the increase in the proportion of early childhood educators and assistants was a policy change related to the subsidized child care program in Quebec in the late 1990s. As a result, numerous organized child care establishments opened, hiring these types of employees.
Various socioeconomic and demographic characteristics are associated with self-employment, and they vary between child care workers and all other occupations. For example, child care workers are, on average, younger and much more likely to be women, compared with all other workers. To estimate what proportion of child care workers would be self-employed if these workers had characteristics similar to those of all other workers, a logistic regression was estimated and the results reported as predicted probabilities. After demographic characteristics were controlled for, child care workers were even more likely to be self-employed, with them being two times more likely to be self-employed (31%) than all other workers (15%) (see table “Regression results for selected labour market outcomes, 2019”).
In 2019, three in four child care workers were working full time and four in five had a permanent job
In 2019, child care workers (76%) were less likely to be working full time, compared with workers from all other occupations (81%) (Chart 3).Note The proportion of full-time workers in Canada has been stable at around 80% over the past three decades. However, the proportion of full-time child care workers has increased. In 1987, 57% of child care workers were employed full time. This proportion stood at 76% in 2019, thus closing the gap with the rest of Canadian workers.

Data table for Chart 3
| Year | Child care workers | All other workers |
|---|---|---|
| percent | ||
| 1987 | 56.5 | 83.4 |
| 1988 | 54.2 | 82.8 |
| 1989 | 56.0 | 83.1 |
| 1990 | 58.4 | 82.8 |
| 1991 | 61.8 | 81.7 |
| 1992 | 59.9 | 81.3 |
| 1993 | 59.7 | 80.9 |
| 1994 | 55.8 | 80.9 |
| 1995 | 61.5 | 81.3 |
| 1996 | 62.1 | 80.8 |
| 1997 | 60.9 | 80.8 |
| 1998 | 59.6 | 81.2 |
| 1999 | 61.6 | 81.6 |
| 2000 | 66.1 | 81.7 |
| 2001 | 70.9 | 81.9 |
| 2002 | 67.8 | 81.0 |
| 2003 | 66.9 | 80.7 |
| 2004 | 69.1 | 81.4 |
| 2005 | 72.8 | 81.3 |
| 2006 | 72.0 | 81.5 |
| 2007 | 75.2 | 81.4 |
| 2008 | 77.7 | 81.0 |
| 2009 | 77.3 | 80.3 |
| 2010 | 74.9 | 80.2 |
| 2011 | 76.5 | 80.6 |
| 2012 | 79.0 | 80.9 |
| 2013 | 76.5 | 80.7 |
| 2014 | 76.0 | 80.4 |
| 2015 | 73.7 | 80.7 |
| 2016 | 71.2 | 80.6 |
| 2017 | 75.5 | 80.6 |
| 2018 | 75.9 | 81.0 |
| 2019 | 76.0 | 80.7 |
| Source: Statistics Canada, Labour Force Survey, 1987 to 2019. | ||
One possible explanation for the lower likelihood of working full time among child care workers compared with all other workers may relate to differing demographic characteristics. In fact, after such characteristics were controlled for, child care workers were slightly more likely to work full time, compared with all other workers. The predicted probability for child care workers to be employed full time was 83%, compared with 81% for all other occupations (see table “Regression results for selected labour market outcomes, 2019”). The difference was because of sex and self-employment. Child care workers were more likely to be women, and women were less likely to work full time. Similarly, they were more likely to be self-employed, a characteristic associated with a lower probability of working full time.
Child care workers who are paid employees were less likely than workers in all other occupations to be members of a union or to be covered by a collective agreement (26% vs. 31% in 2019). They were also less likely to have a permanent job.Note Note In 2019, 82% of child care workers who were employees had a permanent job, compared with 88% among all other occupations (Chart 4).Note This proportion fluctuated slightly for child care workers, while it was relatively stable over time among other workers. Between 1997 and 2019, both groups registered a small decline in permanent positions (about 2 percentage points).
The difference in the probability of having a permanent job among the two groups remained unchanged after controlling for various characteristics in a regression model.

Data table for Chart 4
| Year | Child care workers | All other workers |
|---|---|---|
| percent | ||
| 1997 | 83.5 | 89.4 |
| 1998 | 86.1 | 88.9 |
| 1999 | 84.8 | 88.9 |
| 2000 | 83.8 | 88.2 |
| 2001 | 83.5 | 88.0 |
| 2002 | 83.7 | 87.8 |
| 2003 | 81.3 | 88.4 |
| 2004 | 80.0 | 88.2 |
| 2005 | 81.0 | 87.7 |
| 2006 | 80.8 | 87.7 |
| 2007 | 80.7 | 87.7 |
| 2008 | 84.5 | 88.2 |
| 2009 | 81.9 | 88.2 |
| 2010 | 80.1 | 87.3 |
| 2011 | 78.7 | 87.0 |
| 2012 | 80.1 | 87.2 |
| 2013 | 79.3 | 86.9 |
| 2014 | 78.2 | 87.3 |
| 2015 | 79.8 | 87.2 |
| 2016 | 79.9 | 87.3 |
| 2017 | 80.9 | 87.0 |
| 2018 | 77.3 | 87.3 |
| 2019 | 81.6 | 87.8 |
| Source: Statistics Canada, Labour Force Survey, 1997 to 2019. | ||
Job tenure, defined as the number of consecutive months that a person has worked in their current job, is relatively lower among child care workers than among all other workers, pointing to lower levels of job stability. However, it has been on the rise over time, thereby reducing the gap with other workers. Among child care workers, the average tenure almost doubled from 44 months in 1997 to 84 months in 2019 (Chart 5). Among all other occupations, tenure was relatively stable at around 100 months.

Data table for Chart 5
| Year | Child care workers | All other workers |
|---|---|---|
| number of months | ||
| 1997 | 44.0 | 98.2 |
| 1998 | 48.0 | 98.2 |
| 1999 | 50.5 | 97.7 |
| 2000 | 48.4 | 97.2 |
| 2001 | 56.9 | 96.6 |
| 2002 | 57.7 | 97.8 |
| 2003 | 57.6 | 99.3 |
| 2004 | 56.6 | 99.9 |
| 2005 | 59.4 | 100.1 |
| 2006 | 65.6 | 99.6 |
| 2007 | 66.7 | 98.5 |
| 2008 | 68.2 | 99.1 |
| 2009 | 63.5 | 100.6 |
| 2010 | 70.5 | 103.5 |
| 2011 | 71.3 | 102.6 |
| 2012 | 71.4 | 103.3 |
| 2013 | 75.1 | 104.0 |
| 2014 | 75.5 | 103.7 |
| 2015 | 77.4 | 104.1 |
| 2016 | 77.0 | 104.3 |
| 2017 | 84.6 | 104.3 |
| 2018 | 78.1 | 102.7 |
| 2019 | 83.5 | 101.9 |
| Source: Statistics Canada, Labour Force Survey, 1997 to 2019. | ||
The LFS also collects information on earnings for paid employees—usual hourly and usual weekly earnings.Note Average inflation-adjusted hourly earnings among child care workers have been increasing over time, a trend also experienced by other occupations.
In 2019, on average, child care workers were making $19.97 per hour, compared with $14.73 (2019 constant dollars) per hour in 1997 (Chart 6). Their average hourly earnings, however, were 28% lower than those of workers in all other occupations ($27.91 in 2019), and this gap has persisted over time.Note Some of this difference might be accounted for by differences in demographic and job characteristics of both groups of workers. For example, child care workers were less likely to have a university degree and more likely to be immigrants—attributes associated with lower earnings. As illustrated above, job tenure is, on average, lower among child care workers, as is their likelihood of having a permanent job. Indeed, the regression results show that after certain personal and job characteristics were controlled for, the earnings of child care workers were 15% lower than those of workers in all other occupations (see table “Regression results for selected labour market outcomes, 2019”). This means that almost half of the income gap between child care workers and all other workers can be explained by differences in personal and job characteristics of both groups of workers.

Data table for Chart 6
| Year | Child care workers | All other workers |
|---|---|---|
| constant dollars | ||
| 1997 | 14.7 | 23.6 |
| 1998 | 15.2 | 23.6 |
| 1999 | 15.7 | 23.8 |
| 2000 | 15.2 | 23.9 |
| 2001 | 15.3 | 24.1 |
| 2002 | 15.8 | 24.2 |
| 2003 | 16.2 | 24.1 |
| 2004 | 16.0 | 24.2 |
| 2005 | 16.7 | 24.4 |
| 2006 | 17.6 | 24.7 |
| 2007 | 17.5 | 25.0 |
| 2008 | 17.9 | 25.5 |
| 2009 | 18.5 | 26.3 |
| 2010 | 18.9 | 26.4 |
| 2011 | 18.9 | 26.1 |
| 2012 | 18.4 | 26.5 |
| 2013 | 18.7 | 26.8 |
| 2014 | 19.1 | 26.8 |
| 2015 | 19.9 | 27.2 |
| 2016 | 19.5 | 27.4 |
| 2017 | 19.2 | 27.4 |
| 2018 | 20.2 | 27.5 |
| 2019 | 20.0 | 27.9 |
| Source: Statistics Canada, Labour Force Survey, 1997 to 2019. | ||
While it is insightful to examine hourly earnings, a discussion on annual income is equally important. In the 2016 Census of Population, data on employment income are available for 2015. Census data have the advantage of providing a more detailed profile, given the census’s larger sample size.
In 2015, the averageNote annual employment incomeNote of child care workers ($24,100) was less than half of that of workers in all other occupations ($53,800) (Table 3). Among child care workers, the earnings of home child care providers ($17,300) were notably lower than those of early childhood educators and assistants ($26,800).
| Region | All child care workers | Early childhood educators and assistants | Home child care providers | All other workers | Ratio of average child care employment income to all other occupations |
|---|---|---|---|---|---|
| dollars | percent | ||||
| Canada | 24,100 | 26,800 | 17,300 | 53,800 | 44.8 |
| Atlantic | 19,800 | 23,000 | 13,800 | 47,600 | 41.6 |
| Quebec | 25,400 | 26,200 | 17,900 | 47,100 | 53.9 |
| Ontario | 24,600 | 28,500 | 17,100 | 55,500 | 44.3 |
| Manitoba | 22,900 | 25,500 | 16,500 | 48,900 | 46.8 |
| Saskatchewan | 21,000 | 24,800 | 16,300 | 54,300 | 38.7 |
| Alberta | 23,400 | 27,800 | 19,100 | 67,400 | 34.7 |
| British Columbia | 22,000 | 25,200 | 16,900 | 51,400 | 42.8 |
| Territories | 29,400 | 32,600 | 20,800 | 69,200 | 42.5 |
|
Note: This table includes only those who worked in 2015 with an employment income greater than zero. Source: Statistics Canada, Census of Population, 2016. |
|||||
Among the provinces, child care workers in Quebec had the highest average employment income ($25,400), followed by Ontario ($24,600).Note Child care workers in the Atlantic provinces ($19,800) had the lowest income. When the two child care worker groups were examined separately (not including the territories), the average employment income for early childhood educators and assistants was the highest in Ontario, and highest in Alberta for home child care providers. The gap between the earnings of child care workers and workers in all other occupations was smallest in Quebec and largest in Alberta.
The territories recorded the highest average employment income for child care workers. This was true for both childhood educators and assistants ($32,600) and home child care providers ($20,800).
Employment during the COVID-19 pandemic fluctuated more among child care workers, compared with Canadian workers overall
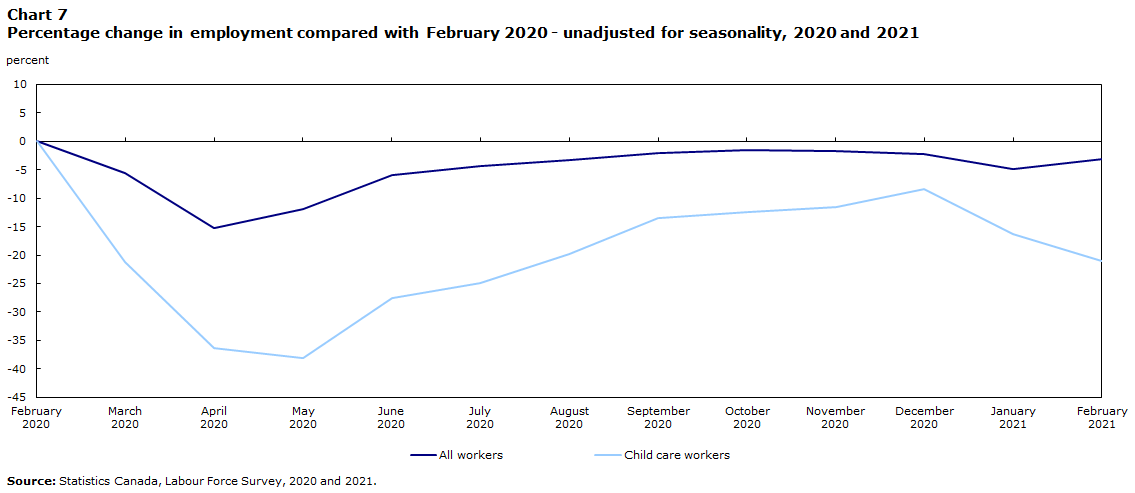
Starting in mid-March 2020, as a result of the pandemic, schools and child care centres were ordered to close by provincial and territorial governments across Canada.Note Meanwhile, governments also intervened to close some non-essential businesses, restrict travel and impose public health measures in an effort to limit public interactions. All these initial measures had an immediate effect on the Canadian labour market. Overall, seasonally unadjusted employment fell by 6% in March compared with February 2020 (Chart 7).Note However, employment decreased more sharply among child care workers (-21%).
Data table for Chart 7
| Month | All workers | Child care workers |
|---|---|---|
| percent | ||
| 2020 | ||
| February | 0.0 | 0.0 |
| March | -5.6 | -21.2 |
| April | -15.3 | -36.4 |
| May | -11.9 | -38.1 |
| June | -5.9 | -27.6 |
| July | -4.3 | -24.9 |
| August | -3.4 | -19.9 |
| September | -2.0 | -13.4 |
| October | -1.6 | -12.4 |
| November | -1.6 | -11.6 |
| December | -2.2 | -8.3 |
| 2021 | ||
| January | -4.8 | -16.3 |
| February | -3.2 | -21.1 |
| Source: Statistics Canada, Labour Force Survey, 2020 and 2021. | ||
The list of non-essential businesses that were required to close was expanded in April in some provinces. This, coupled with stricter public health measures, led to an additional and more severe month-to-month decrease in employment across various sectors of the economy. Employment in Canada decreased in April and once again the decline was more pronounced among child care workers. While overall employment was down by 15% compared with February 2020, the comparable decline among child care workers was 36%.
Around mid-May, some provinces, including British Columbia, Saskatchewan, Manitoba, Quebec and part of Atlantic Canada, started to ease certain restrictions and allowed some non-essential businesses to reopen. Child care centres also started to reopen in some parts of the country. This had a positive effect on overall employment, which rose slightly, though employment among child care workers continued to decline, albeit at a slower pace.
In June, businesses and workplaces continued to reopen across Canada. As a result, employment continued to rebound. A larger number of child care centres across most of the country also started to reopen. This led to strong growth in employment among child care workers. The resumption of economic activities that started in May and June continued in July and August. Also, by mid-August, public health restrictions eased considerably across Canada. Employment rose in both July and August; as in June, employment grew at a faster rate among child care workers. This growth in employment further decreased the gap between child care workers and other workers. In August 2020, overall employment was down by 3% compared with February 2020; among child care workers, it was 20% lower.
In September, schools across the country started to reopen. In some provinces, students were given an option to attend either online or in class. In-class instruction was based on a modified schedule for some grades. For many secondary students, there was a combination of in-school and remote learning, whereas elementary students could return to in-person learning with increased health and safety measures. The reopening of schools had a positive seasonal effect on the employment of child care workers. Employment growth among child care workers was stronger than employment overall. The growth in employment among child care workers continued until the end of the year; in December 2020, employment among child care workers was 8% lower than in February 2020. The comparable decline for Canada as a whole was 2%.
As COVID-19 cases started to increase notably toward the end of 2020, some provinces, including Ontario and Quebec, announced lockdowns starting in late December. By February 2021, employment among child care workers was 21% lower than in February 2020, while for Canada as a whole, it was down by 3%.
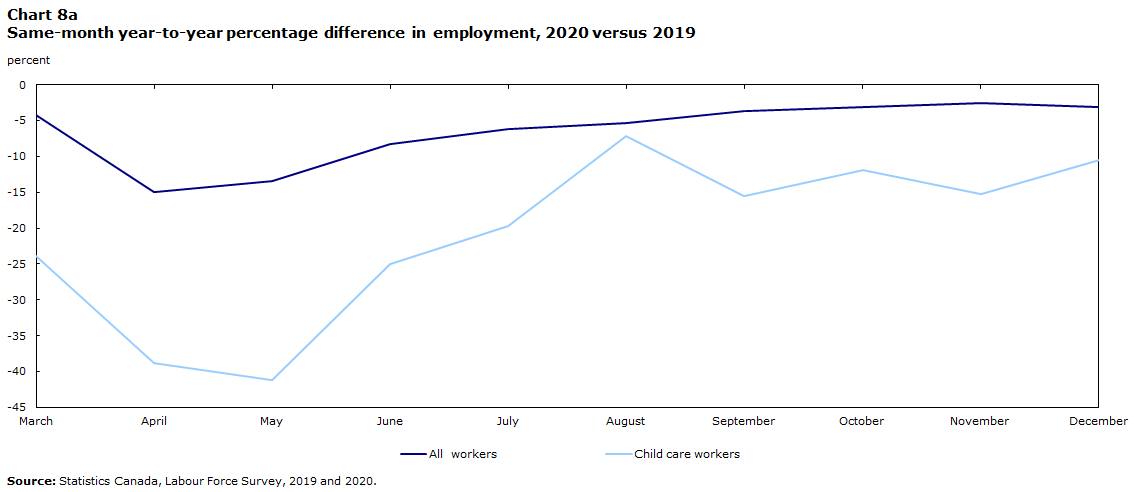
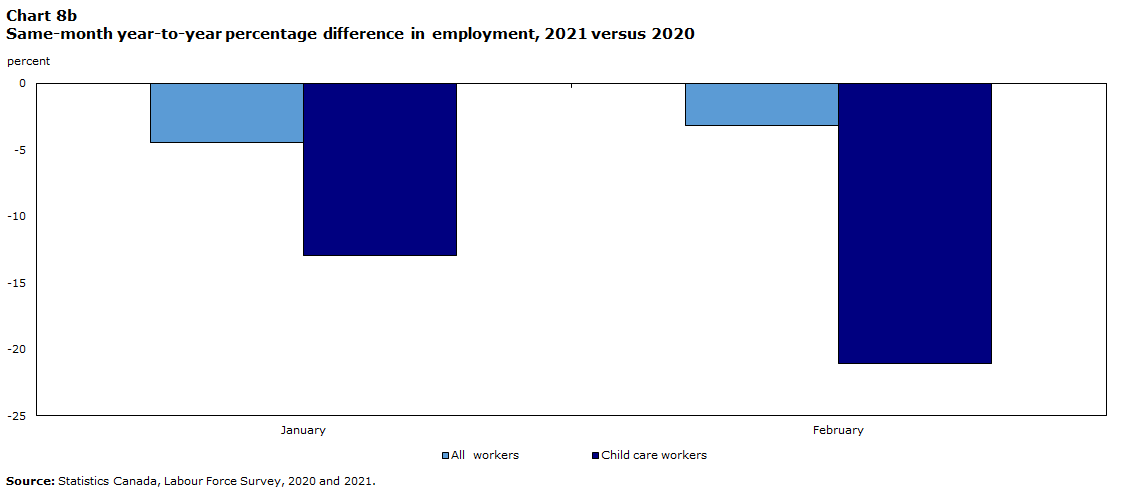
Another way to study employment changes is to compare monthly employment in a given year with that in the same month of the previous year. When month-to-month comparisons with 2019 are examined, overall employment in Canada was lower throughout 2020 (Chart 8a); however, it was much lower among child care workers. Employment in March 2020 among these workers was 24% lower than in the same month in 2019. The difference between comparable months of the two years peaked in May (41%). Starting in June, the gap started to close and by December 2020, it narrowed to 11%. The year-to-year difference increased again in January 2021 (Chart 8b). In February 2021, a year after the pandemic hit Canada, employment among child care workers was 21% below that in February 2020. By comparison, overall employment in Canada decreased by 3% over the same time period.
Data table for Chart 8A
| Month | All workers | Child care workers |
|---|---|---|
| percent | ||
| March | -4.3 | -23.9 |
| April | -15.0 | -38.9 |
| May | -13.4 | -41.1 |
| June | -8.3 | -25.0 |
| July | -6.2 | -19.7 |
| August | -5.4 | -7.2 |
| September | -3.7 | -15.6 |
| October | -3.2 | -11.9 |
| November | -2.6 | -15.3 |
| December | -3.1 | -10.6 |
| Source: Statistics Canada, Labour Force Survey, 2019 and 2020. | ||
Data table for Chart 8B
| Month | All workers | Child care workers |
|---|---|---|
| percent | ||
| January | -4.4 | -13.0 |
| February | -3.2 | -21.1 |
| Source: Statistics Canada, Labour Force Survey, 2020 and 2021. | ||
Conclusion
Given the rise in dual-earner and lone-parent families, demand for child care services has been increasing over the past few decades. In 2019, child care workers accounted for 1.6% of the employed workforce in Canada. Child care workers are predominantly women (96%) and are somewhat younger than the rest of the employed population. About 4 in 10 have a college or non-university diploma. Child care workers are also more likely to be immigrants or non-permanent residents, with one in three belonging to this category.
The self-employment rate among child care workers is higher than that among the rest of the working population. In 2019, one in four was self-employed (25%). However, this rate has been declining—in 1987, around 60% were self-employed. An increase in organized child care establishments is an important factor contributing to this decline. Still, further research is needed to identify additional factors. Similarly to the rest of the employed workforce, the majority of child care workers—almost 8 in 10—worked full time. Most child care workers who were employees (82%) had a permanent job and one in four was a member of a union or covered by a collective agreement.
In 2015, the average employment income of child care workers was about one-half the income reported by the rest of the employed labour force. The biggest gap was in Alberta and the smallest was in Quebec. Among child care workers, the income of early childhood educators and assistants was much higher than that of home child care providers.
As has been the case with the workforce as a whole, employment among child care workers was adversely affected by the COVID-19 pandemic. As schools and child care centres started to close following the implementation of public health measures, employment among child care workers fell by 21% in March 2020. This was followed by a decline of 19% in April. Employment started rebounding in June 2020 because of the easing of restrictions, and this continued until the end of the year. The trend reversed in January 2021 and, by February, employment among child care workers was 21% lower than before the pandemic in February 2020. For Canada as a whole, employment was 3% lower during the same time period. Thus, child care is among the occupations that have been disproportionately affected by the pandemic.
A limitation of this study is that it does not provide results for detailed child care worker groups based on their place of work, industry or class of worker. For job characteristics and employment during the pandemic this was not possible because of a small sample size in the Labour Force Survey. It also could not provide results for child care workers who work in licensed or unlicensed establishments as well as the age of children in child care. With the upcoming 2021 Census of Population, it should be possible to overcome some of these limitations.
Following the investments announced in the 2021 federal budget, the number of child care workers can be expected to grow substantially in the coming years in Canada. As a result, the evolving characteristics of child care workers will remain a topic of great interest.
Sharanjit Uppal is a senior researcher at the Centre for Social Data Insights and Innovation at Statistics Canada. Katherine Savage is an analyst at the Centre for Social Data Insights and Innovation at Statistics Canada.
Start of text box
Two sources of data are used in this study—the 1991 and 2016 censuses of population, and the Labour Force Survey, 1987 to 2019. The data used in the study are restricted to the employed population, 15 years of age and older.
The 2016 National Occupational Classification (NOC) is used to identify child care workers. The following are the definitions for the occupational groups used in this study.Note
Early childhood educators and assistants (NOC code 4214): Early childhood educators plan, organize and implement programs for children between the ages of infancy and 12 years. Early childhood educator assistants provide care for infants and preschool- to school-age children under the guidance of early childhood educators. Early childhood educators and assistants lead children in activities to stimulate and develop their intellectual, physical and emotional growth and ensure their security and well-being. They are employed in child care and daycare centres, kindergartens, agencies for exceptional children, and other settings where early childhood education services are provided. They can also be self-employed. Supervisors of early childhood educators and assistants are also included in this group.Note
Home child care providers (NOC code 4411): These workers care for children on an ongoing or short-term basis. They care for the well-being and physical and social development of children, assist parents with child care, and may also assist with household duties. They provide care in their own homes or in the home of the child, where they may also reside. They are employed by private households and child care agencies, or they may be self-employed.Note
All other occupations (all NOC codes other than 4214 and 4411): These are all workers other than early childhood educators and assistants and home child care providers.
End of text box
Start of text box
| Characteristic | Self-employed | Full-time work | Permanent job | Hourly earnings |
|---|---|---|---|---|
| predicted probabilities | percentage difference from reference category | |||
| Child care workers | 31.4Note * | 82.7Note * | 82.1Note * | -15.2Note * |
| All other workers (ref.) | 14.9 | 80.6 | 87.7 | Note ...: not applicable |
| Sex | ||||
| Male | 18.1Note * | 87.3Note * | 88.6Note * | 16.6Note * |
| Female (ref.) | 11.9 | 72.7 | 86.5 | Note ...: not applicable |
| Age | ||||
| 15 to 24 | 3.8Note * | 53.9Note * | 75.5Note * | -20.6Note * |
| 25 to 34 | 10.4Note * | 87.3Note * | 88.4Note * | -5.2Note * |
| 35 to 44 (ref.) | 14.1 | 88.3 | 91.4 | Note ...: not applicable |
| 45 to 54 | 17.0Note * | 87.8 | 92.2Note * | -0.8 |
| 55 to 64 | 20.7Note * | 82.3Note * | 90.4Note * | -6.1Note * |
| 65 and older | 38.6Note * | 57.8Note * | 76.8Note * | -16.7Note * |
| Highest level of education | ||||
| Less than high school diploma (ref.) | 15.8 | 71.3 | 84.9 | Note ...: not applicable |
| High school diploma | 15.1 | 78.1Note * | 88.4Note * | 9.3Note * |
| Postsecondary diploma or trades | 13.9Note * | 82.4Note * | 89.1Note * | 24.9Note * |
| University degree | 16.4 | 83.5Note * | 85.9 | 59.3Note * |
| Marital status | ||||
| Married (ref.) | 16.2 | 81.3 | 89.1 | Note ...: not applicable |
| Common-law | 14.4Note * | 85.2Note * | 88.5 | -0.5 |
| Widow or widower | 13.7Note * | 79.2 | 88.5 | -8.3Note * |
| Separated | 14.4Note * | 83.3Note * | 89.0 | -2.0Note * |
| Divorced | 14.7Note * | 83.5Note * | 89.4 | -1.6 |
| Single, never married | 12.9Note * | 77.2Note * | 85.5Note * | -7.4Note * |
| Presence of children | ||||
| No children or all children older than 24 years of age (ref.) | 14.7 | 81.0 | 87.5 | Note ...: not applicable |
| Age of youngest child 0 to 4 years | 16.4Note * | 78.2Note * | 88.2 | 3.3Note * |
| Age of youngest child 5 to 9 years | 16.6Note * | 77.3Note * | 86.6 | 3.7Note * |
| Age of youngest child 10 to 14 years | 16.2Note * | 79.0Note * | 86.5 | 2.8Note * |
| Age of youngest child 15 to 24 years | 14.6 | 82.2Note * | 88.8Note * | 1.8Note * |
| Immigrant status | ||||
| Canadian born (ref.) | 15.1 | 80.7 | 88.2 | Note ...: not applicable |
| Immigrant | 15.5 | 80.8 | 86.5Note * | -12.9Note * |
| Other | 12.1Note * | 77.4Note * | 80.3Note * | -14.4Note * |
| Class of worker | ||||
| Employee (ref.) | Note ...: not applicable | 82.2 | Note ...: not applicable | Note ...: not applicable |
| Self-employed | Note ...: not applicable | 71.1Note * | Note ...: not applicable | Note ...: not applicable |
| Temporary/permanent job | ||||
| Temporary (ref.) | Note ...: not applicable | Note ...: not applicable | Note ...: not applicable | Note ...: not applicable |
| Permanent | Note ...: not applicable | Note ...: not applicable | Note ...: not applicable | 5.6Note * |
| Member of a union or covered by collective agreement | ||||
| Yes | Note ...: not applicable | Note ...: not applicable | Note ...: not applicable | 12.1Note * |
| No (ref.) | Note ...: not applicable | Note ...: not applicable | Note ...: not applicable | Note ...: not applicable |
| Job tenure (months) in current job | ||||
| Less than 12 (ref.) | Note ...: not applicable | Note ...: not applicable | Note ...: not applicable | Note ...: not applicable |
| 12 to 59 | Note ...: not applicable | Note ...: not applicable | Note ...: not applicable | 4.2Note * |
| 60 to 119 | Note ...: not applicable | Note ...: not applicable | Note ...: not applicable | 14.1Note * |
| 120 to 179 | Note ...: not applicable | Note ...: not applicable | Note ...: not applicable | 21.3Note * |
| 180 to 239 | Note ...: not applicable | Note ...: not applicable | Note ...: not applicable | 24.9Note * |
| 240 to 299 | Note ...: not applicable | Note ...: not applicable | Note ...: not applicable | 29.2Note * |
| 300 and above | Note ...: not applicable | Note ...: not applicable | Note ...: not applicable | 34.3Note * |
| Province of residence | ||||
| Newfoundland and Labrador | 8.1Note * | 82.8Note * | 73.4Note * | -9.4Note * |
| Prince Edward Island | 13.5Note * | 85.3Note * | 81.2Note * | -17.7Note * |
| Nova Scotia | 12.1Note * | 81.3 | 84.9Note * | -16.8Note * |
| New Brunswick | 10.4Note * | 83.6Note * | 83.5Note * | -16.9Note * |
| Quebec | 13.6Note * | 79.5Note * | 86.9Note * | -7.3Note * |
| Ontario (ref.) | 15.7Note * | 81.1 | 88.5 | Note ...: not applicable |
| Manitoba | 13.4Note * | 81.2 | 89.0 | -9.7Note * |
| Saskatchewan | 16.7 | 82.0 | 87.3Note * | -2.2Note * |
| Alberta | 15.2 | 81.5 | 87.9 | 11.9Note * |
| British Columbia | 17.7Note * | 78.9Note * | 88.0 | 1.2Note * |
... not applicable
|
||||
End of text box
- Date modified: