
Ethnicity, Language and Immigration Thematic Series
Portrait of English-speaking workers in Quebec’s agriculture and agri-food industries, 2006 and 2016
Skip to text
Text begins
Highlights
- In 2016, Quebec had 28,920 farms. Of these, 1,790 (6.2%) had an English-speaking main operator.
- The proportion of farms raising livestock (particularly cattle), reporting low gross farm receipts and covering a large farm area was higher in 2016 for farms with an English-speaking main operator than for farms with a French-speaking main operator.
- In 2016, 4,525 English speakers aged 15 or older were working in Quebec’s agriculture industry, representing 6.3% of the province’s agricultural workers. Their numbers were relatively stable between 2006 and 2016.
- In Quebec, the number of English-speaking agri-food workers aged 15 or older increased sharply between 2006 and 2016, from 63,915 to 81,405. The proportion of English-speaking workers in the province’s agri-food sector rose from 12.9% in 2006 to 14.7% in 2016.
- In 2016, the census agricultural region with the most English-speaking agricultural workers was Montérégie (1,650), and more than two-thirds of English-speaking agri-food workers lived in the Montréal–Laval census agricultural region.
- Quebec’s population of English-speaking agricultural workers is aging. The proportion of those aged 55 or older rose from 31.0% in 2006 to 36.5% in 2016. This proportion was lower among their French-speaking counterparts in 2006 (22.3%) and 2016 (34.6%).
- In 2016, 38.1% of English-speaking agricultural workers were born outside Quebec, an increase from 2006 (32.3%). The proportion of English-speaking agri-food workers who were born in Quebec (46.5%) was similar to the proportion of those born outside Canada (44.3%) in 2016.
- In the Montréal–Laval census agricultural region in 2016, the proportion of English-speaking workers who were born outside Canada was 63.8% in the agriculture industry and 50.0% in the agri-food industry. In the Outaouais region, more than a third of English-speaking workers in these industries were born in Ontario.
- In 2016, more than one in six English-speaking workers in the agriculture and agri-food industries had a university degree. This proportion was about double that of their French-speaking counterparts. However, English-speaking agriculture industry workers were less likely to have a postsecondary diploma (45.5%) than their French-speaking counterparts (49.6%).
- The median employment income of English-speaking agricultural workers ($11,620) was lower than that of their French-speaking counterparts ($15,755) in 2016. This gap widened between 2006 ($2,705) and 2016 ($4,135). There was also a gap in favour of French speakers ($1,470) among agri-food workers in 2016.
Acknowledgements
This project was carried out as part of a collaboration between Statistics Canada, Agriculture and Agri-Food Canada (AAFC) as well as Innovation, Science and Economic Development Canada (ISED). Thanks go to Martin Fournier and his team at AAFC for their suggestions and comments.
This project was also made possible thanks to the participation of Leon Laborde and his team at Statistic Canada’s Census of Agriculture.
Finally, the author wishes to thank his colleagues at the Centre for Ethnocultural, Language and Immigration Statistics (CELIS) for their advice and revision efforts, particularly Émilie Lavoie, Bertrand Ouellet-Léveillé, and Éric Caron-Malenfant, as well as Isabelle Duncan, Alejandro Paez Silva, Janm Mehta, Denis Thériault, and Nathalie Villemure for their help finalizing this report.
Introduction
EnglishNote speakers in Quebec’s agriculture and agri-food industriesNote have unique characteristics and specific needs as an official language minority. This report profiles farms with an English-speaking main operatorNote as well as English-speaking workers in the agriculture and agri-food industries. It also presents the changes in their social, economic and linguistic profile between 2006 and 2016. It follows the “Portrait of English-language workers in Quebec’s agriculture and agri-food industries,”Note published in 2017.
Section 1 of this report presents the characteristics of farms whose main operator is English-speaking, based on data from the 2016 Census of Population and the 2016 Census of Agriculture. Using the first official language spoken of the first farm operator listed on the Census of Agriculture questionnaire, this section shows how farms with an English-speaking operator differ from other farms in their operating arrangements, farm type, operators’ age group structure and generational profile, declared land tenure, farm area, gross farm receipts, and farm capital.
Section 2 examines English-speaking workers active in Quebec’s agriculture industry. Using data from the 2006 and 2016 censuses of population, this section focuses on three census agricultural regions (CARs)Note with a high number and/or a large proportion of English-speaking agricultural workers: Montréal–Laval, Outaouais, and Montérégie. For the province and each of these regions, a profile of the English-speaking agricultural worker population and its evolution between 2006 and 2016 is presented by age group, sex, place of birth, IndigenousNote identity, education, class of worker, employment income, and languages used at work.
Similarly, Section 3 profiles English-speaking workers in the agri-food sector and their distribution by the specific industry in which they work. Data are also presented for the province and for the Montréal–Laval, Outaouais, and Montérégie CARs.
Lastly, the conclusion summarizes the trends that emerge in the previous sections to present general observations on the situation of English speakers in the agriculture and agri-food industries of Quebec and selected regions.
1. Portrait of Quebec farms whose main operator is English-speaking
This section looks at the characteristics of Quebec farms according to the language of the main operator in order to identify issues that could be of greater importance for farms operated by an English speaker.
The information in this section is based on integrated data from the 2016 Census of Agriculture and the 2016 Census of Population. Integrating these data helped determine the first official language spoken—derived from responses to the Census of Population—of the first operator listed on the Census of Agriculture questionnaire, for each farm in Quebec. This operator is responsible for making farm management decisions; it may be the owner or tenant of the operation, or a hired manager. As a result, farm-specific agricultural data can be presented according to the language of the main operator.
In this paper, “English-language farms” will be used to refer to farms whose main operator is English-speaking, and “French-language farms” for farms whose main operator is French-speaking.
In 2016, there were 28,920 farms in Quebec, just under 94% of which were French-language farms. The 1,790 English-language farms represented 6.2% of the province’s farms. There were fewer than ten farms with a main operator who was neither English-speaking nor French-speaking. For context, 13.7% of Quebec’s population was English-speaking in 2016.
1.1 Operating arrangements

Data table for Chart 1.1
| Sole proprietorship | Partnership without a written agreement | Partnership with a written agreement | Family corporation | Non-family corporation | |
|---|---|---|---|---|---|
| percent | |||||
| English FOLS | 55.8 | 12.9 | 12.8 | 15.1 | 3.4 |
| French FOLS | 42.7 | 6.6 | 16.2 | 27.7 | 6.8 |
| Total : Quebec | 43.5 | 7.0 | 16.0 | 26.9 | 6.5 |
|
|||||
In 2016, the most common operating arrangements among Quebec farms were sole proprietorships (43.5%) and family corporations (26.9%). In addition, nearly one in six farms were partnerships with a written agreement.
The operating arrangements of English- and French-language farms differed. The proportion of English-language farms that were sole proprietorships (55.8%) was higher than that of French-language farms (42.7%), while the proportion of family corporations among English-language farms (15.1%) was lower than for French-language farms (27.7%). In addition, the share of partnerships without a written agreement among English-language farms (12.9%) was almost double the proportion of French-language farms (6.6%).
1.2 Type of farm
| Farm type | FOLS of Main operator | Total: Quebec | |
|---|---|---|---|
| English | French | ||
| percent | |||
| Animal production | 49.3 | 42.2 | 42.6 |
| Cattle ranching and farming | 33.8 | 25.9 | 26.4 |
| Poultry and egg production | 2.1 | 1.9 | 1.9 |
| Sheep and goat farming | 1.9 | 3.1 | 3.0 |
| Hog and pig farming | 1.5 | 5.3 | 5.1 |
| Other animal production | 10.0 | 6.0 | 6.2 |
| Crop farming | 50.7 | 57.8 | 57.4 |
| Oilseed and grain farming | 13.0 | 15.8 | 15.6 |
| Vegetable and melon farming | 4.9 | 4.3 | 4.3 |
| Greenhouse, nursery and floriculture production | 4.2 | 4.0 | 4.0 |
| Fruit and tree nut farming | 3.7 | 5.3 | 5.2 |
| Other crop farming | 24.9 | 28.5 | 28.3 |
| Total | 100.0 | 100.0 | 100.0 |
|
|||
In 2016, more than one in four Quebec farms were associated with cattle ranching and farmingNote and more than one in seven farms grew oilseeds and grains.Note The category with the most farms was “other crop farming” (28.3%), which includes, but is not limited to, hay farming, maple syrup and products production, fruit and vegetable combination farming, and tobacco farming.
The farm type of English-language farms differed from that of French-language farms in 2016, the proportion of English-language farms engaged in animal production (49.3%) exceeding that of French-language farms (42.2%). Cattle were raised on approximately one-third of English-language farms, compared with slightly over one-quarter of French-language farms. There was a lower proportion of English-language farms that raised hogs and pigs (1.5%) compared to French-language farms (5.3%) and that the proportion of English-language farms included in the “other animal production” category (10.0%) exceeded that of French-language farms (6.0%). This category includes, for example, apiculture, horse and other equine production, fur-bearing animal and rabbit production, and animal combination farming.
1.3 Age group and generational profile of operators
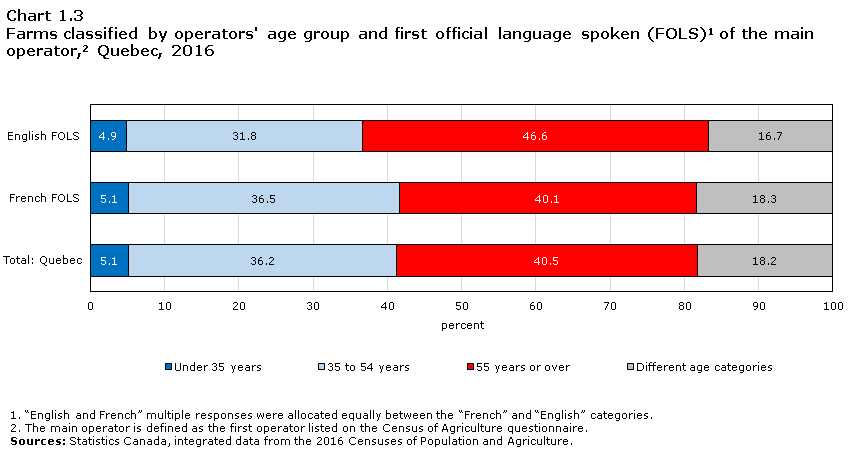
Data table for Chart 1.3
| Under 35 years | 35 to 54 years | 55 years or over | Different age categories | |
|---|---|---|---|---|
| percent | ||||
| English FOLS | 4.9 | 31.8 | 46.6 | 16.7 |
| French FOLS | 5.1 | 36.5 | 40.1 | 18.3 |
| Total : Quebec | 5.1 | 36.2 | 40.5 | 18.2 |
|
||||
Between one and three operators per farm can be listed on the Census of Agriculture questionnaire. The people who operate a given farm may belong to the same or to different age groups.
In 2016, relatively few Quebec farms were operated exclusively by young people aged 35 or under. This was the case for 1 in 20 farms, with a similar proportion in both English-language and French-language farms.
Moreover, about four in ten Quebec farms were operated exclusively by persons aged 55 or older. This proportion was higher for English-language farms (46.6%) than for French-language farms (40.1%). This suggests a more pronounced aging of farm operators on English-language farms.
In 2016, 12.3% of Quebec farms were multi-generational.Note The proportion of such farms among English-language farms (10.9%) was slightly lower than that of French-language farms (12.4%).
1.4 Land tenure
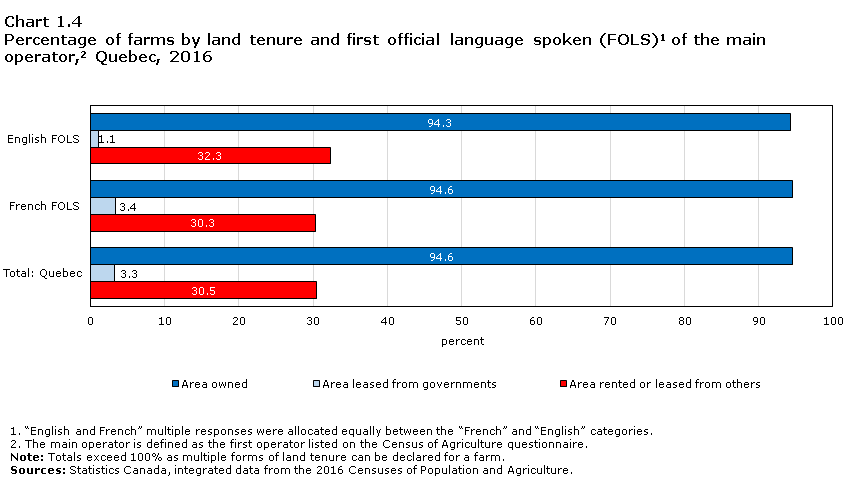
Data table for Chart 1.4
| Area owned | Area leased from governments | Area rented or leased from others | |
|---|---|---|---|
| percent | |||
| English FOLS | 94.3 | 1.1 | 32.3 |
| French FOLS | 94.6 | 3.4 | 30.3 |
| Total : Quebec | 94.6 | 3.3 | 30.5 |
Sources: Statistics Canada, integrated data from the 2016 Censuses of Population and Agriculture. |
|||
A farm’s land can be classified in more than one tenure category, as the different parts of a given farm can be occupied in different ways. In 2016, more than 94% of Quebec farms included land that they owned and about three farms in ten included land leased from other entities than governments. These proportions were similar for both English-language and French-language farms.
1.5 Total farm area
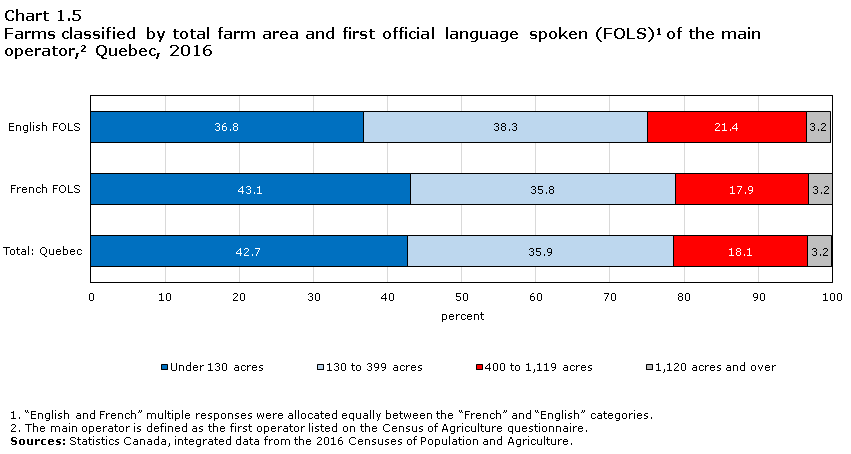
Data table for Chart 1.5
| Under 130 acres | 130 to 399 acres | 400 to 1,119 acres | 1,120 acres and over | |
|---|---|---|---|---|
| percent | ||||
| English FOLS | 36.8 | 38.3 | 21.4 | 3.2 |
| French FOLS | 43.1 | 35.8 | 17.9 | 3.2 |
| Total : Quebec | 42.7 | 35.9 | 18.1 | 3.2 |
|
||||
In 2016, more than two in five Quebec farms covered a small area of less than 130 acres and nearly one in five farms covered a large area of 400 acres or more.
English-language farms were more likely to cover a large area than French-language farms. In 2016, the proportion of English-language farms with an area of 130 to 399 acres (38.3%) or 400 to 1,119 acres (21.4%) was higher than that of French-language farms (35.8% and 17.9%, respectively).
1.6 Total gross farm receipts
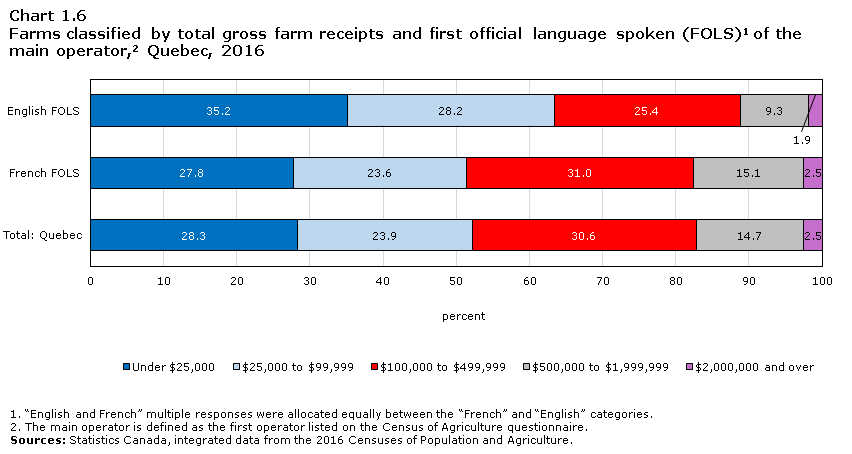
Data table for Chart 1.6
| Under $25,000 | $25,000 to $99,999 | $100,000 to $499,999 | $500,000 to $1,999,999 | $2,000,000 and over | |
|---|---|---|---|---|---|
| percent | |||||
| English FOLS | 35.2 | 28.2 | 25.4 | 9.3 | 1.9 |
| French FOLS | 27.8 | 23.6 | 31.0 | 15.1 | 2.5 |
| Total : Quebec | 28.3 | 23.9 | 30.6 | 14.7 | 2.5 |
|
|||||
In 2016, the largest proportion of Quebec farms (30.6%) were in the $100,000 to $499,999 gross farm receipts group. About half of the farms had farm receipts of less than $100,000, and more than one in six farms had high farm receipts of $500,000 or more.
The gross farm receipts of Quebec’s English-language farms were lower than those of French-language farms in 2016. The proportion of English-language farms with farm receipts below $25,000 (35.2%) was higher than that of French-language farms (27.8%), and nearly half of French-language farms had farm receipts of $100,000 or more, compared with less than 37% of English-language farms.
1.7 Total farm capital
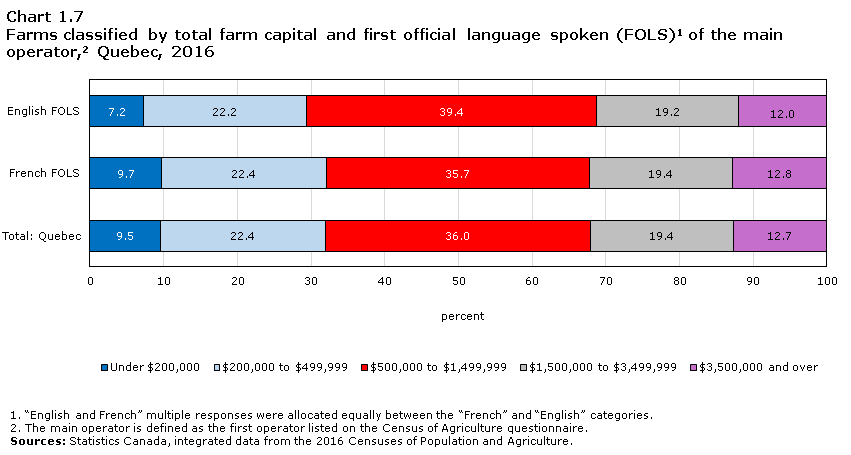
Data table for Chart 1.7
| Under $200,000 | $200,000 to $499,999 | $500,000 to $1,499,999 | $1,500,000 to $3,499,999 | $3,500,000 and over | |
|---|---|---|---|---|---|
| percent | |||||
| English FOLS | 7.2 | 22.2 | 39.4 | 19.2 | 12.0 |
| French FOLS | 9.7 | 22.4 | 35.7 | 19.4 | 12.8 |
| Total : Quebec | 9.5 | 22.4 | 36.0 | 19.4 | 12.7 |
|
|||||
In 2016, 36.0% of Quebec’s farms had a farm capital between $500,000 and $1,499,999, making it the category with the largest proportion of farms. Just under one in ten farms had low farm capital of less than $200,000, while about one in eight farms had high farm capital of $3,500,000 or more.
The farm capital of English-language farms was generally similar to that of French-language farms. However, English-language farms were slightly less likely to have farm capital of under $200,000 than French-language farms (7.2% versus 9.7%).
2. Social, economic and linguistic profile of English-speaking workers in Quebec’s agriculture industry
This section presents the changes in the social, economic and linguistic profile of English-speaking agricultural workers in Quebec between 2006 and 2016. There is a particular focus on the census agricultural regions (CARs) of Montréal–Laval and Outaouais, as a large proportion of the agricultural workers who lived in these regions in 2016 were English speakers (24.3% and 43.2%, respectively), as well as on Montérégie, the region with the most English-speaking agricultural workers in the province (1,650 workers).Note
The term “agricultural worker” includes the farm operators that were covered in the previous section, and also any person aged 15 or older who workedNote on a farm, in crop and animal production, in greenhouse, nursery and floriculture production or in aquaculture. Table A.1 in Appendix A provides a detailed list of industries in the agriculture sector. The data presented in this section are from the 2006 and 2016 censuses of population.
| Census agricultural region | FOLS | |||||||
|---|---|---|---|---|---|---|---|---|
| 2006 | 2016 | |||||||
| English | French | Neither English nor French | Total | English | French | Neither English nor French | Total | |
| number | ||||||||
| Chaudière-Appalaches | 45 | 10,400 | 0 | 10,450 | 80 | 10,310 | 25 | 10,415 |
| Estrie | 795 | 4,735 | 20 | 5,555 | 680 | 4,960 | 40 | 5,690 |
| Gaspésie–Îles-de-la-Madeleine | 55 | 550 | 0 | 605 | 70 | 455 | 0 | 530 |
| Montérégie | 1,890 | 16,390 | 175 | 18,450 | 1,650 | 16,665 | 275 | 18,585 |
| Montréal–Laval | 495 | 1,620 | 115 | 2,225 | 715 | 2,065 | 165 | 2,950 |
| Outaouais | 680 | 1,065 | 15 | 1,760 | 765 | 1,000 | 0 | 1,775 |
| Total: Quebec | 4,545 | 68,200 | 485 | 73,230 | 4,525 | 65,990 | 810 | 71,325 |
| percent | ||||||||
| Chaudière-Appalaches | 0.4 | 99.6 | 0.0 | 100.0 | 0.8 | 99.0 | 0.3 | 100.0 |
| Estrie | 14.4 | 85.3 | 0.4 | 100.0 | 12.0 | 87.3 | 0.7 | 100.0 |
| Gaspésie–Îles-de-la-Madeleine | 9.4 | 90.6 | 0.0 | 100.0 | 14.1 | 85.9 | 0.0 | 100.0 |
| Montérégie | 10.2 | 88.8 | 0.9 | 100.0 | 8.9 | 89.7 | 1.5 | 100.0 |
| Montréal–Laval | 22.1 | 72.8 | 5.1 | 100.0 | 24.3 | 70.2 | 5.5 | 100.0 |
| Outaouais | 38.5 | 60.5 | 1.0 | 100.0 | 43.2 | 56.5 | 0.0 | 100.0 |
| Total: Quebec | 6.2 | 93.1 | 0.7 | 100.0 | 6.3 | 92.5 | 1.1 | 100.0 |
Sources: Statistics Canada, 2006 and 2016 censuses of population. |
||||||||
In 2016, 71,325 people aged 15 or older worked in Quebec’s agriculture industry. This number was higher in 2006 (73,230 workers). Table 2 shows that Montérégie and Chaudière-Appalaches were the CARs with the highest number of agricultural workers in 2006 and 2016.
The number of AnglophoneNote agricultural workers in Quebec was relatively stable between 2006 (4,545 workers) and 2016 (4,525 workers). Anglophone agricultural workers were most commonly found in Montérégie, where they numbered 1,650 in 2016, representing about 36% of all Anglophone agricultural workers in the province. Other CARs with a high number of English-speaking agricultural workers in 2016 include Outaouais (765 workers), Montréal–Laval (715 workers) and Estrie (680 workers).
In 2016, Anglophones represented more than one in ten agricultural workers in the CARs of Outaouais (43.2%), Montréal–Laval (24.3%), Gaspésie–Îles-de-la-Madeleine (14.1%), and Estrie (12.0%). Just over 6% of Quebec’s agricultural workers were Anglophone in both 2006 and 2016.
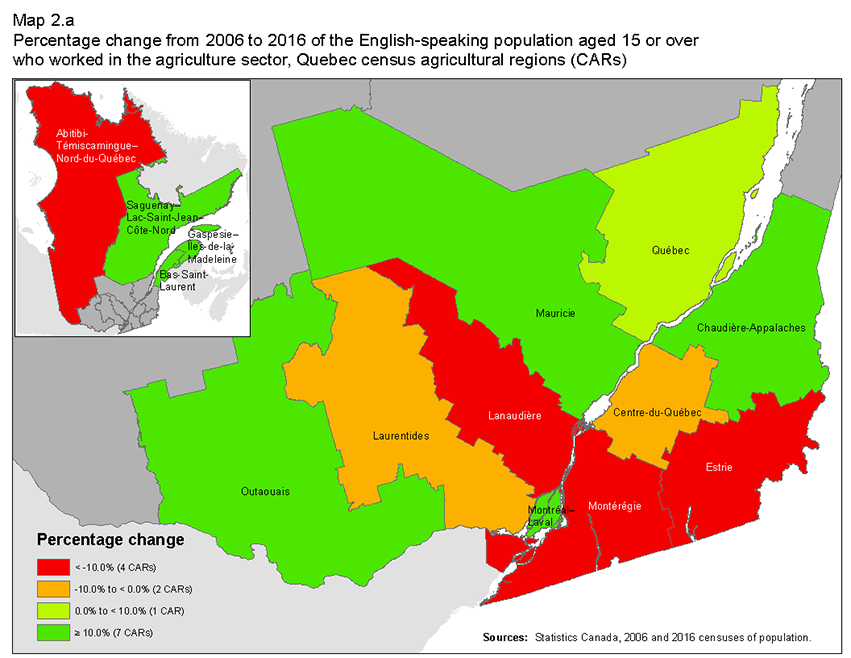
Description for Map 2.a
This map shows the percentage change from 2006 to 2016 of the English-speaking population aged 15 or over who worked in the agriculture sector, in each of Quebec’s census agricultural regions.
On this map, four different colours are used to identify values. Red represents census agricultural regions where the English-speaking population aged 15 or over who worked in the agriculture sector decreased by more than 10% between 2006 and 2016. In this group, there are four census agricultural regions.
Orange represents census agricultural regions where the English-speaking population aged 15 or over who worked in the agriculture sector decreased by 10% or less between 2006 and 2016. In this group, there are two census agricultural regions.
Light green represents census agricultural regions where the English-speaking population aged 15 or over who worked in the agriculture sector increased by less than 10% between 2006 and 2016. In this group, there is one census agricultural region.
Dark green represents census agricultural regions where the English-speaking population aged 15 or over who worked in the agriculture sector increased by 10% or more between 2006 and 2016. In this group, there are seven census agricultural regions.
The borders of each census agricultural region are delineated by a grey line. Each census agricultural region is assigned a colour based on the table below.
| Census agricultural region | Percentage change |
|---|---|
| 2401 | 32.2 |
| 2402 | 25.2 |
| 2403 | 8.3 |
| 2404 | 54.6 |
| 2405 | -14.3 |
| 2406 | 45.1 |
| 2407 | -31.1 |
| 2408 | 13.3 |
| 2409 | -6.8 |
| 2410 | -24.6 |
| 2411 | 30.3 |
| 2412 | 70.6 |
| 2413 | -12.7 |
| 2414 | -4.6 |
Map 2.a shows that the number of Anglophone agricultural workers increased in eight CARs and decreased in six CARs between 2006 and 2016. The population of Anglophone agricultural workers grew in Montréal–Laval and in Outaouais, while it decreased in Estrie and in Montérégie.
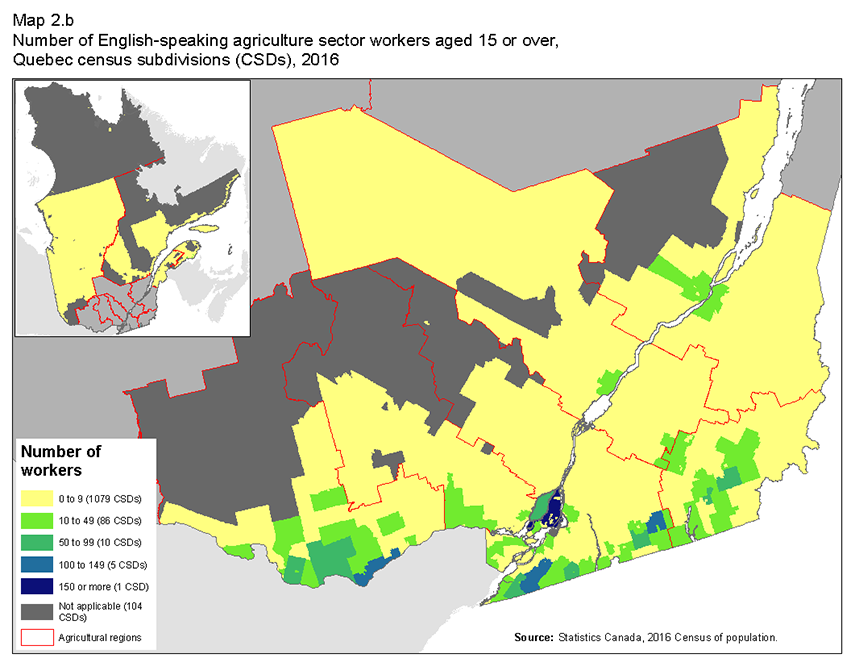
Description for Map 2.b
This map shows the number of English-speaking agriculture sector workers aged 15 or over in 2016 in each of Quebec’s census subdivisions.
On this map, we use six different colours to identify values. Dark grey represents census subdivisions for which data is unavailable. In this group, there are 104 census subdivisions.
Yellow represents census subdivisions where there were between zero and nine English-speaking agriculture sector workers aged 15 or over in 2016. In this group, there are 1,079 census subdivisions.
Light green represents census subdivisions where there were between 10 and 49 English-speaking agriculture sector workers aged 15 or over in 2016. In this group, there are 86 census subdivisions.
Dark green represents census subdivisions where there were between 50 and 99 English-speaking agriculture sector workers aged 15 or over in 2016. In this group, there are 10 census subdivisions.
Light blue represents census subdivisions where there were between 100 and 149 English-speaking agriculture sector workers aged 15 or over in 2016. In this group, there are five census subdivisions.
Dark blue represents census subdivisions where there were 150 or more English-speaking agriculture sector workers aged 15 or over in 2016. In this group, there is one census subdivision.
The borders of each census agricultural region are delineated by a red line. Each census subdivision is assigned a colour based on the table below.
| Stuff andnd | Number of workers |
|---|---|
| 2401023 | 0 |
| 2401042 | 0 |
| 2402005 | 0 |
| 2402010 | 0 |
| 2402015 | 0 |
| 2402028 | 0 |
| 2402047 | 0 |
| 2403005 | 0 |
| 2403010 | 0 |
| 2403015 | 0 |
| 2403020 | 0 |
| 2403025 | 0 |
| 2404005 | 0 |
| 2404010 | 0 |
| 2404015 | 0 |
| 2404020 | 0 |
| 2404025 | 0 |
| 2404030 | 0 |
| 2404037 | 0 |
| 2404047 | 0 |
| 2404902 | 0 |
| 2405010 | 10 |
| 2405015 | 0 |
| 2405020 | 0 |
| 2405025 | 0 |
| 2405032 | 0 |
| 2405040 | 15 |
| 2405045 | 0 |
| 2405050 | 0 |
| 2405055 | 0 |
| 2405060 | 0 |
| 2405065 | 0 |
| 2405070 | 10 |
| 2405077 | 0 |
| 2405902 | 0 |
| 2406005 | 0 |
| 2406013 | 0 |
| 2406020 | 0 |
| 2406025 | 0 |
| 2406030 | 0 |
| 2406035 | 0 |
| 2406040 | 0 |
| 2406045 | 0 |
| 2406050 | 0 |
| 2406055 | 0 |
| 2406060 | 0 |
| 2406802 | 0 |
| 2406804 | 0 |
| 2407005 | 0 |
| 2407010 | 0 |
| 2407018 | 0 |
| 2407025 | 0 |
| 2407030 | 0 |
| 2407035 | 0 |
| 2407040 | 0 |
| 2407047 | 0 |
| 2407057 | 0 |
| 2407065 | 0 |
| 2407070 | 0 |
| 2407075 | 0 |
| 2407080 | 0 |
| 2407085 | 0 |
| 2407090 | 0 |
| 2407095 | 0 |
| 2407100 | 0 |
| 2407105 | 0 |
| 2407902 | 0 |
| 2407908 | 0 |
| 2407914 | 0 |
| 2408005 | 0 |
| 2408010 | 0 |
| 2408015 | 0 |
| 2408023 | 0 |
| 2408030 | 0 |
| 2408035 | 0 |
| 2408040 | 0 |
| 2408053 | 0 |
| 2408065 | 0 |
| 2408073 | 0 |
| 2408080 | 0 |
| 2408902 | 0 |
| 2409005 | 0 |
| 2409010 | 0 |
| 2409015 | 0 |
| 2409020 | 0 |
| 2409025 | 0 |
| 2409030 | 0 |
| 2409035 | 0 |
| 2409040 | 0 |
| 2409048 | 0 |
| 2409055 | 0 |
| 2409060 | 0 |
| 2409065 | 0 |
| 2409070 | 0 |
| 2409077 | 0 |
| 2409085 | 0 |
| 2409092 | 0 |
| 2410005 | 0 |
| 2410010 | 0 |
| 2410015 | 0 |
| 2410025 | 0 |
| 2410030 | 0 |
| 2410043 | 0 |
| 2410060 | 0 |
| 2410070 | 0 |
| 2410075 | 0 |
| 2410902 | 0 |
| 2411005 | 0 |
| 2411010 | 0 |
| 2411015 | 0 |
| 2411020 | 0 |
| 2411025 | 0 |
| 2411030 | 0 |
| 2411035 | 0 |
| 2411040 | 0 |
| 2411045 | 0 |
| 2411050 | 0 |
| 2411055 | 0 |
| 2412005 | 0 |
| 2412010 | 0 |
| 2412015 | 0 |
| 2412020 | 0 |
| 2412025 | 0 |
| 2412030 | 0 |
| 2412035 | 0 |
| 2412043 | 0 |
| 2412045 | 0 |
| 2412057 | 0 |
| 2412065 | 0 |
| 2412072 | 0 |
| 2412080 | 0 |
| 2413005 | 0 |
| 2413010 | 0 |
| 2413015 | 0 |
| 2413020 | 0 |
| 2413025 | 0 |
| 2413030 | 0 |
| 2413040 | 0 |
| 2413045 | 0 |
| 2413050 | 0 |
| 2413055 | 0 |
| 2413060 | 0 |
| 2413065 | 0 |
| 2413073 | 0 |
| 2413075 | 0 |
| 2413080 | 0 |
| 2413085 | 0 |
| 2413090 | 0 |
| 2413095 | 0 |
| 2413100 | 0 |
| 2414005 | 0 |
| 2414010 | 0 |
| 2414018 | 0 |
| 2414025 | 0 |
| 2414030 | 0 |
| 2414035 | 0 |
| 2414040 | 0 |
| 2414045 | 0 |
| 2414050 | 0 |
| 2414055 | 0 |
| 2414060 | 0 |
| 2414065 | 0 |
| 2414070 | 0 |
| 2414075 | 0 |
| 2414080 | 0 |
| 2414085 | 0 |
| 2414090 | 0 |
| 2414902 | 0 |
| 2415005 | 0 |
| 2415013 | 0 |
| 2415025 | 0 |
| 2415030 | 0 |
| 2415035 | 0 |
| 2415058 | 0 |
| 2415065 | 0 |
| 2415902 | 0 |
| 2415904 | 0 |
| 2416005 | 0 |
| 2416013 | 0 |
| 2416023 | 0 |
| 2416048 | 0 |
| 2416050 | 0 |
| 2416055 | 0 |
| 2417005 | 0 |
| 2417010 | 0 |
| 2417015 | 0 |
| 2417020 | 0 |
| 2417025 | 0 |
| 2417030 | 0 |
| 2417035 | 0 |
| 2417040 | 0 |
| 2417045 | 0 |
| 2417055 | 0 |
| 2417060 | 0 |
| 2417065 | 0 |
| 2417070 | 0 |
| 2417078 | 0 |
| 2418005 | 0 |
| 2418010 | 0 |
| 2418015 | 0 |
| 2418020 | 0 |
| 2418025 | 0 |
| 2418030 | 0 |
| 2418035 | 0 |
| 2418040 | 0 |
| 2418045 | 0 |
| 2418050 | 5 |
| 2418055 | 0 |
| 2418060 | 0 |
| 2418065 | 0 |
| 2418070 | 0 |
| 2419005 | 0 |
| 2419010 | 0 |
| 2419015 | 0 |
| 2419020 | 0 |
| 2419025 | 5 |
| 2419030 | 0 |
| 2419037 | 0 |
| 2419045 | 5 |
| 2419050 | 0 |
| 2419055 | 0 |
| 2419062 | 0 |
| 2419068 | 0 |
| 2419070 | 0 |
| 2419075 | 0 |
| 2419082 | 0 |
| 2419090 | 0 |
| 2419097 | 0 |
| 2419105 | 0 |
| 2419110 | 0 |
| 2419117 | 0 |
| 2420005 | 0 |
| 2420010 | 0 |
| 2420015 | 0 |
| 2420020 | 0 |
| 2420025 | 0 |
| 2420030 | 0 |
| 2421005 | 0 |
| 2421010 | 0 |
| 2421020 | 0 |
| 2421025 | 0 |
| 2421030 | 0 |
| 2421035 | 0 |
| 2421040 | 0 |
| 2421045 | 0 |
| 2422005 | 0 |
| 2422010 | 0 |
| 2422015 | 0 |
| 2422020 | 0 |
| 2422025 | 15 |
| 2422030 | 0 |
| 2422035 | 0 |
| 2422040 | 0 |
| 2422045 | 0 |
| 2423027 | 40 |
| 2423057 | 0 |
| 2423072 | 0 |
| 2423802 | 0 |
| 2425213 | 15 |
| 2426005 | 0 |
| 2426010 | 0 |
| 2426015 | 0 |
| 2426022 | 0 |
| 2426030 | 0 |
| 2426035 | 0 |
| 2426040 | 0 |
| 2426048 | 0 |
| 2426055 | 5 |
| 2426063 | 0 |
| 2426070 | 5 |
| 2427008 | 0 |
| 2427015 | 0 |
| 2427028 | 0 |
| 2427035 | 0 |
| 2427043 | 0 |
| 2427050 | 0 |
| 2427055 | 0 |
| 2427060 | 0 |
| 2427065 | 0 |
| 2427070 | 0 |
| 2428005 | 0 |
| 2428015 | 0 |
| 2428020 | 0 |
| 2428025 | 0 |
| 2428030 | 0 |
| 2428035 | 0 |
| 2428040 | 0 |
| 2428045 | 0 |
| 2428053 | 0 |
| 2428060 | 0 |
| 2428065 | 0 |
| 2428070 | 0 |
| 2428075 | 0 |
| 2429005 | 0 |
| 2429013 | 0 |
| 2429020 | 0 |
| 2429025 | 0 |
| 2429030 | 0 |
| 2429038 | 0 |
| 2429045 | 0 |
| 2429050 | 0 |
| 2429057 | 0 |
| 2429065 | 0 |
| 2429073 | 0 |
| 2429095 | 0 |
| 2429100 | 0 |
| 2429112 | 0 |
| 2429120 | 0 |
| 2429125 | 0 |
| 2430005 | 0 |
| 2430010 | 0 |
| 2430015 | 0 |
| 2430020 | 0 |
| 2430025 | 0 |
| 2430030 | 0 |
| 2430035 | 0 |
| 2430040 | 0 |
| 2430045 | 0 |
| 2430050 | 0 |
| 2430055 | 0 |
| 2430070 | 0 |
| 2430072 | 0 |
| 2430080 | 0 |
| 2430085 | 0 |
| 2430090 | 0 |
| 2430095 | 0 |
| 2430100 | 0 |
| 2430105 | 0 |
| 2430110 | 0 |
| 2431008 | 0 |
| 2431015 | 0 |
| 2431020 | 0 |
| 2431025 | 0 |
| 2431030 | 0 |
| 2431035 | 0 |
| 2431040 | 0 |
| 2431045 | 0 |
| 2431050 | 0 |
| 2431056 | 0 |
| 2431060 | 0 |
| 2431084 | 0 |
| 2431095 | 0 |
| 2431100 | 0 |
| 2431105 | 0 |
| 2431122 | 0 |
| 2431130 | 0 |
| 2431135 | 0 |
| 2431140 | 0 |
| 2432013 | 0 |
| 2432023 | 0 |
| 2432033 | 5 |
| 2432040 | 0 |
| 2432045 | 0 |
| 2432050 | 0 |
| 2432058 | 0 |
| 2432065 | 0 |
| 2432072 | 0 |
| 2432080 | 0 |
| 2432085 | 0 |
| 2433007 | 5 |
| 2433017 | 0 |
| 2433025 | 0 |
| 2433030 | 0 |
| 2433035 | 0 |
| 2433040 | 0 |
| 2433045 | 0 |
| 2433052 | 0 |
| 2433060 | 0 |
| 2433065 | 0 |
| 2433070 | 0 |
| 2433080 | 0 |
| 2433085 | 0 |
| 2433090 | 0 |
| 2433095 | 0 |
| 2433102 | 0 |
| 2433115 | 0 |
| 2433123 | 0 |
| 2434007 | 0 |
| 2434017 | 0 |
| 2434025 | 0 |
| 2434030 | 0 |
| 2434038 | 0 |
| 2434048 | 0 |
| 2434058 | 0 |
| 2434060 | 0 |
| 2434065 | 0 |
| 2434078 | 0 |
| 2434085 | 0 |
| 2434090 | 0 |
| 2434097 | 0 |
| 2434105 | 0 |
| 2434115 | 0 |
| 2434120 | 0 |
| 2434128 | 0 |
| 2434135 | 0 |
| 2435005 | 0 |
| 2435010 | 0 |
| 2435015 | 0 |
| 2435020 | 0 |
| 2435027 | 0 |
| 2435035 | 5 |
| 2435040 | 0 |
| 2435045 | 0 |
| 2435050 | 0 |
| 2435055 | 0 |
| 2435906 | 0 |
| 2436033 | 0 |
| 2437067 | 10 |
| 2437205 | 0 |
| 2437210 | 0 |
| 2437215 | 0 |
| 2437220 | 0 |
| 2437225 | 0 |
| 2437230 | 0 |
| 2437235 | 0 |
| 2437240 | 0 |
| 2437245 | 0 |
| 2437250 | 0 |
| 2438005 | 0 |
| 2438010 | 0 |
| 2438015 | 0 |
| 2438020 | 0 |
| 2438028 | 0 |
| 2438035 | 0 |
| 2438040 | 0 |
| 2438047 | 0 |
| 2438055 | 0 |
| 2438060 | 0 |
| 2438065 | 0 |
| 2438070 | 0 |
| 2438802 | 0 |
| 2439005 | 0 |
| 2439010 | 0 |
| 2439015 | 0 |
| 2439020 | 0 |
| 2439025 | 5 |
| 2439030 | 0 |
| 2439035 | 0 |
| 2439043 | 0 |
| 2439060 | 0 |
| 2439062 | 5 |
| 2439077 | 0 |
| 2439085 | 0 |
| 2439090 | 0 |
| 2439097 | 0 |
| 2439105 | 0 |
| 2439117 | 0 |
| 2439130 | 0 |
| 2439135 | 0 |
| 2439145 | 0 |
| 2439150 | 0 |
| 2439155 | 0 |
| 2439165 | 0 |
| 2439170 | 0 |
| 2440005 | 0 |
| 2440010 | 0 |
| 2440017 | 5 |
| 2440025 | 0 |
| 2440032 | 5 |
| 2440043 | 5 |
| 2440047 | 15 |
| 2441012 | 0 |
| 2441020 | 0 |
| 2441027 | 0 |
| 2441037 | 45 |
| 2441038 | 65 |
| 2441055 | 0 |
| 2441060 | 0 |
| 2441065 | 10 |
| 2441070 | 25 |
| 2441075 | 0 |
| 2441080 | 0 |
| 2441085 | 10 |
| 2441098 | 0 |
| 2441117 | 10 |
| 2442005 | 0 |
| 2442020 | 0 |
| 2442025 | 0 |
| 2442032 | 0 |
| 2442040 | 0 |
| 2442045 | 0 |
| 2442050 | 0 |
| 2442055 | 0 |
| 2442060 | 0 |
| 2442065 | 0 |
| 2442070 | 0 |
| 2442075 | 45 |
| 2442078 | 15 |
| 2442088 | 0 |
| 2442095 | 0 |
| 2442098 | 10 |
| 2442100 | 0 |
| 2442110 | 30 |
| 2443027 | 40 |
| 2444003 | 0 |
| 2444005 | 0 |
| 2444010 | 0 |
| 2444015 | 0 |
| 2444023 | 0 |
| 2444037 | 10 |
| 2444045 | 20 |
| 2444050 | 5 |
| 2444055 | 5 |
| 2444060 | 0 |
| 2444071 | 10 |
| 2444080 | 20 |
| 2445008 | 15 |
| 2445020 | 10 |
| 2445025 | 35 |
| 2445030 | 10 |
| 2445035 | 5 |
| 2445043 | 0 |
| 2445050 | 0 |
| 2445055 | 70 |
| 2445060 | 0 |
| 2445072 | 10 |
| 2445085 | 0 |
| 2445093 | 0 |
| 2445095 | 5 |
| 2445100 | 0 |
| 2445105 | 0 |
| 2445115 | 0 |
| 2446005 | 0 |
| 2446010 | 5 |
| 2446017 | 25 |
| 2446025 | 0 |
| 2446030 | 15 |
| 2446035 | 5 |
| 2446040 | 20 |
| 2446045 | 25 |
| 2446050 | 55 |
| 2446058 | 25 |
| 2446065 | 20 |
| 2446070 | 20 |
| 2446075 | 100 |
| 2446078 | 0 |
| 2446080 | 20 |
| 2446085 | 0 |
| 2446090 | 15 |
| 2446095 | 0 |
| 2446100 | 5 |
| 2446105 | 5 |
| 2446112 | 5 |
| 2447010 | 0 |
| 2447017 | 0 |
| 2447025 | 0 |
| 2447030 | 0 |
| 2447035 | 0 |
| 2447040 | 0 |
| 2447047 | 0 |
| 2447055 | 0 |
| 2448005 | 0 |
| 2448010 | 0 |
| 2448015 | 0 |
| 2448020 | 0 |
| 2448028 | 0 |
| 2448038 | 0 |
| 2448045 | 0 |
| 2448050 | 0 |
| 2449005 | 35 |
| 2449015 | 15 |
| 2449020 | 0 |
| 2449025 | 0 |
| 2449030 | 0 |
| 2449040 | 0 |
| 2449048 | 0 |
| 2449058 | 5 |
| 2449070 | 0 |
| 2449075 | 0 |
| 2449080 | 0 |
| 2449085 | 0 |
| 2449095 | 0 |
| 2449100 | 0 |
| 2449105 | 0 |
| 2449113 | 0 |
| 2449125 | 0 |
| 2449130 | 0 |
| 2450005 | 0 |
| 2450013 | 0 |
| 2450023 | 5 |
| 2450030 | 0 |
| 2450035 | 0 |
| 2450042 | 0 |
| 2450050 | 0 |
| 2450057 | 0 |
| 2450065 | 0 |
| 2450072 | 0 |
| 2450085 | 0 |
| 2450090 | 0 |
| 2450095 | 0 |
| 2450100 | 0 |
| 2450113 | 0 |
| 2450128 | 0 |
| 2450802 | 0 |
| 2451008 | 0 |
| 2451015 | 0 |
| 2451020 | 0 |
| 2451025 | 0 |
| 2451030 | 0 |
| 2451035 | 0 |
| 2451040 | 0 |
| 2451045 | 0 |
| 2451050 | 0 |
| 2451055 | 0 |
| 2451060 | 0 |
| 2451065 | 0 |
| 2451070 | 0 |
| 2451075 | 0 |
| 2451080 | 0 |
| 2451085 | 0 |
| 2451090 | 0 |
| 2452007 | 0 |
| 2452017 | 5 |
| 2452030 | 0 |
| 2452035 | 0 |
| 2452040 | 0 |
| 2452045 | 0 |
| 2452050 | 0 |
| 2452055 | 0 |
| 2452062 | 0 |
| 2452070 | 0 |
| 2452075 | 0 |
| 2452080 | 0 |
| 2452085 | 0 |
| 2452090 | 0 |
| 2452095 | 0 |
| 2453005 | 0 |
| 2453010 | 0 |
| 2453015 | 0 |
| 2453020 | 0 |
| 2453025 | 0 |
| 2453032 | 0 |
| 2453040 | 0 |
| 2453050 | 0 |
| 2453052 | 0 |
| 2453065 | 0 |
| 2453072 | 0 |
| 2453085 | 0 |
| 2454008 | 0 |
| 2454017 | 0 |
| 2454025 | 0 |
| 2454030 | 0 |
| 2454035 | 0 |
| 2454048 | 5 |
| 2454060 | 0 |
| 2454065 | 0 |
| 2454072 | 0 |
| 2454090 | 0 |
| 2454095 | 0 |
| 2454100 | 0 |
| 2454105 | 0 |
| 2454110 | 0 |
| 2454115 | 0 |
| 2454120 | 0 |
| 2454125 | 0 |
| 2455008 | 0 |
| 2455015 | 0 |
| 2455023 | 0 |
| 2455030 | 0 |
| 2455037 | 0 |
| 2455048 | 0 |
| 2455057 | 0 |
| 2455065 | 0 |
| 2456005 | 0 |
| 2456010 | 10 |
| 2456015 | 10 |
| 2456023 | 10 |
| 2456030 | 0 |
| 2456035 | 5 |
| 2456042 | 0 |
| 2456050 | 10 |
| 2456055 | 0 |
| 2456060 | 0 |
| 2456065 | 0 |
| 2456083 | 0 |
| 2456097 | 0 |
| 2456105 | 0 |
| 2457005 | 0 |
| 2457010 | 0 |
| 2457020 | 0 |
| 2457025 | 0 |
| 2457030 | 0 |
| 2457033 | 5 |
| 2457035 | 5 |
| 2457040 | 0 |
| 2457045 | 0 |
| 2457050 | 0 |
| 2457057 | 0 |
| 2457068 | 0 |
| 2457075 | 0 |
| 2458007 | 20 |
| 2458012 | 0 |
| 2458033 | 5 |
| 2458037 | 5 |
| 2458227 | 25 |
| 2459010 | 0 |
| 2459015 | 0 |
| 2459020 | 0 |
| 2459025 | 0 |
| 2459030 | 0 |
| 2459035 | 0 |
| 2460005 | 0 |
| 2460013 | 5 |
| 2460020 | 0 |
| 2460028 | 0 |
| 2460035 | 0 |
| 2460040 | 0 |
| 2461005 | 0 |
| 2461013 | 0 |
| 2461020 | 0 |
| 2461025 | 0 |
| 2461027 | 0 |
| 2461030 | 0 |
| 2461035 | 0 |
| 2461040 | 0 |
| 2461045 | 0 |
| 2461050 | 0 |
| 2462007 | 0 |
| 2462015 | 0 |
| 2462020 | 0 |
| 2462025 | 0 |
| 2462030 | 0 |
| 2462037 | 5 |
| 2462047 | 0 |
| 2462053 | 0 |
| 2462055 | 0 |
| 2462060 | 0 |
| 2462065 | 0 |
| 2462070 | 0 |
| 2462075 | 0 |
| 2462080 | 0 |
| 2462085 | 0 |
| 2462802 | 0 |
| 2462912 | 0 |
| 2463005 | 0 |
| 2463013 | 0 |
| 2463023 | 0 |
| 2463030 | 0 |
| 2463035 | 0 |
| 2463040 | 0 |
| 2463048 | 0 |
| 2463055 | 0 |
| 2463060 | 0 |
| 2463065 | 0 |
| 2464008 | 0 |
| 2464015 | 0 |
| 2465005 | 90 |
| 2466007 | 0 |
| 2466023 | 540 |
| 2466032 | 0 |
| 2466047 | 0 |
| 2466058 | 5 |
| 2466062 | 0 |
| 2466072 | 0 |
| 2466087 | 0 |
| 2466092 | 0 |
| 2466097 | 10 |
| 2466102 | 10 |
| 2466107 | 15 |
| 2466112 | 0 |
| 2466117 | 0 |
| 2466127 | 0 |
| 2466142 | 15 |
| 2467005 | 0 |
| 2467010 | 0 |
| 2467015 | 5 |
| 2467020 | 10 |
| 2467025 | 0 |
| 2467030 | 0 |
| 2467035 | 0 |
| 2467040 | 0 |
| 2467045 | 10 |
| 2467050 | 10 |
| 2467055 | 0 |
| 2468005 | 10 |
| 2468010 | 20 |
| 2468015 | 65 |
| 2468020 | 10 |
| 2468025 | 0 |
| 2468030 | 0 |
| 2468035 | 0 |
| 2468040 | 5 |
| 2468045 | 0 |
| 2468050 | 5 |
| 2468055 | 0 |
| 2469005 | 25 |
| 2469010 | 35 |
| 2469017 | 10 |
| 2469025 | 0 |
| 2469030 | 115 |
| 2469037 | 100 |
| 2469045 | 110 |
| 2469050 | 55 |
| 2469055 | 15 |
| 2469060 | 65 |
| 2469065 | 0 |
| 2469070 | 30 |
| 2469075 | 10 |
| 2469802 | 0 |
| 2470005 | 0 |
| 2470012 | 5 |
| 2470022 | 10 |
| 2470030 | 0 |
| 2470035 | 5 |
| 2470040 | 0 |
| 2470052 | 5 |
| 2471005 | 0 |
| 2471015 | 10 |
| 2471020 | 0 |
| 2471025 | 0 |
| 2471033 | 5 |
| 2471040 | 0 |
| 2471045 | 0 |
| 2471050 | 5 |
| 2471055 | 0 |
| 2471060 | 0 |
| 2471065 | 5 |
| 2471070 | 5 |
| 2471075 | 0 |
| 2471083 | 15 |
| 2471090 | 0 |
| 2471095 | 0 |
| 2471100 | 5 |
| 2471105 | 45 |
| 2471110 | 15 |
| 2471115 | 10 |
| 2471125 | 5 |
| 2471133 | 0 |
| 2471140 | 0 |
| 2472005 | 15 |
| 2472010 | 0 |
| 2472015 | 0 |
| 2472020 | 0 |
| 2472025 | 0 |
| 2472032 | 0 |
| 2472043 | 0 |
| 2473005 | 5 |
| 2473010 | 0 |
| 2473015 | 0 |
| 2473020 | 5 |
| 2473025 | 0 |
| 2473030 | 0 |
| 2473035 | 0 |
| 2474005 | 5 |
| 2475005 | 0 |
| 2475017 | 5 |
| 2475028 | 0 |
| 2475040 | 0 |
| 2475045 | 0 |
| 2476008 | 20 |
| 2476020 | 5 |
| 2476025 | 0 |
| 2476030 | 0 |
| 2476035 | 0 |
| 2476043 | 35 |
| 2476052 | 45 |
| 2476055 | 0 |
| 2476065 | 20 |
| 2477011 | 0 |
| 2477012 | 0 |
| 2477022 | 0 |
| 2477030 | 0 |
| 2477035 | 0 |
| 2477043 | 0 |
| 2477050 | 0 |
| 2477055 | 0 |
| 2477060 | 0 |
| 2477065 | 0 |
| 2478005 | 0 |
| 2478010 | 0 |
| 2478015 | 0 |
| 2478020 | 0 |
| 2478032 | 0 |
| 2478042 | 0 |
| 2478047 | 0 |
| 2478050 | 0 |
| 2478055 | 0 |
| 2478060 | 15 |
| 2478065 | 0 |
| 2478070 | 0 |
| 2478075 | 0 |
| 2478095 | 0 |
| 2478100 | 0 |
| 2478102 | 0 |
| 2478115 | 0 |
| 2478120 | 0 |
| 2478127 | 0 |
| 2478130 | 0 |
| 2479005 | 0 |
| 2479010 | 0 |
| 2479015 | 0 |
| 2479022 | 0 |
| 2479025 | 0 |
| 2479030 | 0 |
| 2479037 | 0 |
| 2479047 | 0 |
| 2479050 | 0 |
| 2479060 | 0 |
| 2479065 | 0 |
| 2479078 | 0 |
| 2479088 | 0 |
| 2479097 | 0 |
| 2479105 | 0 |
| 2479110 | 0 |
| 2479115 | 0 |
| 2480005 | 0 |
| 2480010 | 0 |
| 2480015 | 0 |
| 2480020 | 0 |
| 2480027 | 0 |
| 2480037 | 0 |
| 2480045 | 0 |
| 2480050 | 0 |
| 2480055 | 20 |
| 2480060 | 0 |
| 2480065 | 0 |
| 2480070 | 0 |
| 2480078 | 0 |
| 2480085 | 10 |
| 2480090 | 0 |
| 2480095 | 0 |
| 2480103 | 0 |
| 2480110 | 0 |
| 2480115 | 0 |
| 2480125 | 0 |
| 2480130 | 0 |
| 2480135 | 0 |
| 2480140 | 0 |
| 2480145 | 0 |
| 2481017 | 110 |
| 2482005 | 5 |
| 2482010 | 0 |
| 2482015 | 35 |
| 2482020 | 20 |
| 2482025 | 15 |
| 2482030 | 80 |
| 2482035 | 70 |
| 2483005 | 10 |
| 2483010 | 20 |
| 2483015 | 0 |
| 2483020 | 0 |
| 2483032 | 15 |
| 2483040 | 0 |
| 2483045 | 0 |
| 2483050 | 0 |
| 2483055 | 0 |
| 2483060 | 0 |
| 2483065 | 0 |
| 2483070 | 0 |
| 2483075 | 0 |
| 2483085 | 0 |
| 2483088 | 0 |
| 2483090 | 5 |
| 2483095 | 0 |
| 2483802 | 0 |
| 2484005 | 25 |
| 2484010 | 10 |
| 2484015 | 95 |
| 2484020 | 5 |
| 2484025 | 0 |
| 2484030 | 10 |
| 2484035 | 5 |
| 2484040 | 40 |
| 2484045 | 5 |
| 2484050 | 0 |
| 2484055 | 10 |
| 2484060 | 0 |
| 2484065 | 0 |
| 2484070 | 0 |
| 2484082 | 30 |
| 2484090 | 5 |
| 2484095 | 0 |
| 2484100 | 0 |
| 2485005 | 0 |
| 2485010 | 0 |
| 2485015 | 0 |
| 2485020 | 0 |
| 2485025 | 0 |
| 2485030 | 0 |
| 2485037 | 0 |
| 2485045 | 0 |
| 2485050 | 0 |
| 2485055 | 0 |
| 2485060 | 0 |
| 2485065 | 0 |
| 2485070 | 0 |
| 2485075 | 0 |
| 2485080 | 0 |
| 2485085 | 0 |
| 2485090 | 0 |
| 2485095 | 0 |
| 2485100 | 0 |
| 2485105 | 0 |
| 2485802 | 0 |
| 2485803 | 0 |
| 2485804 | 0 |
| 2485806 | 0 |
| 2485905 | 0 |
| 2486042 | 0 |
| 2487005 | 0 |
| 2487010 | 0 |
| 2487015 | 0 |
| 2487020 | 0 |
| 2487025 | 0 |
| 2487030 | 0 |
| 2487035 | 0 |
| 2487042 | 0 |
| 2487050 | 0 |
| 2487058 | 0 |
| 2487070 | 0 |
| 2487075 | 0 |
| 2487080 | 0 |
| 2487085 | 0 |
| 2487090 | 0 |
| 2487095 | 0 |
| 2487100 | 0 |
| 2487105 | 0 |
| 2487110 | 0 |
| 2487115 | 0 |
| 2487120 | 0 |
| 2487904 | 0 |
| 2488005 | 0 |
| 2488010 | 0 |
| 2488015 | 0 |
| 2488022 | 0 |
| 2488030 | 0 |
| 2488035 | 0 |
| 2488040 | 0 |
| 2488045 | 0 |
| 2488050 | 0 |
| 2488055 | 0 |
| 2488060 | 0 |
| 2488065 | 0 |
| 2488070 | 0 |
| 2488075 | 0 |
| 2488080 | 0 |
| 2488085 | 0 |
| 2488090 | 0 |
| 2488802 | 0 |
| 2488902 | 0 |
| 2488904 | 0 |
| 2489008 | 0 |
| 2489010 | 0 |
| 2489015 | 0 |
| 2489040 | 0 |
| 2489045 | 0 |
| 2489050 | 0 |
| 2489802 | 0 |
| 2489804 | 0 |
| 2490012 | 0 |
| 2490017 | 0 |
| 2490027 | 0 |
| 2490802 | 0 |
| 2490804 | 0 |
| 2491005 | 0 |
| 2491010 | 0 |
| 2491015 | 0 |
| 2491020 | 0 |
| 2491025 | 0 |
| 2491030 | 0 |
| 2491035 | 0 |
| 2491042 | 0 |
| 2491050 | 0 |
| 2491802 | 0 |
| 2492005 | 0 |
| 2492010 | 0 |
| 2492015 | 0 |
| 2492022 | 0 |
| 2492030 | 0 |
| 2492040 | 0 |
| 2492045 | 0 |
| 2492050 | 0 |
| 2492055 | 0 |
| 2492060 | 0 |
| 2492065 | 0 |
| 2492070 | 0 |
| 2492902 | 0 |
| 2492904 | 0 |
| 2493005 | 0 |
| 2493012 | 0 |
| 2493020 | 0 |
| 2493025 | 0 |
| 2493030 | 0 |
| 2493035 | 0 |
| 2493042 | 0 |
| 2493045 | 0 |
| 2493055 | 0 |
| 2493060 | 0 |
| 2493065 | 0 |
| 2493070 | 0 |
| 2493075 | 0 |
| 2493080 | 0 |
| 2493908 | 0 |
| 2494068 | 0 |
| 2494205 | 0 |
| 2494210 | 0 |
| 2494215 | 0 |
| 2494220 | 0 |
| 2494225 | 0 |
| 2494230 | 0 |
| 2494235 | 0 |
| 2494240 | 0 |
| 2494245 | 0 |
| 2494250 | 0 |
| 2494255 | 0 |
| 2494260 | 0 |
| 2494265 | 0 |
| 2495005 | 0 |
| 2495010 | 0 |
| 2495018 | 0 |
| 2495025 | 0 |
| 2495032 | 0 |
| 2495040 | 0 |
| 2495045 | 0 |
| 2495050 | 0 |
| 2495802 | 0 |
| 2496005 | 0 |
| 2496010 | 0 |
| 2496015 | 0 |
| 2496020 | 0 |
| 2496025 | 0 |
| 2496030 | 0 |
| 2496035 | 0 |
| 2496040 | 0 |
| 2496802 | 0 |
| 2496902 | 0 |
| 2497007 | 0 |
| 2497022 | 0 |
| 2497035 | 0 |
| 2497040 | 0 |
| 2497802 | 0 |
| 2497804 | 0 |
| 2497806 | 0 |
| 2497808 | 0 |
| 2497810 | 0 |
| 2497904 | 0 |
| 2498005 | 5 |
| 2498010 | 0 |
| 2498012 | 0 |
| 2498014 | 5 |
| 2498015 | 0 |
| 2498020 | 0 |
| 2498025 | 0 |
| 2498030 | 0 |
| 2498035 | 0 |
| 2498040 | 0 |
| 2498045 | 0 |
| 2498050 | 0 |
| 2498055 | 0 |
| 2498802 | 0 |
| 2498804 | 0 |
| 2498806 | 0 |
| 2498808 | 0 |
| 2499005 | 0 |
| 2499015 | 0 |
| 2499020 | 0 |
| 2499025 | 0 |
| 2499060 | 0 |
| 2499075 | 0 |
| 2499080 | 0 |
| 2499085 | 0 |
| 2499090 | 0 |
| 2499095 | 0 |
| 2499100 | 0 |
| 2499105 | 0 |
| 2499110 | 0 |
| 2499115 | 0 |
| 2499120 | 0 |
| 2499125 | 0 |
| 2499130 | 0 |
| 2499135 | 0 |
| 2499140 | 0 |
| 2499802 | 0 |
| 2499804 | 0 |
| 2499806 | 0 |
| 2499808 | 0 |
| 2499810 | 0 |
| 2499812 | 0 |
| 2499814 | 0 |
| 2499816 | 0 |
| 2499818 | 0 |
Map 2.b shows the number of Anglophone agricultural workers in each municipality of the province. In 2016, six municipalities had 100 or more Anglophone agricultural workers: Montréal (540 workers) in the Montréal–Laval CAR; Très-Saint-Sacrement (115 workers), Hinchinbrooke (110 workers), Ormstown (100 workers) and Lac-Brome (100 workers) in the Montérégie CAR; and Gatineau (115 workers) in the Outaouais CAR.
2.1 Age group
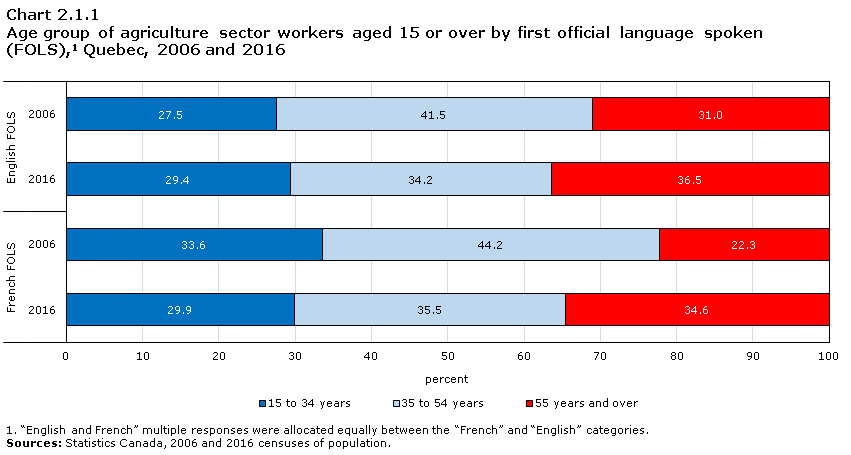
Data table for Chart 2.1.1
| 15 to 34 years | 35 to 54 years | 55 years and over | |
|---|---|---|---|
| percent | |||
| English FOLS | |||
| 2006 | 27.5 | 41.5 | 31.0 |
| 2016 | 29.4 | 34.2 | 36.5 |
| French FOLS | |||
| 2006 | 33.6 | 44.2 | 22.3 |
| 2016 | 29.9 | 35.5 | 34.6 |
|
|||
As with the total working population in Quebec, the Anglophone agricultural worker population was aging between 2006 and 2016: the median age of Anglophone agricultural workers increased from 46.4 years to 48.1 years and the proportion of these workers who were aged 55 years or older rose from 31.0% to 36.5% over the decade. However, the proportion of young Anglophone agricultural workers aged 15 to 34 years rose slightly between 2006 (27.5%) and 2016 (29.4%).
Anglophone agricultural workers were generally older than their Francophone counterparts in 2006, but their age profiles were more similar in 2016. The median age of Anglophone agricultural workers was higher than that of their Francophone counterparts (46.4 years versus 43.6 years) in 2006, but this was no longer the case in 2016 (48.1 years for both Anglophones and Francophones). In 2016, there were few differences between the age groups of Anglophone and Francophone agricultural workers.
This finding differs from the results for farm operators on English-language farms. In 2016, the share of English-language farms operated exclusively by persons aged 55 years or older (46.6%) was higher than that of French-language farms (40.1%).
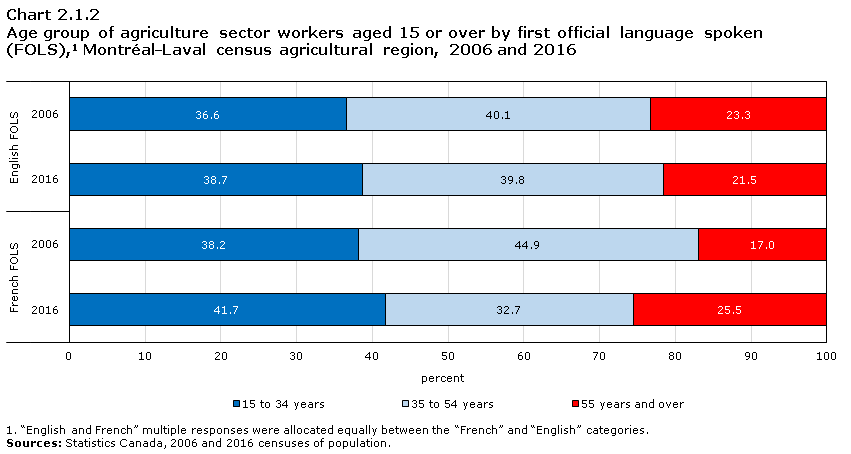
Data table for Chart 2.1.2
| 15 to 34 years | 35 to 54 years | 55 years and over | |
|---|---|---|---|
| percent | |||
| English FOLS | |||
| 2006 | 36.6 | 40.1 | 23.3 |
| 2016 | 38.7 | 39.8 | 21.5 |
| French FOLS | |||
| 2006 | 38.2 | 44.9 | 17.0 |
| 2016 | 41.7 | 32.7 | 25.5 |
|
|||
In contrast to the provincial situation, aging of Anglophone agricultural workers was not observed in the Montréal–Laval CAR between 2006 and 2016. The median age of these workers decreased slightly over the decade (from 42.3 years in 2006 to 41.3 years in 2016), as did the proportion of workers aged 55 or older (from 23.3% in 2006 to 21.5% in 2016). In addition, the proportion of Anglophone agricultural workers aged 15 to 34 increased between 2006 (36.6%) and 2016 (38.7%). Anglophone agricultural workers in this CAR, who were already generally younger than their counterparts across the province in 2006, were even younger in 2016.
Like their Anglophone counterparts, Francophone agricultural workers in Montréal–Laval were also younger than their peers across the province. In this CAR, the median age of Francophone agricultural workers decreased faster than that of their Anglophone counterparts between 2006 (43.2 years) and 2016 (39.9 years). In 2016, the proportions of Francophone agricultural workers aged 15 to 34 (41.7%) or 55 or older (25.5%) were higher than those of their Anglophone counterparts.
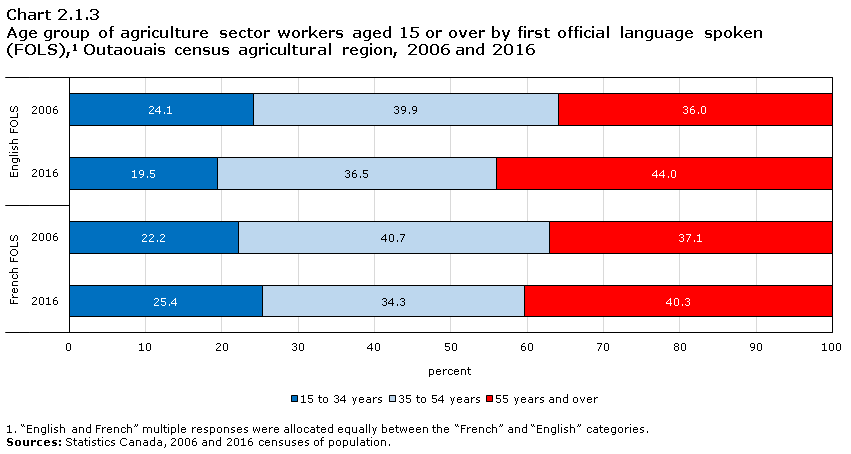
Data table for Chart 2.1.3
| 15 to 34 years | 35 to 54 years | 55 years and over | |
|---|---|---|---|
| percent | |||
| English FOLS | |||
| 2006 | 24.1 | 39.9 | 36.0 |
| 2016 | 19.5 | 36.5 | 44.0 |
| French FOLS | |||
| 2006 | 22.2 | 40.7 | 37.1 |
| 2016 | 25.4 | 34.3 | 40.3 |
|
|||
Anglophone agricultural workers in Outaouais were generally older than their Anglophone counterparts across the province. Their median age increased from 49.4 years in 2006 to 53.4 years in 2016. Over the decade, the proportion of Anglophone agricultural workers in Outaouais who were aged 55 years or older increased from 36.0% to 44.0% and the proportion of those that were 15 to 34 years of age decreased from 24.1% to 19.5%.
Francophone agricultural workers in Outaouais were relatively younger than their Anglophone counterparts. The median age of Francophone agricultural workers grew more slowly between 2006 (48.0 years) and 2016 (51.3 years) than that of their Anglophone counterparts. In 2016, the proportion of Francophone agricultural workers aged 15 to 34 years (25.4%) was higher than that of their Anglophone counterparts, and the proportion of Francophone agricultural workers aged 55 years or older (40.3%) was lower than that of their Anglophone counterparts.
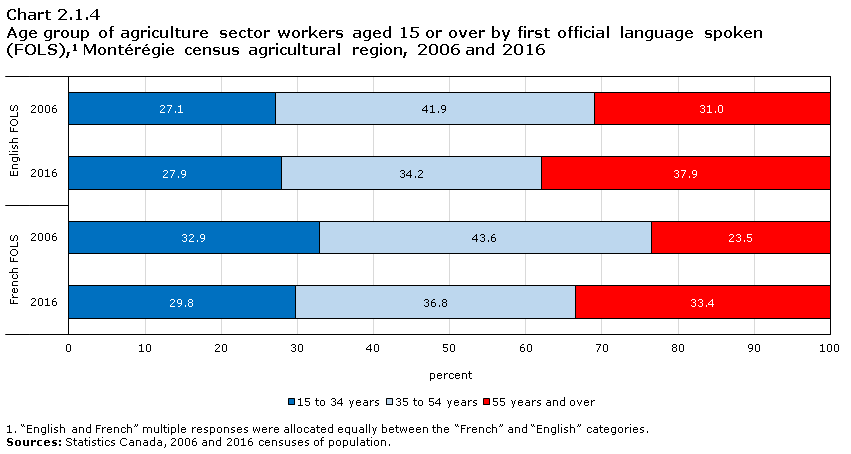
Data table for Chart 2.1.4
| 15 to 34 years | 35 to 54 years | 55 years and over | |
|---|---|---|---|
| percent | |||
| English FOLS | |||
| 2006 | 27.1 | 41.9 | 31.0 |
| 2016 | 27.9 | 34.2 | 37.9 |
| French FOLS | |||
| 2006 | 32.9 | 43.6 | 23.5 |
| 2016 | 29.8 | 36.8 | 33.4 |
|
|||
In Montérégie, the age group distribution of Anglophone agricultural workers was similar to that of their Anglophone counterparts across the province. The median age of Anglophone agricultural workers in this CAR was 47.2 years in 2006 and 48.2 years in 2016.
Anglophone agricultural workers in Montérégie were slightly older than their Francophone counterparts, whose median age increased from 43.6 years in 2006 to 47.1 years in 2016. The proportion of Anglophone agricultural workers aged 55 or over (37.9%) was higher than that of their Francophone counterparts (33.4%) in 2016.
2.2 Sex
The representation of women among Quebec’s Anglophone agricultural workers improved between 2006 and 2016, with the proportion of women agricultural workers increasing from 30.8% to 34.2%. The proportion of women among the province’s Francophone agricultural workers was slightly lower in 2016 (33.0%) and remained steady from 2006 (33.1%).
In the Montréal–Laval CAR, the representation of women among Anglophone agricultural workers was higher than the provincial average in 2016, but not in 2006. The proportion of women among these workers increased from 27.0% to 37.8% over the decade. However, there were proportionally more women among their Francophone counterparts in 2006 (38.8%) and 2016 (41.8%).
While it rose between 2006 and 2016, the proportion of women among Anglophone agricultural workers in Outaouais (23.8% in 2006 and 28.9% in 2016) remained below the provincial average. These proportions were lower than those observed among their Francophone counterparts, although the proportion of women among these workers decreased between 2006 (37.6%) and 2016 (30.6%).
In Montérégie, the representation of women among Anglophone agricultural workers (32.7% in 2006 and 34.2% in 2016) was similar to the provincial average. These proportions were similar to those of their Francophone counterparts (33.7% in 2006 and 34.6% in 2016).2.3 Place of birth
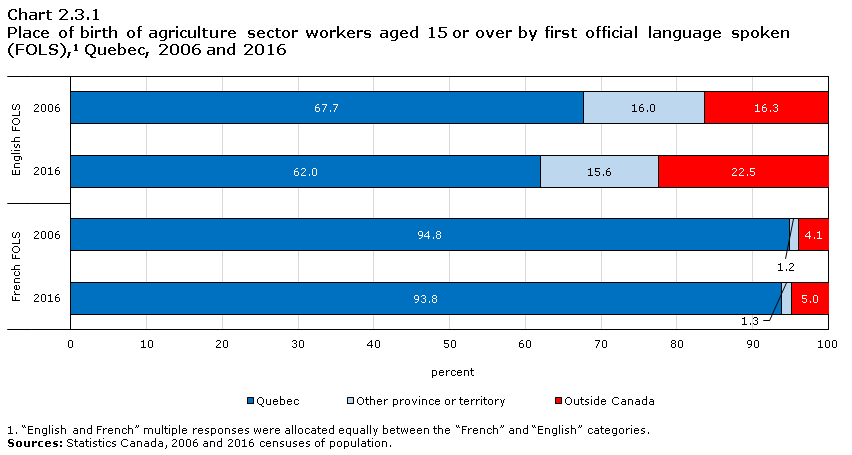
Data table for Chart 2.3.1
| Quebec | Other province or territory | Outside Canada | |
|---|---|---|---|
| percent | |||
| English FOLS | |||
| 2006 | 67.7 | 16.0 | 16.3 |
| 2016 | 62.0 | 15.6 | 22.5 |
| French FOLS | |||
| 2006 | 94.8 | 1.2 | 4.1 |
| 2016 | 93.8 | 1.3 | 5.0 |
|
|||
Just over three in five Anglophone agricultural workers in Quebec were born in the province in 2016, down from 2006 (67.7%). At the same time, the proportion of Anglophone agricultural workers born outside Canada increased from 16.3% in 2006 to 22.5% in 2016. The proportion of workers who were born in another province changed little over the decade (at just over 15%). In 2006 and in 2016, Anglophone agricultural workers were much less likely to be born in Quebec than their Francophone counterparts, of whom over 93% were born in the province.
In 2016, of Quebec’s Anglophone agricultural workers who were born in another province, 74.1% were born in Ontario. Among Anglophone agricultural workers born outside Canada, 38.3% were born in Asia, 31.0% were born elsewhere in the AmericasNote and 24.4% were born in Europe. The main countries of birth of these workers were the United States (18.0%) and India (14.3%).
Since the Anglophone agricultural worker population was relatively stable between 2006 and 2016, the increased proportion of these workers born outside Canada suggests a positive contribution from international migration to this population. In 2016, 6.3% of Anglophone agricultural workers in Quebec were immigrants who had obtained landed immigrant or permanent resident status between 2006 and 2016.
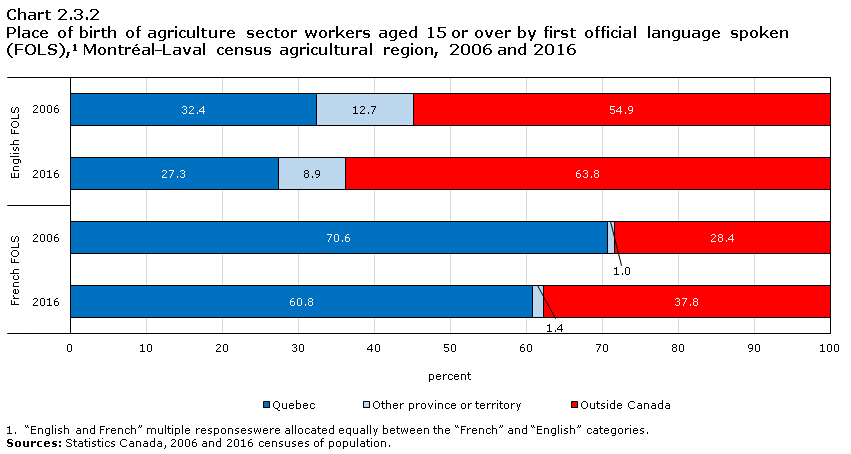
Data table for Chart 2.3.2
| Quebec | Other province or territory | Outside Canada | |
|---|---|---|---|
| percent | |||
| English FOLS | |||
| 2006 | 32.4 | 12.7 | 54.9 |
| 2016 | 27.3 | 8.9 | 63.8 |
| French FOLS | |||
| 2006 | 70.6 | 1.0 | 28.4 |
| 2016 | 60.8 | 1.4 | 37.8 |
|
|||
The situation in the Montréal–Laval CAR was different from that of Quebec as a whole. More than half of Anglophone agricultural workers were born outside Canada and this figure increased between 2006 (54.9%) and 2016 (63.8%). The proportion of workers born in another province declined over the decade, from 12.7% to 8.9%. In 2016, about 27% of Anglophone agricultural workers in Montréal–Laval were born in Quebec, compared with more than 60% for their Francophone counterparts.
In 2016, Anglophone agricultural workers born in a province other than Quebec were mostly born in Ontario (57.3%). Anglophone agricultural workers born outside Canada were largely from Asia (66.4%), elsewhere in the Americas (14.8%) or Europe (13.7%), with India being the country of origin for 28.8% of these workers. This means that in 2016, just under one in five Anglophone agricultural workers in the Montréal–Laval CAR were born in India.
The location of the Montréal–Laval CAR at the centre of the Montréal census metropolitan area (CMA) is largely responsible for the increasing diversity of the places of birth of people working in the agriculture industry, as the Montréal CMA is a popular destination for immigrants. In 2016, around one in four Anglophone agricultural workers in Montréal–Laval was an immigrant who had obtained landed immigrant or permanent resident status between 2006 and 2016.
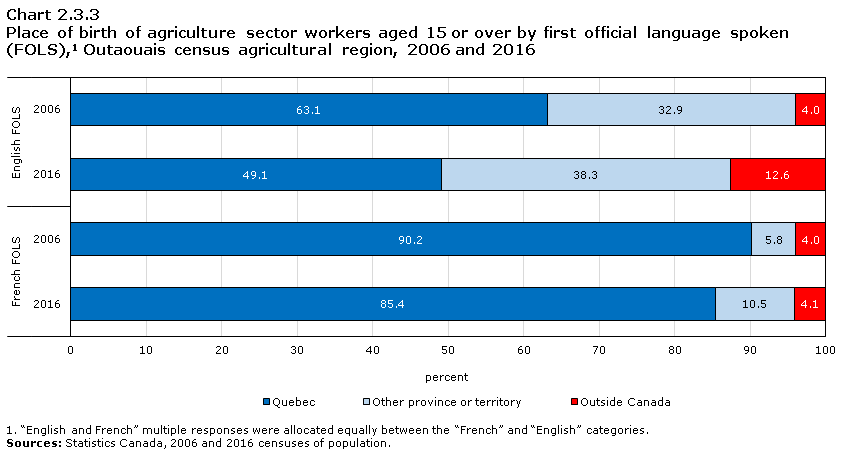
Data table for Chart 2.3.3
| Quebec | Other province or territory | Outside Canada | |
|---|---|---|---|
| percent | |||
| English FOLS | |||
| 2006 | 63.1 | 32.9 | 4.0 |
| 2016 | 49.1 | 38.3 | 12.6 |
| French FOLS | |||
| 2006 | 90.2 | 5.8 | 4.0 |
| 2016 | 85.4 | 10.5 | 4.1 |
|
|||
The proportion of Anglophone agricultural workers in Outaouais who were born in Quebec decreased between 2006 (63.1%) and 2016 (49.1%), while the proportion of these workers who were born in another province increased from 32.9% to 38.3%. In 2016, about one in eight Anglophone agricultural workers were born outside Canada.
The proportion of Anglophone agricultural workers born in Quebec was much lower than that of their Francophone counterparts in 2016 (49.1% versus 85.4%). Anglophone agricultural workers in Outaouais were nearly four times more likely to be born in another province and about three times more likely to be born outside Canada than their Francophone counterparts.
In 2016, Anglophone agricultural workers in Outaouais who were born outside Canada were mostly from Europe (52.7%) or elsewhere in the Americas (33.9%). A large share of Anglophone agricultural workers born in another province were born in Ontario (88.6%). Thus, in 2016, one-third of all Anglophone agricultural workers in Outaouais were born in Ontario. This province’s geographic proximity to the Outaouais region may be the reason for the high proportion of Anglophone agricultural workers who were born there.
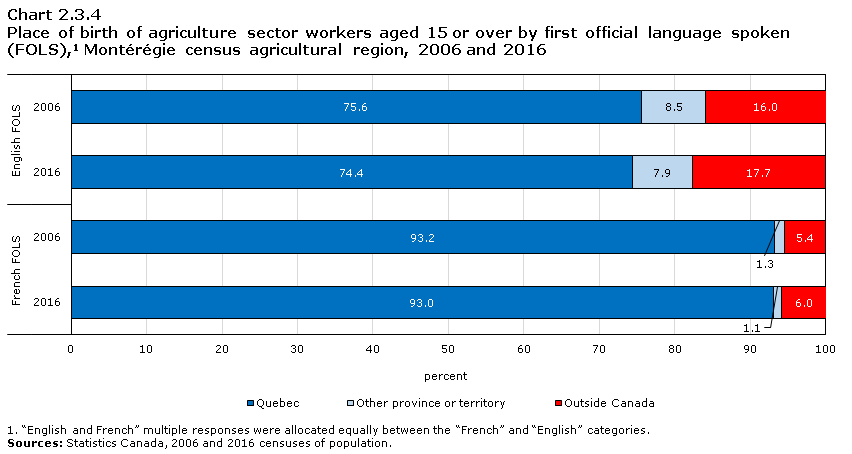
Data table for Chart 2.3.4
| Quebec | Other province or territory | Outside Canada | |
|---|---|---|---|
| percent | |||
| English FOLS | |||
| 2006 | 75.6 | 8.5 | 16.0 |
| 2016 | 74.4 | 7.9 | 17.7 |
| French FOLS | |||
| 2006 | 93.2 | 1.3 | 5.4 |
| 2016 | 93.0 | 1.1 | 6.0 |
|
|||
The places of birth of Anglophone agricultural workers in Montérégie were similar in 2006 and 2016. In this CAR, about three in four Anglophone agricultural workers were born in Quebec, a lower proportion than that of their Francophone counterparts (93.0% in 2016).
In 2016, 70.9% of Anglophone agricultural workers in Montérégie who were born in a province other than Quebec were born in Ontario. Among their counterparts born outside Canada, 39.3% were born in Europe, 38.0% were born elsewhere in the Americas, and 19.3% were born in Asia. The United States was the country of birth of around one in four Anglophone agricultural workers in Montérégie who were born outside Canada.
2.4 Indigenous identity
In Quebec, the number of IndigenousNote agricultural workers rose from 570 to 1,095 between 2006 and 2016. The proportion of these workers whose first official language spoken (FOLS) was English decreased from 14.9% in 2006 to 12.0% in 2016. All Indigenous agricultural workers in the province knew English or French in 2016, and 3.6% knew an Indigenous language.
The number of Indigenous agricultural workers was very small in the Montréal–Laval CAR in both 2006 and 2016.
In Outaouais, there were 60 Indigenous agricultural workers in 2006 and 120 in 2016. English was the FOLS of about a third of them in 2016.
And finally, in Montérégie, the number of Indigenous agricultural workers rose from 105 to 185 between 2006 and 2016. Nearly one in six had English as their FOLS in 2016. In 2006, this was the case for around a quarter of them.
The strong growth in the number of Indigenous agricultural workers between 2006 and 2016 in Quebec is possibly due to changes in the reported identities of these workers over the decadeNote .
2.5 Education
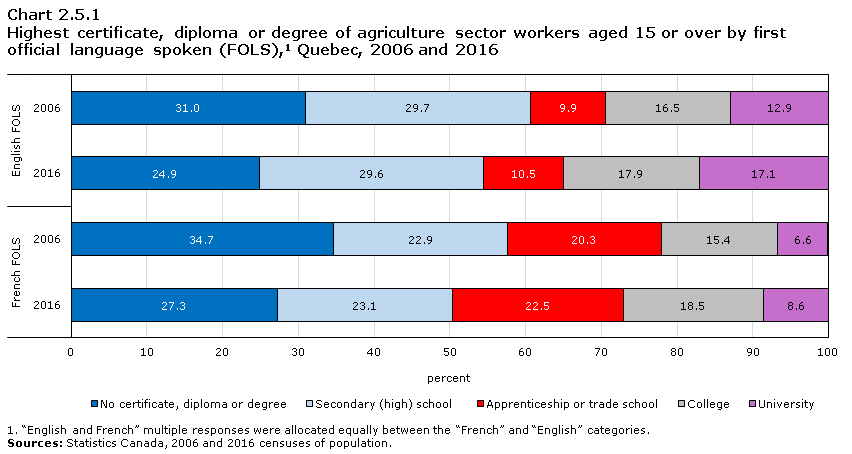
Data table for Chart 2.5.1
| No certificate, diploma or degree | Secondary (high) school | Apprenticeship or trade school | College | University | |
|---|---|---|---|---|---|
| percent | |||||
| English FOLS | |||||
| 2006 | 31.0 | 29.7 | 9.9 | 16.5 | 12.9 |
| 2016 | 24.9 | 29.6 | 10.5 | 17.9 | 17.1 |
| French FOLS | |||||
| 2006 | 34.7 | 22.9 | 20.3 | 15.4 | 6.6 |
| 2016 | 27.3 | 23.1 | 22.5 | 18.5 | 8.6 |
|
|||||
Educational attainment among Quebec’s Anglophone agricultural workers generally improved between 2006 and 2016. The share of these workers who did not have a certificate, diploma or degree declined over the decade, from 31.0% to 24.9%, while the share of Anglophone agricultural workers for whom university was the highest qualification increased from 12.9% in 2006 to 17.1% in 2016.
In 2016, the proportion of Anglophone agricultural workers with a university degree was nearly twice that of their Francophone counterparts (8.6%). However, the proportion of Anglophone workers with a diploma above the high school levelNote (45.5%) was lower than that of their Francophone counterparts (49.6%), particularly since Anglophone agricultural workers were more than two times less likely to have an apprenticeship or trades diploma as their highest qualification, compared to their Francophone counterparts (10.5% versus 22.5%).
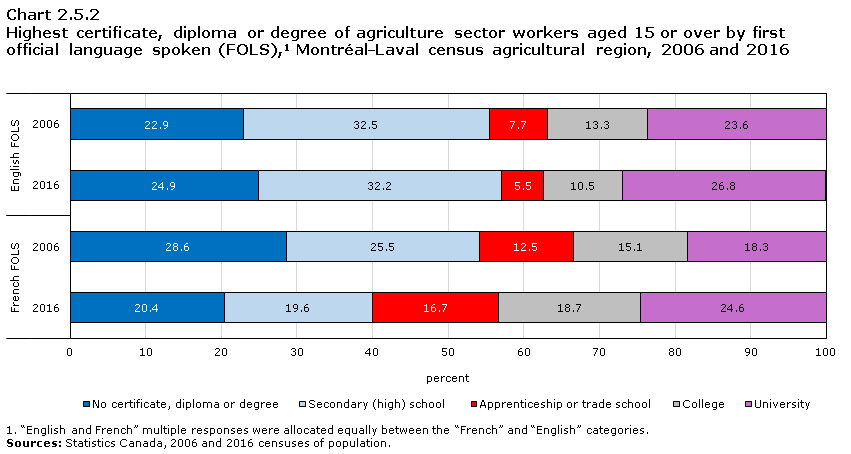
Data table for Chart 2.5.2
| No certificate, diploma or degree | Secondary (high) school | Apprenticeship or trade school | College | University | |
|---|---|---|---|---|---|
| percent | |||||
| English FOLS | |||||
| 2006 | 22.9 | 32.5 | 7.7 | 13.3 | 23.6 |
| 2016 | 24.9 | 32.2 | 5.5 | 10.5 | 26.8 |
| French FOLS | |||||
| 2006 | 28.6 | 25.5 | 12.5 | 15.1 | 18.3 |
| 2016 | 20.4 | 19.6 | 16.7 | 18.7 | 24.6 |
|
|||||
The educational attainment of Anglophone agricultural workers in the Montréal–Laval CAR was similar in 2006 and 2016. However, the proportion of Anglophone agricultural workers whose highest qualification was at the collegeNote level declined slightly over the decade (from 13.3% to 10.5%), while the proportion of those with a university degree rose from 23.6% to 26.8%.
In 2016, Anglophone agricultural workers were more likely than their Francophone counterparts to have no certificate, diploma or degree (24.9% versus 20.4%), and to have secondary education as their highest qualification (32.2% versus 19.6%). The proportion of Anglophone agricultural workers with a postsecondary degree (42.8%) was therefore below that of their Francophone counterparts (60.0%) in 2016, which was not the case in 2006. In 2016, Anglophone agricultural workers in the Montréal–Laval CAR were around three times less likely to have an apprenticeship or trades diploma as their highest qualification than their Francophone counterparts and nearly half as likely to have a college diploma as their highest qualification.
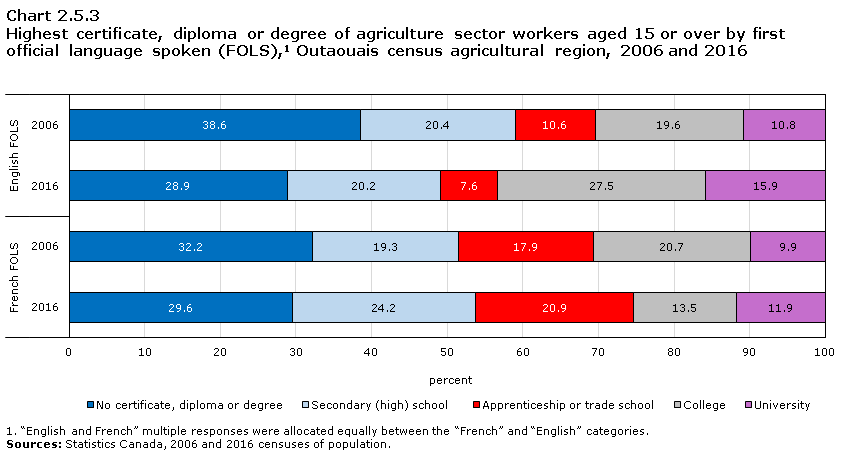
Data table for Chart 2.5.3
| No certificate, diploma or degree | Secondary (high) school | Apprenticeship or trade school | College | University | |
|---|---|---|---|---|---|
| percent | |||||
| English FOLS | |||||
| 2006 | 38.6 | 20.4 | 10.6 | 19.6 | 10.8 |
| 2016 | 28.9 | 20.2 | 7.6 | 27.5 | 15.9 |
| French FOLS | |||||
| 2006 | 32.2 | 19.3 | 17.9 | 20.7 | 9.9 |
| 2016 | 29.6 | 24.2 | 20.9 | 13.5 | 11.9 |
|
|||||
The educational attainment of Anglophone agricultural workers in Outaouais improved between 2006 and 2016. The proportion of these workers without a certificate, diploma or degree decreased over the decade (from 38.6% to 28.9%), but it remained higher than the provincial average for Anglophone agricultural workers (24.9% in 2016). On the other hand, the proportion of Anglophone agricultural workers in Outaouais who had a college or university degree increased from 30.4% in 2006 to 43.4% in 2016.
The proportion of Anglophone agricultural workers with an apprenticeship or trades diploma as their highest qualification (7.6%) was lower than that of their Francophone counterparts (20.9%) in 2016. However, Anglophone agricultural workers in Outaouais were about twice as likely to have a college diploma as their highest qualification (27.5%) than their Francophone counterparts (13.5%). Therefore, in contrast to the provincial trend, the share of Anglophone agricultural workers in Outaouais who completed postsecondary education (51.0%) was higher than that of Francophones (46.3%) in 2016.
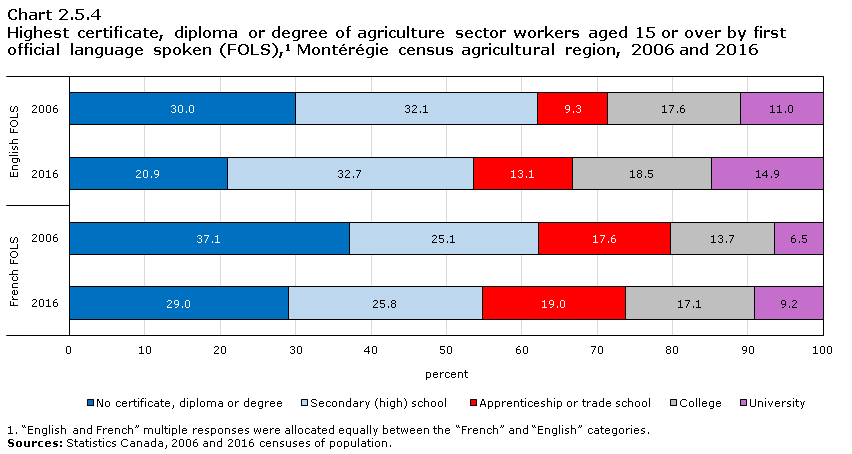
Data table for Chart 2.5.4
| No certificate, diploma or degree | Secondary (high) school | Apprenticeship or trade school | College | University | |
|---|---|---|---|---|---|
| percent | |||||
| English FOLS | |||||
| 2006 | 30.0 | 32.1 | 9.3 | 17.6 | 11.0 |
| 2016 | 20.9 | 32.7 | 13.1 | 18.5 | 14.9 |
| French FOLS | |||||
| 2006 | 37.1 | 25.1 | 17.6 | 13.7 | 6.5 |
| 2016 | 29.0 | 25.8 | 19.0 | 17.1 | 9.2 |
|
|||||
The proportion of Anglophone agricultural workers in Montérégie with no certificate, diploma or degree decreased between 2006 (30.0%) and 2016 (20.9%), while the share of these workers with college or university qualifications increased over the same period (from 28.6% to 33.4%).
The educational attainment of Anglophone agricultural workers was higher than that of their Francophone counterparts in Montérégie. In 2016, the proportion of Anglophone agricultural workers with no certificate, diploma or degree was lower than that of Francophones (20.9% versus 29.0%). The share of Anglophone agricultural workers with postsecondary education (46.5%) was similar to that of their Francophone peers (45.3%). However, more than one in seven Anglophone agricultural workers had a university degree, compared with less than one in ten Francophone agricultural workers.
2.6 Class of worker
Data table for Chart 2.6.1
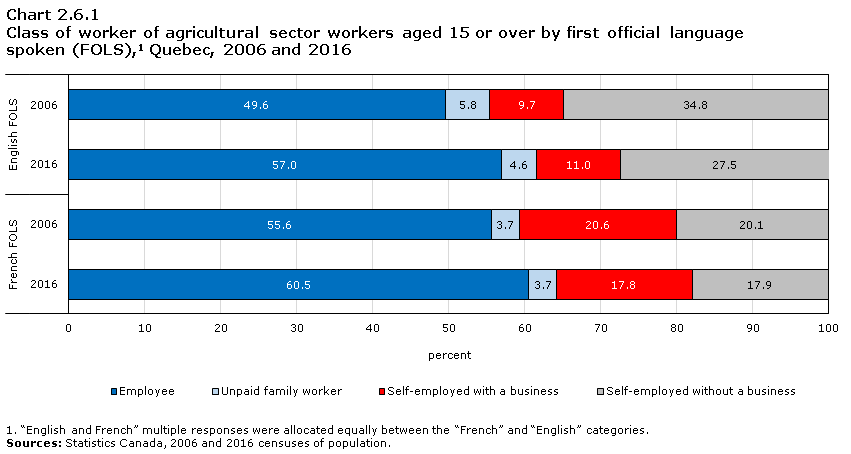
| Employee | Unpaid family worker | Self-employed with a business | Self-employed without a business | |
|---|---|---|---|---|
| percent | ||||
| English FOLS | ||||
| 2006 | 49.6 | 5.8 | 9.7 | 34.8 |
| 2016 | 57.0 | 4.6 | 11.0 | 27.5 |
| French FOLS | ||||
| 2006 | 55.6 | 3.7 | 20.6 | 20.1 |
| 2016 | 60.5 | 3.7 | 17.8 | 17.9 |
|
||||
The proportion of Anglophone agricultural workers who were employees increased between 2006 (49.6%) and 2016 (57.0%). By contrast, the proportion who were self-employed decreased during the same period (from 44.5% to 38.5%). Among self-employed Anglophones in the agriculture sector, the proportion who were incorporated increased between 2006 (21.8%) and 2016 (28.6%).
In 2016, the proportion of Anglophone agricultural workers who were self-employed was higher among Anglophones than among Francophones (35.7%). Around 50% of Francophone self-employed workers in the agriculture sector were incorporated, a higher proportion than that of their Anglophone peers.
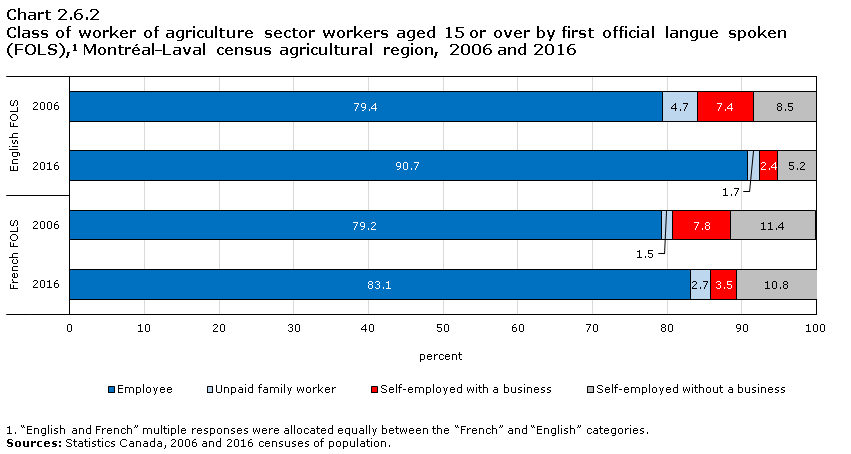
Data table for Chart 2.6.2
| Employee | Unpaid family worker | Self-employed with a business | Self-employed without a business | |
|---|---|---|---|---|
| percent | ||||
| English FOLS | ||||
| 2006 | 79.4 | 4.7 | 7.4 | 8.5 |
| 2016 | 90.7 | 1.7 | 2.4 | 5.2 |
| French FOLS | ||||
| 2006 | 79.2 | 1.5 | 7.8 | 11.4 |
| 2016 | 83.1 | 2.7 | 3.5 | 10.8 |
|
||||
Agricultural workers in the Montréal–Laval CAR were more likely to be employees than the provincial average. In 2016, more than nine in ten Anglophone agricultural workers were employees in this CAR. This proportion was higher than that of their Francophone counterparts (83.1%).
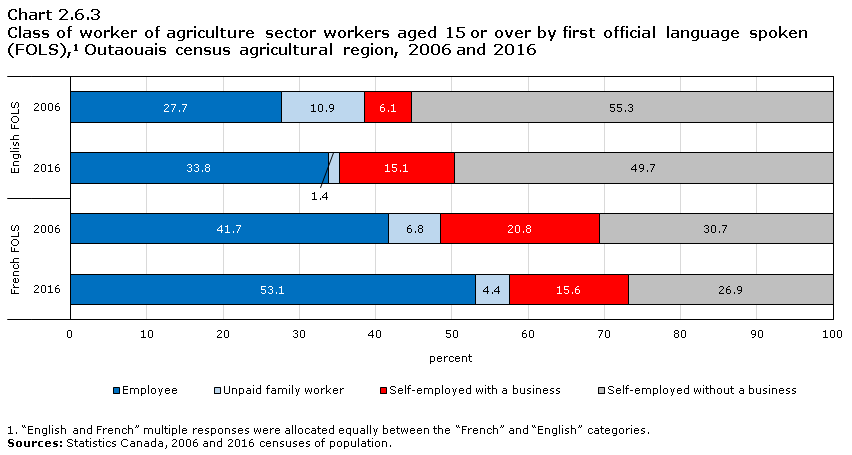
Data table for Chart 2.6.3
| Employee | Unpaid family worker | Self-employed with a business | Self-employed without a business | |
|---|---|---|---|---|
| percent | ||||
| English FOLS | ||||
| 2006 | 27.7 | 10.9 | 6.1 | 55.3 |
| 2016 | 33.8 | 1.4 | 15.1 | 49.7 |
| French FOLS | ||||
| 2006 | 41.7 | 6.8 | 20.8 | 30.7 |
| 2016 | 53.1 | 4.4 | 15.6 | 26.9 |
|
||||
Anglophone agricultural workers in the Outaouais CAR differed from their counterparts across the province by their high proportion of self-employed workers (61.4% in 2006 and 64.8% in 2016). The proportion of these self-employed workers who were incorporated increased over the decade, from about 10% to approximately 23%. This proportion was lower than that of their Francophone counterparts. In 2016, nearly 37% of Francophone self-employed workers in the agriculture sector were incorporated.
The proportion of Anglophone agricultural workers who were employees also increased between 2006 (27.7%) and 2016 (33.8%). However, it remained lower than that of their Francophone counterparts, since more than half of Francophone agricultural workers were employees in 2016.
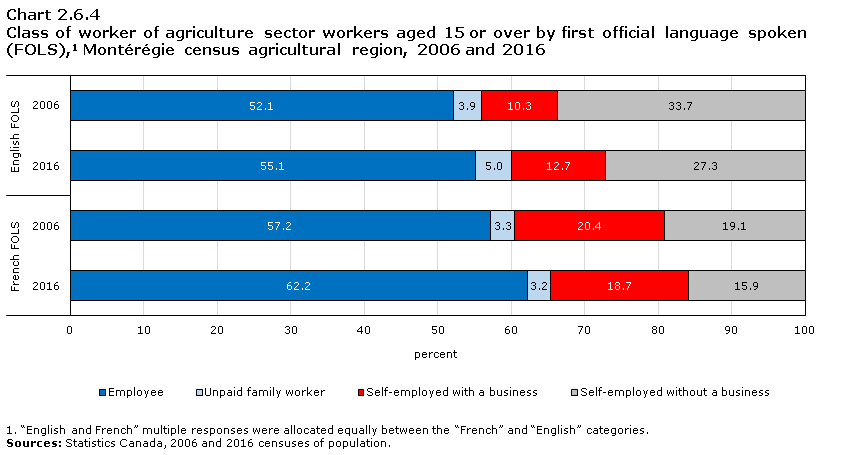
Data table for Chart 2.6.4
| Employee | Unpaid family worker | Self-employed with a business | Self-employed without a business | |
|---|---|---|---|---|
| percent | ||||
| English FOLS | ||||
| 2006 | 52.1 | 3.9 | 10.3 | 33.7 |
| 2016 | 55.1 | 5.0 | 12.7 | 27.3 |
| French FOLS | ||||
| 2006 | 57.2 | 3.3 | 20.4 | 19.1 |
| 2016 | 62.2 | 3.2 | 18.7 | 15.9 |
|
||||
In Montérégie, the proportion of Anglophone agricultural workers who were employees increased between 2006 and 2016 (from 52.1% to 55.1%) while the proportion who were self-employed decreased (from 44.0% to 40.0%). The proportion of Anglophone agricultural workers who were self-employed was higher than that of their Francophone counterparts (34.6%) in 2016.
2.7 Employment income
Employment income includes all income received as wages, salaries and commissions from paid employment and net self-employment income from farm or non-farm unincorporated business and/or professional practice during the calendar year prior to the census. The employment income of agriculture sector workers may include income from other sources than the job occupied in this sector.
This report contains information on all people categorized as workers, including those who worked during the reference week (for example, from May 1 to May 7, 2016) or the census year (e.g.: 2016), but who did not work in the year prior to the census (e.g.: 2015). However, because these workers did not work in the year prior to the census, their data are excluded from this section. They are identified by the category “not applicable” in the charts below and are excluded from the median income, work activity and average number of weeks worked per year calculations.
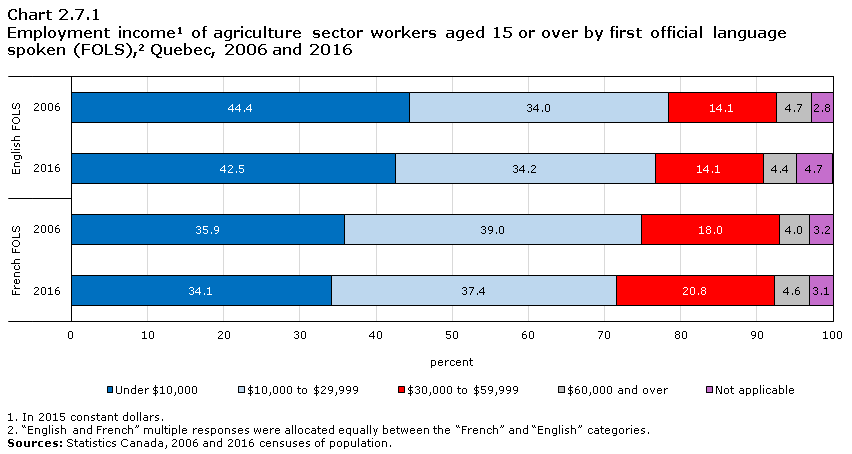
Data table for Chart 2.7.1
| Under $10,000 | $10,000 to $29,999 | $30,000 to $59,999 | $60,000 and over | Not applicable | |
|---|---|---|---|---|---|
| percent | |||||
| English FOLS | |||||
| 2006 | 44.4 | 34.0 | 14.1 | 4.7 | 2.8 |
| 2016 | 42.5 | 34.2 | 14.1 | 4.4 | 4.7 |
| French FOLS | |||||
| 2006 | 35.9 | 39.0 | 18.0 | 4.0 | 3.2 |
| 2016 | 34.1 | 37.4 | 20.8 | 4.6 | 3.1 |
|
|||||
The median employment incomeNote of Anglophone agricultural workers in Quebec was relatively stable between 2006 ($11,770) and 2016 ($11,620). In 2016, 42.5% of Anglophone agricultural workers in the province reported employment income of less than $10,000, and 18.5% had employment income of $30,000 or more.
The employment income of Anglophone agricultural workers was generally lower than that of their Francophone counterparts. Among the latter, 34.1% reported employment income under $10,000, and 25.4%, an employment income of $30,000 or more in 2016. Unlike Anglophone agricultural workers, between 2006 and 2016, the median employment income of Francophone agricultural workers increased from $14,475 to $15,755. Thus, the employment income gap between Anglophone and Francophone agricultural workers widened over the decade ($2,705 in 2006 and $4,135 in 2016).
The work pattern and average number of weeks worked per year reported by Anglophone agricultural workers may help explain their relatively lower employment income. In 2016, 75.2% of Anglophone agricultural workers worked full-time,Note compared with 78.3% of their Francophone counterparts. On average, Anglophone agricultural workers worked 40.6 weeks per year,Note compared with 40.9 for their Francophone counterparts.
Furthermore, the median income gap may be attributable to the lower share of Anglophone agricultural workers with a postsecondary degree, or the higher proportion of Anglophone agricultural workers who were born outside Canada, with immigrants experiencing additional challenges on the labour market.
Between 2006 and 2016, the median employment income gap between Anglophone men and women who worked in Quebec’s agricultural sector increased from $3,625 to $4,120. The median employment income of Anglophone women in this sector fell from $8,885 to $8,790 between 2006 and 2016, while that of men rose from $12,510 to $12,905 over the same period.
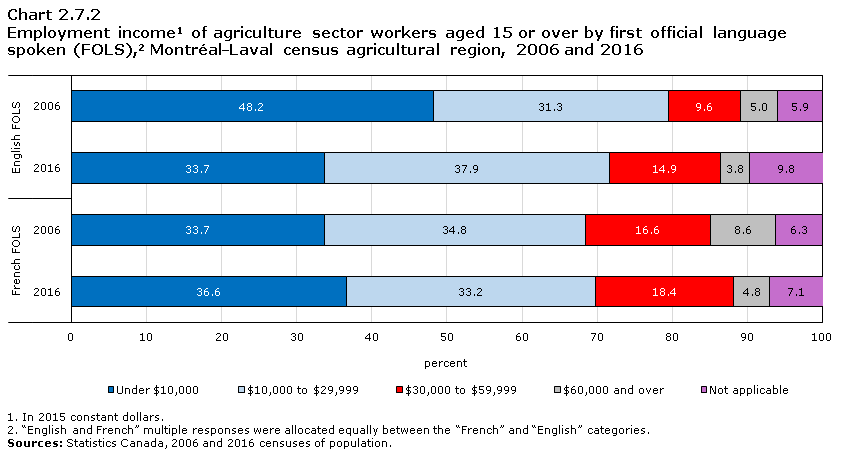
Data table for Chart 2.7.2
| Under $10,000 | $10,000 to $29,999 | $30,000 to $59,999 | $60,000 and over | Not applicable | |
|---|---|---|---|---|---|
| percent | |||||
| English FOLS | |||||
| 2006 | 48.2 | 31.3 | 9.6 | 4.97 | 5.9 |
| 2016 | 33.7 | 37.9 | 14.9 | 3.8 | 9.8 |
| French FOLS | |||||
| 2006 | 33.7 | 34.8 | 16.6 | 8.6 | 6.3 |
| 2016 | 36.6 | 33.2 | 18.4 | 4.8 | 7.1 |
|
|||||
The median employment income of Anglophone agricultural workers in Montréal–Laval increased between 2006 ($9,580) and 2016 ($12,070). The share of these workers with an employment income under $10,000 decreased over the decade, from 48.2% to 33.7%.
The employment income of Anglophone agricultural workers generally remained lower than that of their Francophone counterparts, in spite of the drop in the latter’s median employment income between 2006 ($15,510) and 2016 ($13,615). The proportion of Anglophone agricultural workers with an employment income of less than $10,000 (about 34%) was smaller than that of their Francophone counterparts in 2016 (more than 36%). Moreover, agricultural workers with employment income of $30,000 or more represented a lower proportion among Anglophones (18.7%) than Francophones (23.2%) in 2016.
In 2016, the proportion of agricultural workers in Montréal–Laval who worked full-time was similar among Anglophones (73.3%) and Francophones (72.4%). On the other hand, Anglophone agricultural workers on average worked fewer weeks per years (30.7) than their Francophone counterparts (32.1).
Between 2006 and 2016, the median employment income of Anglophone women who worked in the Montréal–Laval agriculture sector increased from $7,975 to $10,635, and that of men, from $12,140 to $12,960. Thus, there was a narrowing of the income gap between Anglophone men and women who worked in the agriculture sector in this CAR from 2006 ($4,165) to 2016 ($2,325).
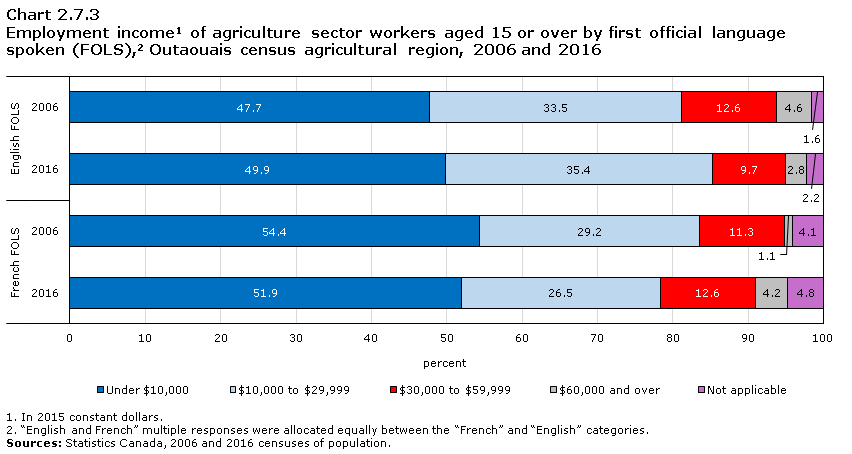
Data table for Chart 2.7.3
| Under $10,000 | $10,000 to $29,999 | $30,000 to $59,999 | $60,000 and over | Not applicable | |
|---|---|---|---|---|---|
| percent | |||||
| English FOLS | |||||
| 2006 | 47.7 | 33.5 | 12.6 | 4.6 | 1.6 |
| 2016 | 49.9 | 35.4 | 9.7 | 2.8 | 2.2 |
| French FOLS | |||||
| 2006 | 54.4 | 29.2 | 11.3 | 1.1 | 4.1 |
| 2016 | 51.9 | 26.5 | 12.6 | 4.2 | 4.8 |
|
|||||
The median employment income of Anglophone agricultural workers in Outaouais changed little between 2006 ($10,010) and 2016 ($9,810). However, the proportion of these workers with an employment income of less than $10,000 increased over the decade, from 47.7% to 49.9%, and the proportion with an employment incomes greater than or equal to $30,000 declined (from 17.2% to 12.5%).
The median employment income of Anglophone agricultural workers in Outaouais was higher than that of their Francophone counterparts ($8,590 in 2006 and $8,570 in 2016). In 2016, the proportion of Francophone agricultural workers with a low employment income of less than $10,000 (51.9%) was higher than that of their Anglophone counterparts. However, Francophone agricultural workers were also more likely to have an employment income above or equal to $30,000 (16.8%) than their Anglophone counterparts (12.5%) in 2016.
Unlike their counterparts in all of Quebec, Anglophone agricultural workers in Outaouais were somewhat more likely than their Francophone counterparts to be working full-time (78.1% versus 74.6%) in 2016. Anglophone agricultural workers in this CAR also worked, on average, more weeks per year (44.5) than their Francophone counterparts (39.4). The work pattern and average number of weeks worked annually by the Anglophone agricultural workers helps explain why their median employment income surpassed that of their Francophone counterparts.
In Outaouais, the median employment income gap between Anglophone men and women working in the agriculture sector decreased between 2006 ($7,590) and 2016 ($4,320). The median employment income of Anglophone women working in the agriculture sector increased from $4,215 in 2006 to $6,260 in 2016 while that of men decreased from $11,805 in 2006 to $10,580 in 2016.
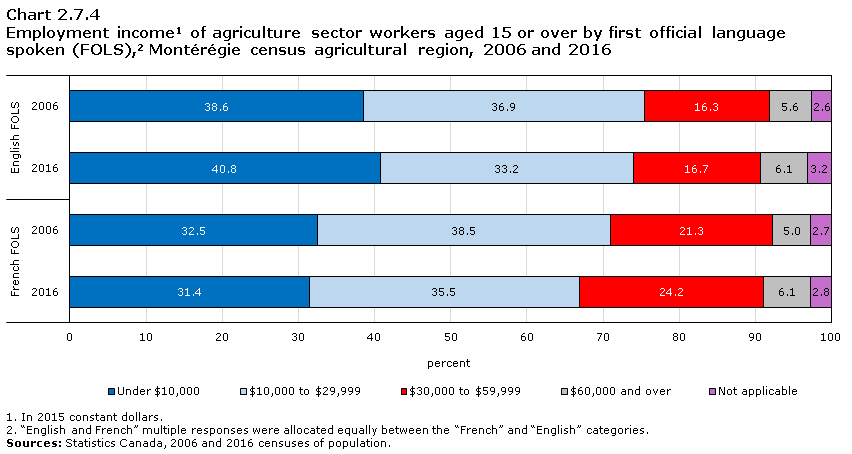
Data table for Chart 2.7.4
| Under $10,000 | $10,000 to $29,999 | $30,000 to $59,999 | $60,000 and over | Not applicable | |
|---|---|---|---|---|---|
| percent | |||||
| English FOLS | |||||
| 2006 | 38.6 | 36.9 | 16.3 | 5.6 | 2.6 |
| 2016 | 40.8 | 33.2 | 16.7 | 6.1 | 3.2 |
| French FOLS | |||||
| 2006 | 32.5 | 38.5 | 21.3 | 5.0 | 2.7 |
| 2016 | 31.4 | 35.5 | 24.2 | 6.1 | 2.8 |
|
|||||
The median employment income of Anglophone agricultural workers in Montérégie declined slightly between 2006 and 2016, from $14,150 to $13,175. The proportion of these workers earning employment income of less than $10,000 increased between 2006 (38.6%) and 2016 (40.8%). The median employment income of Anglophone workers was lower than that of their Francophone counterparts. The latter’s employment income increased from $17,230 in 2006 to $17,990 in 2016.
In 2016, the generally lower employment income of Anglophone agricultural workers in Montérégie was reflected in the proportion of these workers with employment income of less than $10,000 (40.8% for Anglophones versus 31.4% for Francophones) or with employment income of $30,000 or more (22.8% for Anglophones versus 30.3% for Francophones).
The proportion of Anglophone agricultural workers in Montérégie who worked full-time (77.1%), was similar to that of their Francophone counterparts (78.2%) in 2016. In addition, the average number of weeks worked per year was similar among Anglophone (42.4) and Francophone (41.7) agricultural workers.
The median employment income of Anglophone women working in Montérégie’s agriculture sector decreased between 2006 ($12,795) and 2016 ($9,060), while that of men remained relatively stable over the decade ($14,675 in 2006 and $15,580 in 2016). Thus, the median employment income gap between Anglophone men and women who were active in this CAR’s agricultural sector rose from $1,880 in 2006 to $6,520 in 2016.
2.8 Languages used at work
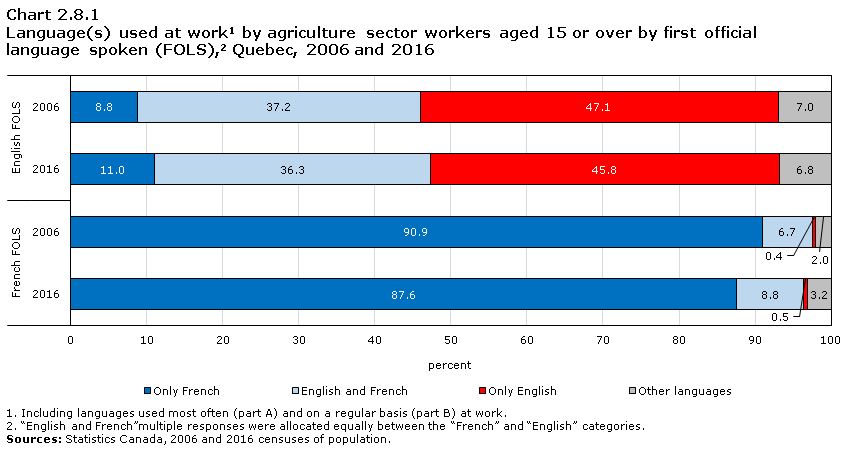
Data table for Chart 2.8.1
| Only French | English and French | Only English | Other languages | |
|---|---|---|---|---|
| percent | ||||
| English FOLS | ||||
| 2006 | 8.8 | 37.2 | 47.1 | 7.0 |
| 2016 | 11.0 | 36.3 | 45.8 | 6.8 |
| French FOLS | ||||
| 2006 | 90.9 | 6.7 | 0.4 | 2.0 |
| 2016 | 87.6 | 8.8 | 0.5 | 3.2 |
|
||||
The languages used at work by Anglophone agricultural workers in Quebec were generally similar in 2006 and 2016. Between these two years, there was a slight decrease in the proportion of these workers who used only EnglishNote at work (from 47.1% to 45.8%) and a slight increase in the proportion who used only FrenchNote (from 8.8% to 11.0%). In 2016, more than 36% of the province’s agricultural workers used English and FrenchNote at work, while just under 9% of their Francophone counterparts did so. Moreover, in 2016, nearly 7% of Anglophone agricultural workers used a language otherNote than English or French at work, more than double the proportion of their Francophone counterparts.
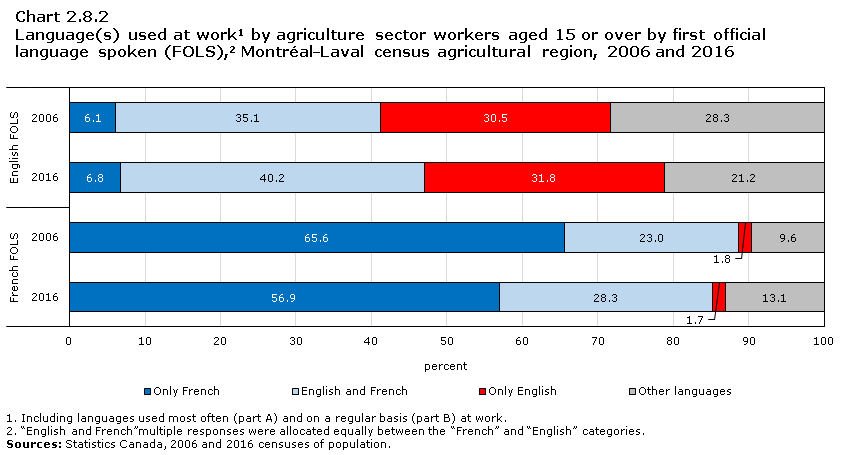
Data table for Chart 2.8.2
| Only French | English and French | Only English | Other languages | |
|---|---|---|---|---|
| percent | ||||
| English FOLS | ||||
| 2006 | 6.1 | 35.1 | 30.5 | 28.3 |
| 2016 | 6.8 | 40.2 | 31.8 | 21.2 |
| French FOLS | ||||
| 2006 | 65.6 | 23.0 | 1.8 | 9.6 |
| 2016 | 56.9 | 28.3 | 1.7 | 13.1 |
|
||||
Anglophone agricultural workers in the Montréal–Laval CAR differed from their counterparts in all of Quebec in terms of the proportion using a language other than English or French at work. This proportion was 21.2% in 2016, which was down from 2006 (28.3%), but remained at least three times higher than the provincial average for Anglophone agricultural workers (about 7% in 2006 and 2016). About one in ten Anglophone agricultural workers in the Montréal–Laval CAR used Punjabi most often or regularly at work in 2016.
Between 2006 and 2016, the proportion of Anglophone agricultural workers who used only English at work was relatively stable at just over 30%. For those using English and French at work, the proportion increased between 2006 (35.1%) and 2016 (40.2%). In 2016, Anglophone agricultural workers were more likely to use English and French at work than their Francophone counterparts (28.3%). Less than 7% of Anglophone agricultural workers in Montréal–Laval used only French at work in 2016.
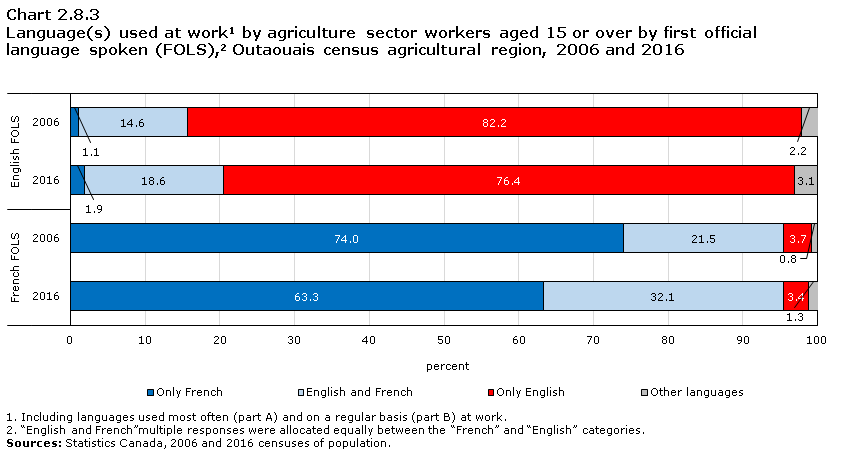
Data table for Chart 2.8.3
| Only French | English and French | Only English | Other languages | |
|---|---|---|---|---|
| percent | ||||
| English FOLS | ||||
| 2006 | 1.1 | 14.6 | 82.2 | 2.2 |
| 2016 | 1.9 | 18.6 | 76.4 | 3.1 |
| French FOLS | ||||
| 2006 | 74.0 | 21.5 | 3.7 | 0.8 |
| 2016 | 63.3 | 32.1 | 3.4 | 1.3 |
|
||||
The proportion of Anglophone agricultural workers in Outaouais who used only English at work decreased between 2006 (82.2%) and 2016 (76.4%). This proportion remained higher than that of all Anglophone agricultural workers in the province (45.8% in 2016). In Outaouais, the proportion of Anglophone agricultural workers who used English and French at work increased over the decade from 14.6% in 2006 to 18.6% in 2016.
In contrast to the provincial trend, Anglophone agricultural workers in Outaouais were less likely to use English and French at work than their Francophone counterparts. In 2016, nearly one in three Francophone agricultural workers used English and French at work, compared with less than one in five Anglophone agricultural workers.
The geographic proximity of Ontario, where English is the majority language, may explain why a higher proportion of Anglophone agricultural workers in the Outaouais region use only English at work, compared with the provincial average.
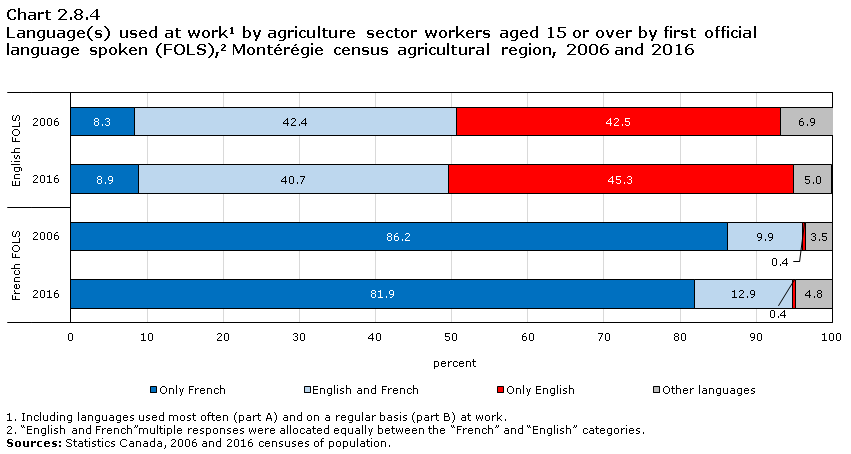
Data table for Chart 2.8.4
| Only French | English and French | Only English | Other languages | |
|---|---|---|---|---|
| percent | ||||
| English FOLS | ||||
| 2006 | 8.3 | 42.4 | 42.5 | 6.9 |
| 2016 | 8.9 | 40.7 | 45.3 | 5.0 |
| French FOLS | ||||
| 2006 | 86.2 | 9.9 | 0.4 | 3.5 |
| 2016 | 81.9 | 12.9 | 0.4 | 4.8 |
|
||||
The languages used at work by Anglophone agricultural workers in Montérégie were relatively similar in 2006 and 2016. There was a slight increase in the proportion of these workers who used only English at work, from 42.5% in 2006 to 45.3% in 2016. Meanwhile, the proportion of Anglophone agricultural workers who used both English and French at work decreased slightly between 2006 (42.4%) and 2016 (40.7%).
3. Social, economic and linguistic profile of English-speaking workers in Quebec’s agri-food industry
This section tracks the evolution of the social, economic and linguistic profile of English-speaking agri-food workers in Quebec between 2006 and 2016. Special consideration was paid to the CARs of Montréal–Laval, Outaouais, and Montérégie. In 2016, more than 4,000 Anglophone agri-food workers resided in each of these CARs – making up more than 11% of all workers in the agri-food sector of their respective CAR.Note
In this report, agri-food workers include any person 15 years of age or over who worked in the supply of inputs and services (e.g., farm support activities, agricultural supplies merchant wholesalers), food, beverage and tobacco processing (e.g., bakeries, meat product manufacturing, dairy product manufacturing), food retail and wholesale (e.g., grocery stores, food merchant wholesalers), and food services (e.g., restaurants). Table A.2 in Appendix A provides a detailed list of industries in the agri-food sector. The data presented in this section are from the 2006 and 2016 censuses of population.
| Census agricultural region | FOLS | |||||||
|---|---|---|---|---|---|---|---|---|
| 2006 | 2016 | |||||||
| English | French | Neither English nor French | Total | English | French | Neither English nor French | Total | |
| number | ||||||||
| Laurentides | 1,795 | 33,390 | 20 | 35,210 | 2,445 | 37,185 | 55 | 39,690 |
| Montérégie | 9,255 | 88,420 | 440 | 98,110 | 12,310 | 94,410 | 870 | 107,590 |
| Montréal–Laval | 44,260 | 91,135 | 2,195 | 137,585 | 55,195 | 102,270 | 2,955 | 160,415 |
| Outaouais | 3,515 | 15,375 | 25 | 18,915 | 4,535 | 16,880 | 105 | 21,515 |
| Total: Quebec | 63,915 | 430,105 | 2,890 | 496,910 | 81,405 | 467,365 | 4,270 | 553,045 |
| percent | ||||||||
| Laurentides | 5.1 | 94.8 | 0.1 | 100.0 | 6.2 | 93.7 | 0.1 | 100.0 |
| Montérégie | 9.4 | 90.1 | 0.4 | 100.0 | 11.4 | 87.8 | 0.8 | 100.0 |
| Montréal–Laval | 32.2 | 66.2 | 1.6 | 100.0 | 34.4 | 63.8 | 1.8 | 100.0 |
| Outaouais | 18.6 | 81.3 | 0.1 | 100.0 | 21.1 | 78.5 | 0.5 | 100.0 |
| Total: Quebec | 12.9 | 86.6 | 0.6 | 100.0 | 14.7 | 84.5 | 0.8 | 100.0 |
|
||||||||
The number of workers in the agri-food sector was 553,045 in Quebec in 2016. This is an increase of nearly 11% over 2006, when the sector had 496,910 workers in the province. Table 3 shows that more than 100,000 agri-food workers lived in the Montréal–Laval and Montérégie CARs in 2016.
The number of Anglophone workers in Quebec’s agri-food sector was also up from 63,915 to 81,405 between 2006 and 2016. This is an increase in the workforce of more than 27%. As a result, the number of Anglophone workers in the agri-food sector increased faster than the total number of workers in the sector. Therefore, the proportion of Anglophones among Quebec agri-food workers rose from 12.9% to 14.7% between 2006 and 2016.
A high number of Anglophone agri-food workers lived in Montréal–Laval (55,195 workers) in 2016, where they represented 34.4% of this CAR’s agri-food workers. Two in three Anglophone agri-food workers in the province resided in Montréal–Laval in 2016. Other CARs with a significant number of Anglophone agri-food workers in 2016 included Montérégie (12,310 workers), Outaouais (4,535 workers), and Laurentides (2,445 workers).
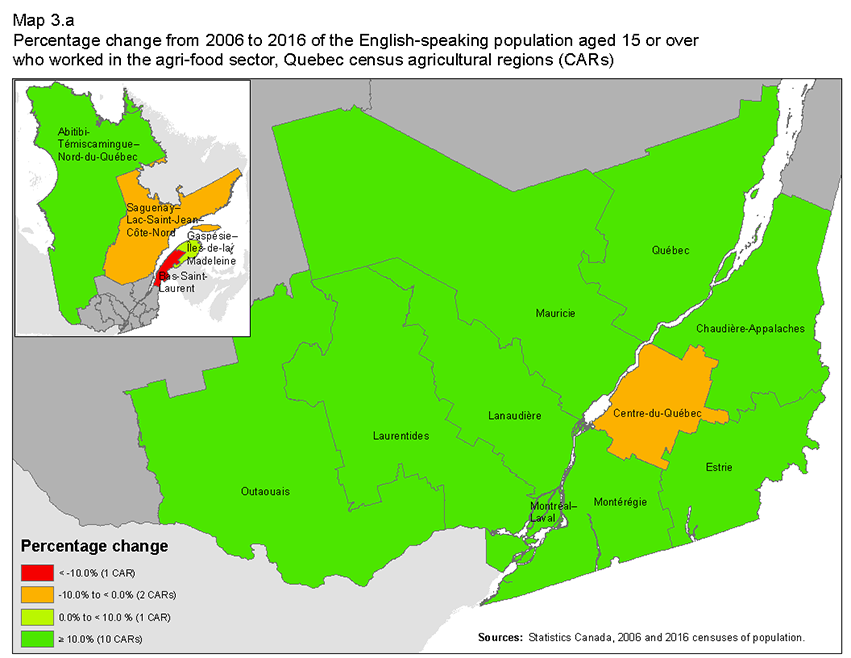
Description for Map 3.a
This map shows the percentage change from 2006 to 2016 of the English-speaking population aged 15 or over who worked in the agri-food sector, in each of Quebec’s census agricultural regions.
On this map, four different colours are used to identify values. Red represents census agricultural regions where the English-speaking population aged 15 or over who worked in the agri-food sector decreased by more than 10% between 2006 and 2016. In this group, there is one census agricultural region.
Orange represents census agricultural regions where the English-speaking population aged 15 or over who worked in the agri-food sector decreased by less than 10% between 2006 and 2016. In this group, there are two census agricultural regions.
Light green represents census agricultural regions where the English-speaking population aged 15 or over who worked in the agri-food sector increased by 10% or less between 2006 and 2016. In this group, there is one census agricultural region.
Dark green represents census agricultural regions where the English-speaking population aged 15 or over who worked in the agri-food sector increased by 10% or more between 2006 and 2016. In this group, there are ten census agricultural regions.
The borders of each census agricultural region are delineated by a grey line. Each census agricultural region is assigned a colour based on the table below.
| Census agricultural region | Percentage change |
|---|---|
| 2401 | -18.9 |
| 2402 | -6.3 |
| 2403 | 78.0 |
| 2404 | 99.9 |
| 2405 | 21.5 |
| 2406 | 24.7 |
| 2407 | 50.1 |
| 2408 | 28.9 |
| 2409 | 36.0 |
| 2410 | 59.5 |
| 2411 | 9.6 |
| 2412 | 55.4 |
| 2413 | 33.0 |
| 2414 | -7.6 |
Map 3.a shows that the number of Anglophone workers in the agri-food sector increased in 11 of the 14 Quebec CARs between 2006 and 2016. This growth was greater than or equal to 10% in ten CARs.
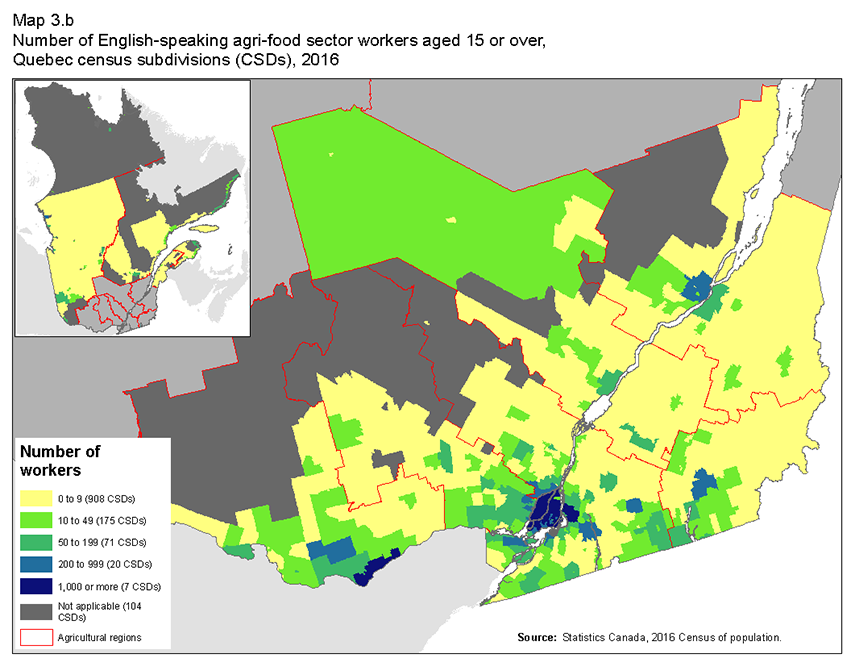
Description for Map 3.b
This map shows the number of English-speaking agri-food sector workers aged 15 or over in 2016 in each of Québec’s census subdivisions.
On this map, we use six different colours to identify variations. Dark grey represents census subdivisions where data is unavailable. In this group, there are 104 census subdivisions.
Yellow represents census subdivisions where there were between zero and nine English-speaking agri-food sector workers aged 15 or over in 2016. In this group, there are 908 census subdivisions.
Light green represents census subdivisions where there were between 10 and 49 English-speaking agri-food sector workers aged 15 or over in 2016. In this group, there are 175 census subdivisions.
Dark green represents census subdivisions where there were between 50 and 199 English-speaking agri-food sector workers aged 15 or over in 2016. In this group, there are 71 census subdivisions.
Light blue represents census subdivisions where there were between 200 and 999 English-speaking agri-food sector workers aged 15 or over in 2016. In this group, there are 20 census subdivisions.
Dark blue represents census subdivisions where there were 1,000 or more English-speaking agri-food sector workers aged 15 or over in 2016. In this group, there are seven census subdivisions.
The borders of each census agricultural region are delineated by a red line. Each census subdivision is assigned a colour based on the table below.
| Census subdivision | Number of workers |
|---|---|
| 2401023 | 15 |
| 2401042 | 55 |
| 2402005 | 60 |
| 2402010 | 0 |
| 2402015 | 0 |
| 2402028 | 20 |
| 2402047 | 20 |
| 2403005 | 145 |
| 2403010 | 0 |
| 2403015 | 0 |
| 2403020 | 0 |
| 2403025 | 0 |
| 2404005 | 0 |
| 2404010 | 0 |
| 2404015 | 0 |
| 2404020 | 0 |
| 2404025 | 0 |
| 2404030 | 0 |
| 2404037 | 0 |
| 2404047 | 0 |
| 2404902 | 0 |
| 2405010 | 5 |
| 2405015 | 5 |
| 2405020 | 20 |
| 2405025 | 5 |
| 2405032 | 20 |
| 2405040 | 20 |
| 2405045 | 0 |
| 2405050 | 0 |
| 2405055 | 0 |
| 2405060 | 0 |
| 2405065 | 0 |
| 2405070 | 35 |
| 2405077 | 15 |
| 2405902 | 0 |
| 2406005 | 0 |
| 2406013 | 0 |
| 2406020 | 0 |
| 2406025 | 0 |
| 2406030 | 0 |
| 2406035 | 5 |
| 2406040 | 5 |
| 2406045 | 0 |
| 2406050 | 0 |
| 2406055 | 0 |
| 2406060 | 0 |
| 2406802 | 15 |
| 2406804 | 25 |
| 2407005 | 0 |
| 2407010 | 0 |
| 2407018 | 0 |
| 2407025 | 0 |
| 2407030 | 0 |
| 2407035 | 0 |
| 2407040 | 0 |
| 2407047 | 0 |
| 2407057 | 0 |
| 2407065 | 0 |
| 2407070 | 0 |
| 2407075 | 0 |
| 2407080 | 0 |
| 2407085 | 0 |
| 2407090 | 0 |
| 2407095 | 0 |
| 2407100 | 0 |
| 2407105 | 0 |
| 2407902 | 0 |
| 2407908 | 0 |
| 2407914 | 0 |
| 2408005 | 0 |
| 2408010 | 0 |
| 2408015 | 0 |
| 2408023 | 0 |
| 2408030 | 0 |
| 2408035 | 0 |
| 2408040 | 0 |
| 2408053 | 0 |
| 2408065 | 0 |
| 2408073 | 0 |
| 2408080 | 0 |
| 2408902 | 0 |
| 2409005 | 0 |
| 2409010 | 0 |
| 2409015 | 0 |
| 2409020 | 0 |
| 2409025 | 0 |
| 2409030 | 0 |
| 2409035 | 0 |
| 2409040 | 0 |
| 2409048 | 0 |
| 2409055 | 0 |
| 2409060 | 0 |
| 2409065 | 0 |
| 2409070 | 0 |
| 2409077 | 0 |
| 2409085 | 0 |
| 2409092 | 0 |
| 2410005 | 0 |
| 2410010 | 0 |
| 2410015 | 0 |
| 2410025 | 0 |
| 2410030 | 0 |
| 2410043 | 25 |
| 2410060 | 0 |
| 2410070 | 0 |
| 2410075 | 0 |
| 2410902 | 0 |
| 2411005 | 0 |
| 2411010 | 0 |
| 2411015 | 0 |
| 2411020 | 0 |
| 2411025 | 0 |
| 2411030 | 0 |
| 2411035 | 0 |
| 2411040 | 0 |
| 2411045 | 0 |
| 2411050 | 0 |
| 2411055 | 0 |
| 2412005 | 0 |
| 2412010 | 0 |
| 2412015 | 0 |
| 2412020 | 0 |
| 2412025 | 0 |
| 2412030 | 0 |
| 2412035 | 0 |
| 2412043 | 0 |
| 2412045 | 0 |
| 2412057 | 0 |
| 2412065 | 0 |
| 2412072 | 0 |
| 2412080 | 0 |
| 2413005 | 0 |
| 2413010 | 0 |
| 2413015 | 0 |
| 2413020 | 0 |
| 2413025 | 0 |
| 2413030 | 0 |
| 2413040 | 0 |
| 2413045 | 0 |
| 2413050 | 0 |
| 2413055 | 0 |
| 2413060 | 0 |
| 2413065 | 0 |
| 2413073 | 0 |
| 2413075 | 0 |
| 2413080 | 0 |
| 2413085 | 0 |
| 2413090 | 0 |
| 2413095 | 0 |
| 2413100 | 0 |
| 2414005 | 0 |
| 2414010 | 0 |
| 2414018 | 0 |
| 2414025 | 0 |
| 2414030 | 0 |
| 2414035 | 15 |
| 2414040 | 0 |
| 2414045 | 0 |
| 2414050 | 0 |
| 2414055 | 0 |
| 2414060 | 0 |
| 2414065 | 0 |
| 2414070 | 0 |
| 2414075 | 0 |
| 2414080 | 0 |
| 2414085 | 0 |
| 2414090 | 0 |
| 2414902 | 0 |
| 2415005 | 0 |
| 2415013 | 0 |
| 2415025 | 0 |
| 2415030 | 0 |
| 2415035 | 0 |
| 2415058 | 0 |
| 2415065 | 0 |
| 2415902 | 0 |
| 2415904 | 0 |
| 2416005 | 0 |
| 2416013 | 0 |
| 2416023 | 0 |
| 2416048 | 0 |
| 2416050 | 0 |
| 2416055 | 5 |
| 2417005 | 0 |
| 2417010 | 0 |
| 2417015 | 0 |
| 2417020 | 0 |
| 2417025 | 0 |
| 2417030 | 0 |
| 2417035 | 0 |
| 2417040 | 0 |
| 2417045 | 0 |
| 2417055 | 0 |
| 2417060 | 0 |
| 2417065 | 0 |
| 2417070 | 0 |
| 2417078 | 0 |
| 2418005 | 0 |
| 2418010 | 0 |
| 2418015 | 0 |
| 2418020 | 0 |
| 2418025 | 0 |
| 2418030 | 0 |
| 2418035 | 0 |
| 2418040 | 0 |
| 2418045 | 0 |
| 2418050 | 0 |
| 2418055 | 0 |
| 2418060 | 0 |
| 2418065 | 5 |
| 2418070 | 0 |
| 2419005 | 0 |
| 2419010 | 0 |
| 2419015 | 0 |
| 2419020 | 0 |
| 2419025 | 0 |
| 2419030 | 0 |
| 2419037 | 0 |
| 2419045 | 0 |
| 2419050 | 0 |
| 2419055 | 0 |
| 2419062 | 15 |
| 2419068 | 0 |
| 2419070 | 0 |
| 2419075 | 0 |
| 2419082 | 0 |
| 2419090 | 0 |
| 2419097 | 0 |
| 2419105 | 0 |
| 2419110 | 0 |
| 2419117 | 0 |
| 2420005 | 0 |
| 2420010 | 0 |
| 2420015 | 0 |
| 2420020 | 5 |
| 2420025 | 0 |
| 2420030 | 0 |
| 2421005 | 0 |
| 2421010 | 5 |
| 2421020 | 0 |
| 2421025 | 0 |
| 2421030 | 0 |
| 2421035 | 0 |
| 2421040 | 0 |
| 2421045 | 5 |
| 2422005 | 5 |
| 2422010 | 0 |
| 2422015 | 0 |
| 2422020 | 35 |
| 2422025 | 10 |
| 2422030 | 0 |
| 2422035 | 0 |
| 2422040 | 5 |
| 2422045 | 0 |
| 2423027 | 975 |
| 2423057 | 20 |
| 2423072 | 15 |
| 2423802 | 0 |
| 2425213 | 145 |
| 2426005 | 0 |
| 2426010 | 0 |
| 2426015 | 0 |
| 2426022 | 0 |
| 2426030 | 5 |
| 2426035 | 0 |
| 2426040 | 0 |
| 2426048 | 0 |
| 2426055 | 0 |
| 2426063 | 0 |
| 2426070 | 0 |
| 2427008 | 5 |
| 2427015 | 0 |
| 2427028 | 0 |
| 2427035 | 0 |
| 2427043 | 5 |
| 2427050 | 0 |
| 2427055 | 0 |
| 2427060 | 0 |
| 2427065 | 0 |
| 2427070 | 0 |
| 2428005 | 0 |
| 2428015 | 0 |
| 2428020 | 0 |
| 2428025 | 0 |
| 2428030 | 0 |
| 2428035 | 0 |
| 2428040 | 0 |
| 2428045 | 0 |
| 2428053 | 0 |
| 2428060 | 0 |
| 2428065 | 0 |
| 2428070 | 0 |
| 2428075 | 0 |
| 2429005 | 0 |
| 2429013 | 0 |
| 2429020 | 0 |
| 2429025 | 0 |
| 2429030 | 0 |
| 2429038 | 5 |
| 2429045 | 0 |
| 2429050 | 0 |
| 2429057 | 0 |
| 2429065 | 0 |
| 2429073 | 35 |
| 2429095 | 0 |
| 2429100 | 0 |
| 2429112 | 0 |
| 2429120 | 0 |
| 2429125 | 0 |
| 2430005 | 0 |
| 2430010 | 0 |
| 2430015 | 0 |
| 2430020 | 0 |
| 2430025 | 0 |
| 2430030 | 0 |
| 2430035 | 0 |
| 2430040 | 0 |
| 2430045 | 0 |
| 2430050 | 0 |
| 2430055 | 0 |
| 2430070 | 0 |
| 2430072 | 0 |
| 2430080 | 0 |
| 2430085 | 0 |
| 2430090 | 0 |
| 2430095 | 0 |
| 2430100 | 0 |
| 2430105 | 0 |
| 2430110 | 0 |
| 2431008 | 0 |
| 2431015 | 0 |
| 2431020 | 0 |
| 2431025 | 0 |
| 2431030 | 0 |
| 2431035 | 0 |
| 2431040 | 0 |
| 2431045 | 0 |
| 2431050 | 0 |
| 2431056 | 0 |
| 2431060 | 0 |
| 2431084 | 10 |
| 2431095 | 0 |
| 2431100 | 0 |
| 2431105 | 0 |
| 2431122 | 0 |
| 2431130 | 0 |
| 2431135 | 0 |
| 2431140 | 0 |
| 2432013 | 0 |
| 2432023 | 0 |
| 2432033 | 0 |
| 2432040 | 0 |
| 2432045 | 0 |
| 2432050 | 0 |
| 2432058 | 0 |
| 2432065 | 0 |
| 2432072 | 0 |
| 2432080 | 0 |
| 2432085 | 0 |
| 2433007 | 0 |
| 2433017 | 0 |
| 2433025 | 0 |
| 2433030 | 0 |
| 2433035 | 0 |
| 2433040 | 0 |
| 2433045 | 10 |
| 2433052 | 0 |
| 2433060 | 0 |
| 2433065 | 0 |
| 2433070 | 5 |
| 2433080 | 0 |
| 2433085 | 0 |
| 2433090 | 5 |
| 2433095 | 0 |
| 2433102 | 5 |
| 2433115 | 0 |
| 2433123 | 0 |
| 2434007 | 0 |
| 2434017 | 10 |
| 2434025 | 5 |
| 2434030 | 0 |
| 2434038 | 0 |
| 2434048 | 0 |
| 2434058 | 0 |
| 2434060 | 0 |
| 2434065 | 0 |
| 2434078 | 5 |
| 2434085 | 0 |
| 2434090 | 0 |
| 2434097 | 0 |
| 2434105 | 0 |
| 2434115 | 0 |
| 2434120 | 0 |
| 2434128 | 10 |
| 2434135 | 0 |
| 2435005 | 0 |
| 2435010 | 0 |
| 2435015 | 0 |
| 2435020 | 0 |
| 2435027 | 0 |
| 2435035 | 0 |
| 2435040 | 0 |
| 2435045 | 0 |
| 2435050 | 0 |
| 2435055 | 0 |
| 2435906 | 0 |
| 2436033 | 40 |
| 2437067 | 130 |
| 2437205 | 0 |
| 2437210 | 0 |
| 2437215 | 0 |
| 2437220 | 0 |
| 2437225 | 0 |
| 2437230 | 0 |
| 2437235 | 0 |
| 2437240 | 0 |
| 2437245 | 5 |
| 2437250 | 0 |
| 2438005 | 0 |
| 2438010 | 5 |
| 2438015 | 0 |
| 2438020 | 0 |
| 2438028 | 0 |
| 2438035 | 0 |
| 2438040 | 0 |
| 2438047 | 0 |
| 2438055 | 0 |
| 2438060 | 5 |
| 2438065 | 0 |
| 2438070 | 0 |
| 2438802 | 0 |
| 2439005 | 0 |
| 2439010 | 0 |
| 2439015 | 0 |
| 2439020 | 0 |
| 2439025 | 5 |
| 2439030 | 0 |
| 2439035 | 0 |
| 2439043 | 0 |
| 2439060 | 0 |
| 2439062 | 30 |
| 2439077 | 5 |
| 2439085 | 0 |
| 2439090 | 0 |
| 2439097 | 0 |
| 2439105 | 0 |
| 2439117 | 0 |
| 2439130 | 0 |
| 2439135 | 0 |
| 2439145 | 0 |
| 2439150 | 0 |
| 2439155 | 0 |
| 2439165 | 0 |
| 2439170 | 0 |
| 2440005 | 0 |
| 2440010 | 0 |
| 2440017 | 10 |
| 2440025 | 0 |
| 2440032 | 0 |
| 2440043 | 5 |
| 2440047 | 10 |
| 2441012 | 0 |
| 2441020 | 0 |
| 2441027 | 0 |
| 2441037 | 0 |
| 2441038 | 30 |
| 2441055 | 5 |
| 2441060 | 5 |
| 2441065 | 0 |
| 2441070 | 5 |
| 2441075 | 0 |
| 2441080 | 0 |
| 2441085 | 0 |
| 2441098 | 5 |
| 2441117 | 5 |
| 2442005 | 0 |
| 2442020 | 5 |
| 2442025 | 0 |
| 2442032 | 0 |
| 2442040 | 0 |
| 2442045 | 0 |
| 2442050 | 0 |
| 2442055 | 0 |
| 2442060 | 0 |
| 2442065 | 0 |
| 2442070 | 0 |
| 2442075 | 20 |
| 2442078 | 5 |
| 2442088 | 0 |
| 2442095 | 0 |
| 2442098 | 30 |
| 2442100 | 0 |
| 2442110 | 25 |
| 2443027 | 595 |
| 2444003 | 0 |
| 2444005 | 0 |
| 2444010 | 0 |
| 2444015 | 0 |
| 2444023 | 0 |
| 2444037 | 20 |
| 2444045 | 0 |
| 2444050 | 10 |
| 2444055 | 0 |
| 2444060 | 0 |
| 2444071 | 10 |
| 2444080 | 20 |
| 2445008 | 70 |
| 2445020 | 20 |
| 2445025 | 10 |
| 2445030 | 55 |
| 2445035 | 25 |
| 2445043 | 25 |
| 2445050 | 10 |
| 2445055 | 20 |
| 2445060 | 15 |
| 2445072 | 135 |
| 2445085 | 0 |
| 2445093 | 0 |
| 2445095 | 15 |
| 2445100 | 5 |
| 2445105 | 5 |
| 2445115 | 0 |
| 2446005 | 20 |
| 2446010 | 10 |
| 2446017 | 35 |
| 2446025 | 0 |
| 2446030 | 0 |
| 2446035 | 35 |
| 2446040 | 20 |
| 2446045 | 40 |
| 2446050 | 35 |
| 2446058 | 60 |
| 2446065 | 10 |
| 2446070 | 15 |
| 2446075 | 150 |
| 2446078 | 45 |
| 2446080 | 125 |
| 2446085 | 0 |
| 2446090 | 10 |
| 2446095 | 0 |
| 2446100 | 0 |
| 2446105 | 0 |
| 2446112 | 15 |
| 2447010 | 5 |
| 2447017 | 205 |
| 2447025 | 15 |
| 2447030 | 0 |
| 2447035 | 20 |
| 2447040 | 0 |
| 2447047 | 0 |
| 2447055 | 0 |
| 2448005 | 0 |
| 2448010 | 0 |
| 2448015 | 0 |
| 2448020 | 0 |
| 2448028 | 0 |
| 2448038 | 0 |
| 2448045 | 0 |
| 2448050 | 0 |
| 2449005 | 0 |
| 2449015 | 5 |
| 2449020 | 0 |
| 2449025 | 0 |
| 2449030 | 0 |
| 2449040 | 0 |
| 2449048 | 5 |
| 2449058 | 75 |
| 2449070 | 0 |
| 2449075 | 0 |
| 2449080 | 0 |
| 2449085 | 0 |
| 2449095 | 0 |
| 2449100 | 0 |
| 2449105 | 0 |
| 2449113 | 0 |
| 2449125 | 0 |
| 2449130 | 0 |
| 2450005 | 0 |
| 2450013 | 0 |
| 2450023 | 0 |
| 2450030 | 0 |
| 2450035 | 0 |
| 2450042 | 0 |
| 2450050 | 0 |
| 2450057 | 0 |
| 2450065 | 0 |
| 2450072 | 5 |
| 2450085 | 0 |
| 2450090 | 0 |
| 2450095 | 0 |
| 2450100 | 0 |
| 2450113 | 0 |
| 2450128 | 0 |
| 2450802 | 5 |
| 2451008 | 0 |
| 2451015 | 15 |
| 2451020 | 0 |
| 2451025 | 0 |
| 2451030 | 0 |
| 2451035 | 0 |
| 2451040 | 0 |
| 2451045 | 0 |
| 2451050 | 0 |
| 2451055 | 0 |
| 2451060 | 0 |
| 2451065 | 0 |
| 2451070 | 0 |
| 2451075 | 5 |
| 2451080 | 0 |
| 2451085 | 5 |
| 2451090 | 20 |
| 2452007 | 10 |
| 2452017 | 5 |
| 2452030 | 0 |
| 2452035 | 0 |
| 2452040 | 0 |
| 2452045 | 0 |
| 2452050 | 0 |
| 2452055 | 0 |
| 2452062 | 0 |
| 2452070 | 0 |
| 2452075 | 0 |
| 2452080 | 0 |
| 2452085 | 5 |
| 2452090 | 0 |
| 2452095 | 0 |
| 2453005 | 0 |
| 2453010 | 0 |
| 2453015 | 0 |
| 2453020 | 0 |
| 2453025 | 0 |
| 2453032 | 0 |
| 2453040 | 0 |
| 2453050 | 10 |
| 2453052 | 40 |
| 2453065 | 0 |
| 2453072 | 5 |
| 2453085 | 0 |
| 2454008 | 0 |
| 2454017 | 0 |
| 2454025 | 0 |
| 2454030 | 0 |
| 2454035 | 0 |
| 2454048 | 150 |
| 2454060 | 0 |
| 2454065 | 0 |
| 2454072 | 0 |
| 2454090 | 0 |
| 2454095 | 0 |
| 2454100 | 0 |
| 2454105 | 0 |
| 2454110 | 0 |
| 2454115 | 0 |
| 2454120 | 0 |
| 2454125 | 0 |
| 2455008 | 0 |
| 2455015 | 10 |
| 2455023 | 5 |
| 2455030 | 0 |
| 2455037 | 5 |
| 2455048 | 5 |
| 2455057 | 10 |
| 2455065 | 0 |
| 2456005 | 0 |
| 2456010 | 5 |
| 2456015 | 20 |
| 2456023 | 0 |
| 2456030 | 5 |
| 2456035 | 10 |
| 2456042 | 0 |
| 2456050 | 0 |
| 2456055 | 0 |
| 2456060 | 0 |
| 2456065 | 0 |
| 2456083 | 200 |
| 2456097 | 0 |
| 2456105 | 0 |
| 2457005 | 150 |
| 2457010 | 30 |
| 2457020 | 45 |
| 2457025 | 30 |
| 2457030 | 20 |
| 2457033 | 5 |
| 2457035 | 65 |
| 2457040 | 50 |
| 2457045 | 5 |
| 2457050 | 5 |
| 2457057 | 0 |
| 2457068 | 5 |
| 2457075 | 0 |
| 2458007 | 2800 |
| 2458012 | 140 |
| 2458033 | 100 |
| 2458037 | 105 |
| 2458227 | 1980 |
| 2459010 | 80 |
| 2459015 | 15 |
| 2459020 | 40 |
| 2459025 | 0 |
| 2459030 | 0 |
| 2459035 | 25 |
| 2460005 | 0 |
| 2460013 | 195 |
| 2460020 | 0 |
| 2460028 | 20 |
| 2460035 | 5 |
| 2460040 | 0 |
| 2461005 | 0 |
| 2461013 | 10 |
| 2461020 | 0 |
| 2461025 | 50 |
| 2461027 | 0 |
| 2461030 | 0 |
| 2461035 | 10 |
| 2461040 | 0 |
| 2461045 | 0 |
| 2461050 | 0 |
| 2462007 | 0 |
| 2462015 | 0 |
| 2462020 | 0 |
| 2462025 | 0 |
| 2462030 | 0 |
| 2462037 | 70 |
| 2462047 | 20 |
| 2462053 | 0 |
| 2462055 | 0 |
| 2462060 | 0 |
| 2462065 | 5 |
| 2462070 | 10 |
| 2462075 | 0 |
| 2462080 | 0 |
| 2462085 | 0 |
| 2462802 | 0 |
| 2462912 | 0 |
| 2463005 | 0 |
| 2463013 | 0 |
| 2463023 | 0 |
| 2463030 | 0 |
| 2463035 | 5 |
| 2463040 | 0 |
| 2463048 | 25 |
| 2463055 | 5 |
| 2463060 | 15 |
| 2463065 | 0 |
| 2464008 | 325 |
| 2464015 | 115 |
| 2465005 | 8365 |
| 2466007 | 15 |
| 2466023 | 39065 |
| 2466032 | 470 |
| 2466047 | 155 |
| 2466058 | 855 |
| 2466062 | 185 |
| 2466072 | 340 |
| 2466087 | 670 |
| 2466092 | 0 |
| 2466097 | 1010 |
| 2466102 | 925 |
| 2466107 | 590 |
| 2466112 | 90 |
| 2466117 | 165 |
| 2466127 | 5 |
| 2466142 | 2250 |
| 2467005 | 0 |
| 2467010 | 15 |
| 2467015 | 145 |
| 2467020 | 170 |
| 2467025 | 30 |
| 2467030 | 70 |
| 2467035 | 185 |
| 2467040 | 0 |
| 2467045 | 60 |
| 2467050 | 805 |
| 2467055 | 20 |
| 2468005 | 5 |
| 2468010 | 30 |
| 2468015 | 50 |
| 2468020 | 0 |
| 2468025 | 5 |
| 2468030 | 15 |
| 2468035 | 0 |
| 2468040 | 0 |
| 2468045 | 0 |
| 2468050 | 0 |
| 2468055 | 25 |
| 2469005 | 10 |
| 2469010 | 35 |
| 2469017 | 15 |
| 2469025 | 25 |
| 2469030 | 15 |
| 2469037 | 75 |
| 2469045 | 90 |
| 2469050 | 30 |
| 2469055 | 85 |
| 2469060 | 45 |
| 2469065 | 0 |
| 2469070 | 10 |
| 2469075 | 0 |
| 2469802 | 35 |
| 2470005 | 0 |
| 2470012 | 20 |
| 2470022 | 35 |
| 2470030 | 0 |
| 2470035 | 0 |
| 2470040 | 0 |
| 2470052 | 120 |
| 2471005 | 0 |
| 2471015 | 5 |
| 2471020 | 5 |
| 2471025 | 25 |
| 2471033 | 15 |
| 2471040 | 35 |
| 2471045 | 20 |
| 2471050 | 60 |
| 2471055 | 20 |
| 2471060 | 175 |
| 2471065 | 145 |
| 2471070 | 330 |
| 2471075 | 20 |
| 2471083 | 905 |
| 2471090 | 15 |
| 2471095 | 0 |
| 2471100 | 185 |
| 2471105 | 525 |
| 2471110 | 30 |
| 2471115 | 5 |
| 2471125 | 10 |
| 2471133 | 100 |
| 2471140 | 0 |
| 2472005 | 175 |
| 2472010 | 200 |
| 2472015 | 75 |
| 2472020 | 25 |
| 2472025 | 10 |
| 2472032 | 15 |
| 2472043 | 0 |
| 2473005 | 205 |
| 2473010 | 105 |
| 2473015 | 315 |
| 2473020 | 145 |
| 2473025 | 60 |
| 2473030 | 25 |
| 2473035 | 30 |
| 2474005 | 100 |
| 2475005 | 5 |
| 2475017 | 120 |
| 2475028 | 25 |
| 2475040 | 35 |
| 2475045 | 20 |
| 2476008 | 10 |
| 2476020 | 90 |
| 2476025 | 10 |
| 2476030 | 0 |
| 2476035 | 0 |
| 2476043 | 70 |
| 2476052 | 30 |
| 2476055 | 30 |
| 2476065 | 20 |
| 2477011 | 0 |
| 2477012 | 0 |
| 2477022 | 45 |
| 2477030 | 15 |
| 2477035 | 10 |
| 2477043 | 80 |
| 2477050 | 70 |
| 2477055 | 0 |
| 2477060 | 15 |
| 2477065 | 5 |
| 2478005 | 0 |
| 2478010 | 5 |
| 2478015 | 0 |
| 2478020 | 5 |
| 2478032 | 30 |
| 2478042 | 0 |
| 2478047 | 5 |
| 2478050 | 0 |
| 2478055 | 0 |
| 2478060 | 0 |
| 2478065 | 0 |
| 2478070 | 0 |
| 2478075 | 0 |
| 2478095 | 5 |
| 2478100 | 0 |
| 2478102 | 55 |
| 2478115 | 10 |
| 2478120 | 0 |
| 2478127 | 0 |
| 2478130 | 0 |
| 2479005 | 0 |
| 2479010 | 0 |
| 2479015 | 0 |
| 2479022 | 0 |
| 2479025 | 0 |
| 2479030 | 0 |
| 2479037 | 0 |
| 2479047 | 0 |
| 2479050 | 0 |
| 2479060 | 0 |
| 2479065 | 0 |
| 2479078 | 0 |
| 2479088 | 20 |
| 2479097 | 0 |
| 2479105 | 0 |
| 2479110 | 0 |
| 2479115 | 0 |
| 2480005 | 0 |
| 2480010 | 0 |
| 2480015 | 0 |
| 2480020 | 5 |
| 2480027 | 5 |
| 2480037 | 5 |
| 2480045 | 0 |
| 2480050 | 15 |
| 2480055 | 10 |
| 2480060 | 10 |
| 2480065 | 10 |
| 2480070 | 0 |
| 2480078 | 0 |
| 2480085 | 0 |
| 2480090 | 0 |
| 2480095 | 10 |
| 2480103 | 0 |
| 2480110 | 5 |
| 2480115 | 0 |
| 2480125 | 0 |
| 2480130 | 0 |
| 2480135 | 0 |
| 2480140 | 0 |
| 2480145 | 0 |
| 2481017 | 3355 |
| 2482005 | 10 |
| 2482010 | 0 |
| 2482015 | 40 |
| 2482020 | 70 |
| 2482025 | 115 |
| 2482030 | 110 |
| 2482035 | 210 |
| 2483005 | 15 |
| 2483010 | 15 |
| 2483015 | 20 |
| 2483020 | 5 |
| 2483032 | 30 |
| 2483040 | 0 |
| 2483045 | 0 |
| 2483050 | 0 |
| 2483055 | 0 |
| 2483060 | 5 |
| 2483065 | 0 |
| 2483070 | 0 |
| 2483075 | 0 |
| 2483085 | 0 |
| 2483088 | 0 |
| 2483090 | 5 |
| 2483095 | 0 |
| 2483802 | 20 |
| 2484005 | 15 |
| 2484010 | 75 |
| 2484015 | 35 |
| 2484020 | 5 |
| 2484025 | 25 |
| 2484030 | 30 |
| 2484035 | 0 |
| 2484040 | 15 |
| 2484045 | 5 |
| 2484050 | 0 |
| 2484055 | 20 |
| 2484060 | 0 |
| 2484065 | 10 |
| 2484070 | 5 |
| 2484082 | 55 |
| 2484090 | 15 |
| 2484095 | 0 |
| 2484100 | 5 |
| 2485005 | 70 |
| 2485010 | 10 |
| 2485015 | 0 |
| 2485020 | 0 |
| 2485025 | 0 |
| 2485030 | 0 |
| 2485037 | 0 |
| 2485045 | 0 |
| 2485050 | 0 |
| 2485055 | 0 |
| 2485060 | 0 |
| 2485065 | 0 |
| 2485070 | 0 |
| 2485075 | 0 |
| 2485080 | 5 |
| 2485085 | 0 |
| 2485090 | 0 |
| 2485095 | 0 |
| 2485100 | 0 |
| 2485105 | 0 |
| 2485802 | 10 |
| 2485803 | 0 |
| 2485804 | 0 |
| 2485806 | 10 |
| 2485905 | 0 |
| 2486042 | 60 |
| 2487005 | 0 |
| 2487010 | 0 |
| 2487015 | 0 |
| 2487020 | 0 |
| 2487025 | 0 |
| 2487030 | 0 |
| 2487035 | 0 |
| 2487042 | 0 |
| 2487050 | 0 |
| 2487058 | 0 |
| 2487070 | 0 |
| 2487075 | 0 |
| 2487080 | 0 |
| 2487085 | 0 |
| 2487090 | 0 |
| 2487095 | 0 |
| 2487100 | 0 |
| 2487105 | 0 |
| 2487110 | 0 |
| 2487115 | 0 |
| 2487120 | 0 |
| 2487904 | 0 |
| 2488005 | 0 |
| 2488010 | 0 |
| 2488015 | 0 |
| 2488022 | 0 |
| 2488030 | 0 |
| 2488035 | 0 |
| 2488040 | 0 |
| 2488045 | 0 |
| 2488050 | 0 |
| 2488055 | 20 |
| 2488060 | 0 |
| 2488065 | 0 |
| 2488070 | 0 |
| 2488075 | 0 |
| 2488080 | 0 |
| 2488085 | 0 |
| 2488090 | 5 |
| 2488802 | 0 |
| 2488902 | 0 |
| 2488904 | 0 |
| 2489008 | 40 |
| 2489010 | 0 |
| 2489015 | 5 |
| 2489040 | 0 |
| 2489045 | 0 |
| 2489050 | 0 |
| 2489802 | 0 |
| 2489804 | 0 |
| 2490012 | 15 |
| 2490017 | 0 |
| 2490027 | 0 |
| 2490802 | 0 |
| 2490804 | 0 |
| 2491005 | 0 |
| 2491010 | 0 |
| 2491015 | 0 |
| 2491020 | 0 |
| 2491025 | 0 |
| 2491030 | 0 |
| 2491035 | 0 |
| 2491042 | 0 |
| 2491050 | 0 |
| 2491802 | 0 |
| 2492005 | 0 |
| 2492010 | 0 |
| 2492015 | 0 |
| 2492022 | 0 |
| 2492030 | 0 |
| 2492040 | 0 |
| 2492045 | 0 |
| 2492050 | 0 |
| 2492055 | 0 |
| 2492060 | 0 |
| 2492065 | 0 |
| 2492070 | 0 |
| 2492902 | 0 |
| 2492904 | 0 |
| 2493005 | 5 |
| 2493012 | 0 |
| 2493020 | 5 |
| 2493025 | 0 |
| 2493030 | 0 |
| 2493035 | 0 |
| 2493042 | 10 |
| 2493045 | 0 |
| 2493055 | 0 |
| 2493060 | 0 |
| 2493065 | 0 |
| 2493070 | 0 |
| 2493075 | 0 |
| 2493080 | 0 |
| 2493908 | 0 |
| 2494068 | 90 |
| 2494205 | 0 |
| 2494210 | 0 |
| 2494215 | 0 |
| 2494220 | 0 |
| 2494225 | 0 |
| 2494230 | 0 |
| 2494235 | 0 |
| 2494240 | 0 |
| 2494245 | 0 |
| 2494250 | 0 |
| 2494255 | 0 |
| 2494260 | 0 |
| 2494265 | 5 |
| 2495005 | 0 |
| 2495010 | 0 |
| 2495018 | 0 |
| 2495025 | 0 |
| 2495032 | 0 |
| 2495040 | 0 |
| 2495045 | 0 |
| 2495050 | 0 |
| 2495802 | 0 |
| 2496005 | 0 |
| 2496010 | 0 |
| 2496015 | 0 |
| 2496020 | 15 |
| 2496025 | 0 |
| 2496030 | 0 |
| 2496035 | 0 |
| 2496040 | 0 |
| 2496802 | 0 |
| 2496902 | 0 |
| 2497007 | 45 |
| 2497022 | 10 |
| 2497035 | 0 |
| 2497040 | 0 |
| 2497802 | 0 |
| 2497804 | 0 |
| 2497806 | 20 |
| 2497808 | 5 |
| 2497810 | 0 |
| 2497904 | 0 |
| 2498005 | 115 |
| 2498010 | 60 |
| 2498012 | 20 |
| 2498014 | 45 |
| 2498015 | 65 |
| 2498020 | 0 |
| 2498025 | 0 |
| 2498030 | 0 |
| 2498035 | 0 |
| 2498040 | 0 |
| 2498045 | 0 |
| 2498050 | 0 |
| 2498055 | 0 |
| 2498802 | 0 |
| 2498804 | 0 |
| 2498806 | 0 |
| 2498808 | 0 |
| 2499005 | 0 |
| 2499015 | 0 |
| 2499020 | 5 |
| 2499025 | 20 |
| 2499060 | 0 |
| 2499075 | 30 |
| 2499080 | 10 |
| 2499085 | 40 |
| 2499090 | 25 |
| 2499095 | 85 |
| 2499100 | 10 |
| 2499105 | 5 |
| 2499110 | 25 |
| 2499115 | 20 |
| 2499120 | 30 |
| 2499125 | 20 |
| 2499130 | 25 |
| 2499135 | 35 |
| 2499140 | 10 |
| 2499802 | 40 |
| 2499804 | 160 |
| 2499806 | 80 |
| 2499808 | 40 |
| 2499810 | 50 |
| 2499812 | 60 |
| 2499814 | 200 |
| 2499816 | 35 |
| 2499818 | 0 |
Map 3.b shows a high concentration of 1,000 or more Anglophone agri-food workers in seven Quebec municipalities in 2016. These were: Montréal (39,065 workers), Laval (8,370 workers), Dollard-des-Ormeaux (2,250 workers) and Pointe-Claire (1,010 workers) in the Montréal–Laval CAR; Gatineau (3,355 workers) in the Outaouais CAR; and Brossard (2,800 workers) as well as Longueuil (1,985 workers) in the Montérégie CAR.
3.1 Age group
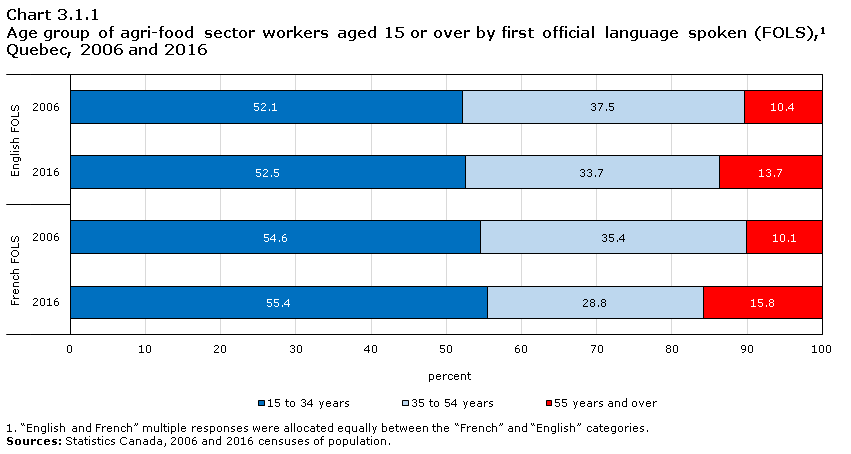
Data table for Chart 3.1.1
| 15 to 34 years | 35 to 54 years | 55 years and over | |
|---|---|---|---|
| percent | |||
| English FOLS | |||
| 2006 | 52.1 | 37.5 | 10.4 |
| 2016 | 52.5 | 33.7 | 13.7 |
| French FOLS | |||
| 2006 | 54.6 | 35.4 | 10.1 |
| 2016 | 55.4 | 28.8 | 15.8 |
|
|||
The median age of Anglophone agri-food workers was relatively stable in 2006 (33.9 years) and in 2016 (33.6 years), as was the proportion of workers aged 15 to 34 (slightly over 52%). The proportion of Anglophone agri-food workers who were aged 55 or older increased slightly over the decade, from 10.4% to 13.7%. Among their counterparts in the agriculture sector, this proportion was significantly higher (36.5% in 2016).
The age profile of Anglophone agri-food workers slightly differed from that of their Francophone counterparts. However, in 2016, the proportion of Francophone agri-food workers aged 15 to 34 (55.4%) or 55 and older (15.8%) was higher than that of their Anglophone counterparts (52.5% and 13.7%, respectively). In addition, the median age of Francophone workers in the agri-food sector was relatively stable between 2006 (31.9 years) and 2016 (31.3 years) and remained slightly lower than that of their Anglophone counterparts.
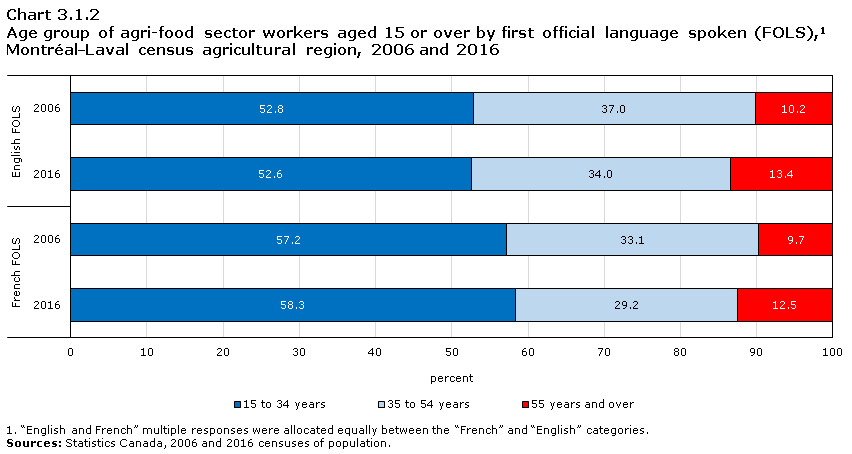
Data table for Chart 3.1.2
| 15 to 34 years | 35 to 54 years | 55 years and over | |
|---|---|---|---|
| percent | |||
| English FOLS | |||
| 2006 | 52.8 | 37.0 | 10.2 |
| 2016 | 52.6 | 34.0 | 13.4 |
| French FOLS | |||
| 2006 | 57.2 | 33.1 | 9.7 |
| 2016 | 58.3 | 29.2 | 12.5 |
|
|||
As was the case in the province as a whole, the age profile of Anglophone workers in the Montréal–Laval agri-food sector was similar in 2006 and in 2016. However, there was a modest increase in the share of these workers who were aged 55 years or older during the decade, from 10.2% in 2006 to 13.4% in 2016. The median age of Anglophone agri-food workers was 33.6 years in 2006 and in 2016. Moreover, the proportion of Anglophone agri-food workers aged 15 to 34 was lower than that of their Francophone counterparts (52.6% versus 58.3%) in 2016. The median age of Francophone agri-food workers was below that of their Anglophone counterparts in 2006 (30.9 years) and in 2016 (30.7 years).
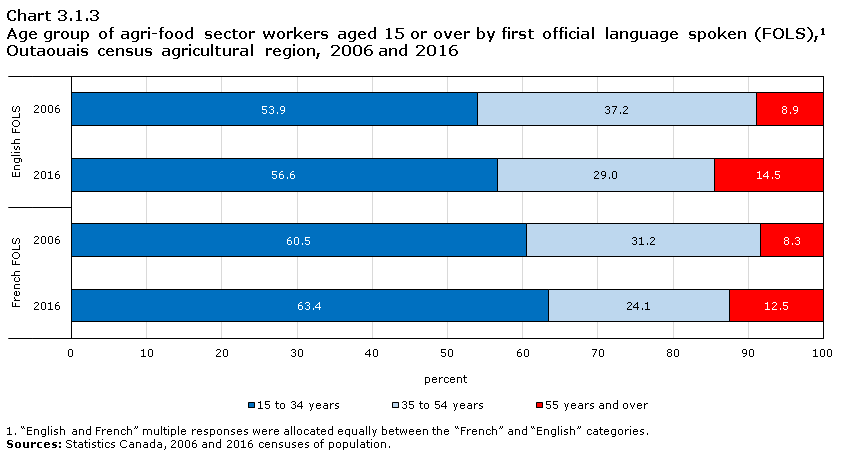
Data table for Chart 3.1.3
| 15 to 34 years | 35 to 54 years | 55 years and over | |
|---|---|---|---|
| percent | |||
| English FOLS | |||
| 2006 | 53.9 | 37.2 | 8.9 |
| 2016 | 56.6 | 29.0 | 14.5 |
| French FOLS | |||
| 2006 | 60.5 | 31.2 | 8.3 |
| 2016 | 63.4 | 24.1 | 12.5 |
|
|||
The presence of youth among Anglophone agri-food workers in Outaouais was more significant than in the province as a whole. In the Outaouais region, the proportion of these workers who were aged between 15 and 34 increased between 2006 (53.9%) and 2016 (56.6%). The median age of Anglophone agri-food workers decreased between 2006 (32.6 years) and 2016 (30.6 years), remaining lower than the median age of Anglophone workers in the Quebec agri-food sector (33.6 years in 2016).
On the other hand, in the Outaouais region, the proportion of Anglophone agri-food workers aged 55 or older increased between 2006 (8.9%) and 2016 (14.5%); and Anglophone agri-food workers were relatively older than their Francophone counterparts, whose median age decreased from 26.9 years to 25.9 years between 2006 and 2016. In 2016, more than 63% of Francophone agri-food workers were aged 15 to 34, compared to less than 57% of Anglophone agri-food workers.
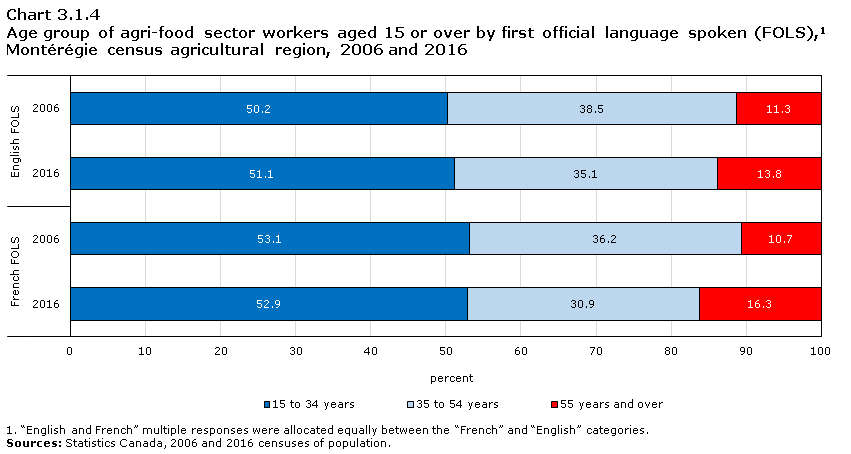
Data table for Chart 3.1.4
| 15 to 34 years | 35 to 54 years | 55 years and over | |
|---|---|---|---|
| percent | |||
| English FOLS | |||
| 2006 | 50.2 | 38.5 | 11.3 |
| 2016 | 51.1 | 35.1 | 13.8 |
| French FOLS | |||
| 2006 | 53.1 | 36.2 | 10.7 |
| 2016 | 52.9 | 30.9 | 16.3 |
|
|||
In Montérégie, the age profile of Anglophone agri-food workers was relatively similar in 2006 and 2016, beside a slight increase in the proportion of workers aged 55 or older (from 11.3% to 13.8%). The median age of Anglophone agri-food workers in this CAR changed little between 2006 (34.8 years) and 2016 (34.5 years). Just over half of Anglophone agri-food workers were aged 15 to 34 in 2016.
The median age of Francophone agri-food workers (33.0 years in 2006 and 2016) was lower than that of their Anglophone counterparts. In contrast, the proportion of Francophone agri-food workers aged 55 or older (16.3% in 2016) was greater than that of their Anglophone counterparts.
3.2 Sex
In Quebec, the representation of women among Anglophone agri-food workers was close to parity in 2006 (42.5%) and 2016 (43.0%). However, the proportion of women among Francophone agri-food workers was higher (52.0% in 2006 and 51.0% in 2016).
In the Montréal–Laval CAR, the proportion of women among Anglophone agri-food workers was relatively stable between 2006 (39.1%) and 2016 (40.7%). These proportions were slightly below the provincial average and that of their Francophone counterparts (45.9% in 2006 and 45.7% in 2016).
The representation of women among Anglophone agri-food workers in Outaouais was above the provincial average. The proportion of women among these workers was 50.7% in 2006 and 49.8% in 2016. These proportions were similar among their Francophone counterparts (51.7% in 2006 and 50.7% in 2016).
In Montérégie, the proportion of women among Anglophone agri-food workers slightly decreased between 2006 (47.8%) and 2016 (45.3%) and remained below that of their Francophone counterparts (51.2% in 2006 and 50.2% in 2016). However, the representation of women among Anglophone agri-food workers in Montérégie remained close to parity in both 2006 and 2016.
3.3 Place of birth
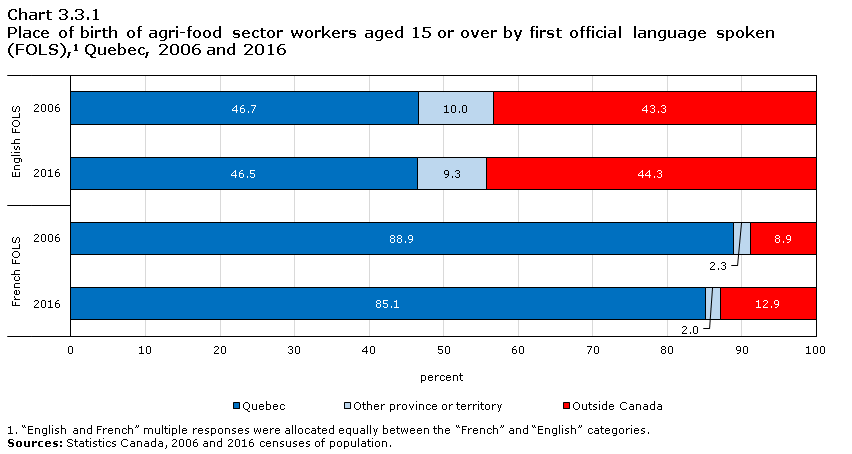
Data table for Chart 3.3.1
| Quebec | Other province or territory | Outside Canada | |
|---|---|---|---|
| percent | |||
| English FOLS | |||
| 2006 | 46.7 | 10.0 | 43.3 |
| 2016 | 46.5 | 9.3 | 44.3 |
| French FOLS | |||
| 2006 | 88.9 | 2.3 | 8.9 |
| 2016 | 85.1 | 2.0 | 12.9 |
|
|||
The places of birth for Anglophone workers in Quebec’s agri-food sector were similar in 2006 and 2016. The proportion of these workers who were born in Quebec (46.5%) or outside Canada (44.3%) was similar in 2016 and just under one in ten Anglophone agri-food workers were born in a province other than Quebec. Anglophone agri-food workers were nearly two times less likely to be born in Quebec than their Francophone counterparts (85.1%) in 2016.
In 2016, Anglophone agri-food workers who were born in a province other than Quebec were mainly from Ontario (64.2%), British Columbia (10.0%), or Alberta (6.5%). As for those who were born outside Canada, the largest group was born in Asia (64.0%) and many were born in Europe (15.5%) or elsewhere in the Americas (13.9%). Their most frequently reported countries of birth were China (13.8%), Sri Lanka (6.8%), the Philippines (5.7%), India (5.6%), and Bangladesh (4.7%).
The high proportion of Anglophone agri-food workers who were born outside Canada is related to the concentration of these workers in the Montréal–Laval CAR. This CAR is located at the centre of the Montréal census metropolitan area (CMA), which has a large immigrant population. In 2016, 14.2% of Anglophone agri-food workers in Quebec were immigrants who obtained landed immigrant or permanent resident status between 2006 and 2016.
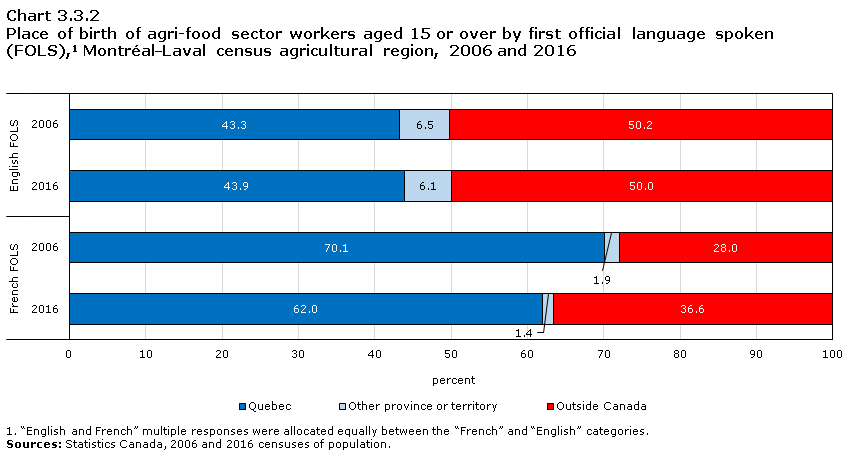
Data table for Chart 3.3.2
| Quebec | Other province or territory | Outside Canada | |
|---|---|---|---|
| percent | |||
| English FOLS | |||
| 2006 | 43.3 | 6.5 | 50.2 |
| 2016 | 43.9 | 6.1 | 50.0 |
| French FOLS | |||
| 2006 | 70.1 | 1.9 | 28.0 |
| 2016 | 62.0 | 1.4 | 36.6 |
|
|||
The proportion of Anglophone agri-food workers in the Montréal–Laval CAR who were born outside Canada (about 50%) surpassed the provincial average in 2006 and 2016. The proportion of these workers who were born in Quebec (43.9%) was below that of their Francophone counterparts (62.0%), and around 6% of Anglophone agri-food workers were born in a province other than Quebec in 2016.
In 2016 in Montréal–Laval, more than half of Anglophone agri-food workers who were born in a province other than Quebec were born in Ontario (54.1%). A significant proportion of these workers were born in British Columbia (14.7%) or Alberta (9.3%). Anglophone workers born outside Canada came largely from Asia (65.5%), Europe (15.4%) and elsewhere in the Americas (12.7%). Their most frequently reported countries of birth were China (11.9%), Sri Lanka (8.3%), and India (6.7%).
The location of the Montréal–Laval CAR in the heart of the Montréal CMA, a popular destination for immigrants, explains the high proportion of Anglophone agri-food workers born outside Canada who lived in this CAR. In 2016, more than 16% of Anglophone agri-food workers in Montréal–Laval were immigrants who had received landed immigrant or permanent resident status between 2006 and 2016.
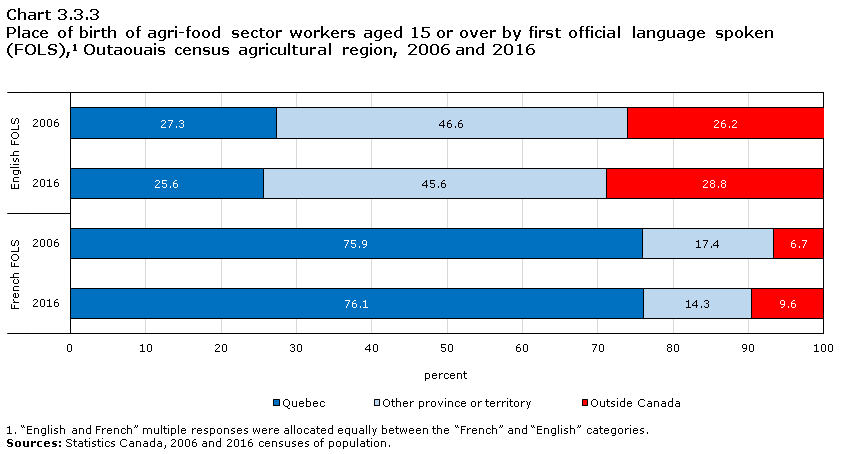
Data table for Chart 3.3.3
| Quebec | Other province or territory | Outside Canada | |
|---|---|---|---|
| percent | |||
| English FOLS | |||
| 2006 | 27.3 | 46.6 | 26.2 |
| 2016 | 25.6 | 45.6 | 28.8 |
| French FOLS | |||
| 2006 | 75.9 | 17.4 | 6.7 |
| 2016 | 76.1 | 14.3 | 9.6 |
|
|||
In 2016, Anglophone agri-food workers in the Outaouais region were about five times more likely to be born in a province other than Quebec (45.6%) than their Anglophone counterparts in the province as a whole (9.3%). In this CAR, just over one in four Anglophone agri-food workers were born in Quebec in 2016, compared to around three in four workers among their Francophone counterparts. The proportion of Anglophone agri-food workers who were born outside Canada slightly increased between 2006 (26.2%) and 2016 (28.8%). It was three times that of their Francophone counterparts in 2016.
In Outaouais, a high proportion of Anglophone agri-food workers who were born in a province other than Quebec were from Ontario (87.7% in 2016). This means that in 2016, four in ten Anglophone agri-food workers in Outaouais were born in Ontario – the province bordering this CAR.
In 2016, among Outaouais’ Anglophone agri-food workers who were born outside Canada, 56.5% were born in Asia, 16.3% in Europe, and 14.5% elsewhere in the Americas. They most frequently reported Lebanon (17.0%), China (12.7%) and the Philippines (4.8%) as their country of birth.
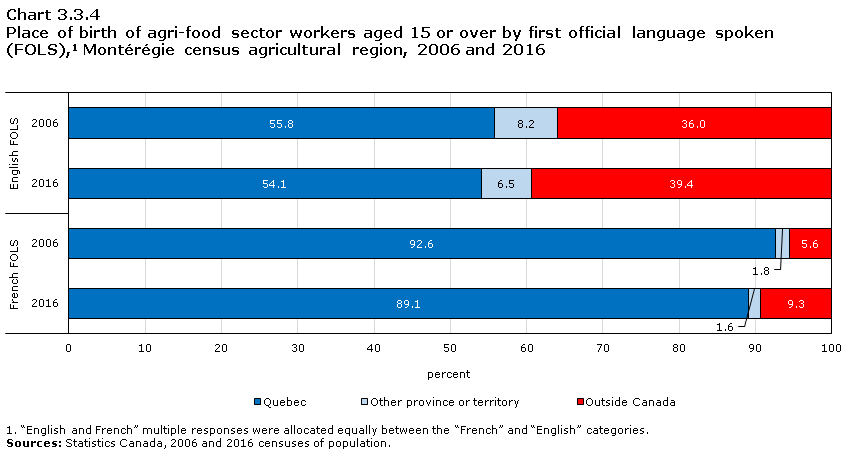
Data table for Chart 3.3.4
| Quebec | Other province or territory | Outside Canada | |
|---|---|---|---|
| percent | |||
| English FOLS | |||
| 2006 | 55.8 | 8.2 | 36.0 |
| 2016 | 54.1 | 6.5 | 39.4 |
| French FOLS | |||
| 2006 | 92.6 | 1.8 | 5.6 |
| 2016 | 89.1 | 1.6 | 9.3 |
|
|||
In Montérégie, the proportion of Anglophone agri-food workers who were born in Quebec (54.1%) was higher than that of their Anglophone counterparts across the province (46.5%) in 2016. On the other hand, this proportion was much lower than that of their Francophone counterparts in the CAR (89.1%). Between 2006 and 2016, the proportion of Anglophone agri-food workers who were born outside Canada rose from 36.0% to 39.4%. This was more than four times the proportion among their Francophone peers.
In 2016, Montérégie’s Anglophone agri-food workers who were born in a province other than Quebec were largely from Ontario (63.1%), Alberta (9.1%), and New Brunswick (7.8%). Their counterparts born outside Canada were largely born in Asia (64.4%), Europe (15.7%) or elsewhere in the Americas (14.8%). The countries of birth reported most frequently for these workers were China (24.0%), Afghanistan (7.0%), and Hong Kong (6.8%).
3.4 Indigenous identity
Between 2006 and 2016, the number of Indigenous workers in Quebec’s agri-food sector rose from 5,550 to 11,080. The proportion whose first official language spoken (FOLS) was English rose from 22.5% in 2006 to 19.6% in 2016. In both years, a very small number of Indigenous workers in the agri-food sector did not know an official language. Furthermore, in 2016, 17.3% of Indigenous workers in the sector knew an Indigenous language, primarily a Cree language, the Inuktitut language, the Innu language or the Atikamekw language.
In Montréal–Laval, the number of Indigenous agri-food sector workers was 635 in 2006 and 1,115 in 2016. In both years, English was the FOLS of about a quarter of these workers. Moreover, nearly 3% knew an Indigenous language in 2016.
In Outaouais, the number of Indigenous workers in the agri-food sector rose from 780 to 1,165 between 2006 and 2016. The proportion whose FOLS was English was 23.8% in 2006 and 26.1% in 2016. Moreover, a small number knew an Indigenous language.
The number of Indigenous agri-food sector workers in Montérégie increased from 550 in 2006 to 1,185 in 2016. Over this period, the proportion whose FOLS was English fell from 14.5% to 12.9%. Furthermore, a little under 2% of Indigenous workers in the sector knew an Indigenous language in 2016.
As was the case with their counterparts in the agriculture sector, the growth in the number of Indigenous workers in the agri-food sector may be attributed to changes in their reported identities between 2006 and 2016.
3.5 Education
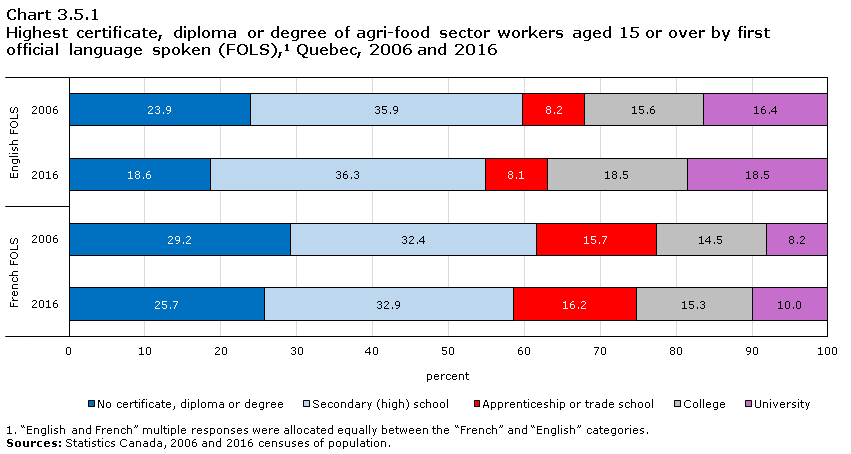
Data table for Chart 3.5.1
| No certificate, diploma or degree | Secondary (high) school | Apprenticeship or trade school | College | University | |
|---|---|---|---|---|---|
| percent | |||||
| English FOLS | |||||
| 2006 | 23.9 | 35.9 | 8.2 | 15.6 | 16.4 |
| 2016 | 18.6 | 36.3 | 8.1 | 18.5 | 18.5 |
| French FOLS | |||||
| 2006 | 29.2 | 32.4 | 15.7 | 14.5 | 8.2 |
| 2016 | 25.7 | 32.9 | 16.2 | 15.3 | 10.0 |
|
|||||
The educational attainment of Anglophone agri-food workers generally improved between 2006 and 2016. The proportion of these workers with no certificate, diploma or degree decreased from 23.9% to 18.6% over the decade, while the proportion who had a college or university degree increased from 32.0% in 2006 to 37.0% in 2016.
The educational attainment of Anglophone agri-food workers was relatively higher than that of their Francophone counterparts. In 2016, around one in four Francophone agri-food workers did not have a certificate, diploma or degree and the proportion of Anglophone agri-food workers with a university degree (18.5%) was higher than that of their Francophone counterparts (10.0%).
Moreover, the proportion of Anglophone agri-food workers with an apprenticeship or trades diploma as their highest qualification (8.1%) was half that of their Francophone counterparts (16.2%) in 2016. However, unlike their counterparts in the agriculture sector, this situation did not result in a smaller proportion of Anglophone agri-food workers with a postsecondary degree. In 2016, the proportion of Anglophone agri-food workers with a postsecondary qualification (45.1%) was greater than that of their Francophone counterparts (41.5%).
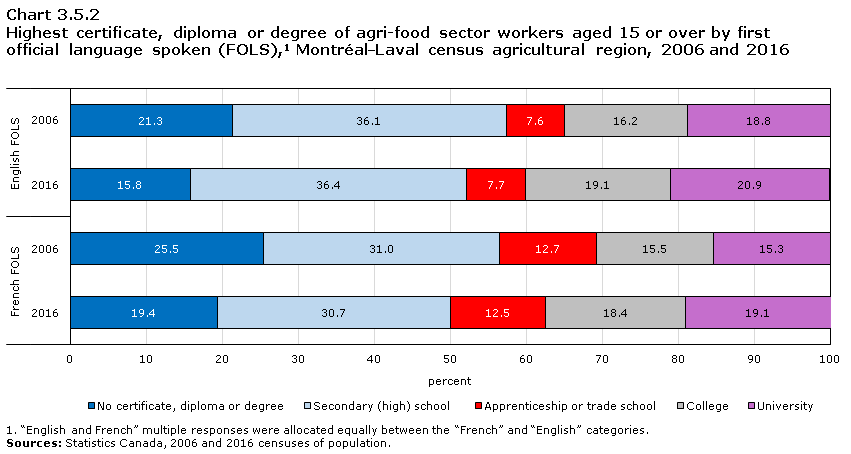
Data table for Chart 3.5.2
| No certificate, diploma or degree | Secondary (high) school | Apprenticeship or trade school | College | University | |
|---|---|---|---|---|---|
| percent | |||||
| English FOLS | |||||
| 2006 | 21.3 | 36.1 | 7.6 | 16.2 | 18.8 |
| 2016 | 15.8 | 36.4 | 7.7 | 19.1 | 20.9 |
| French FOLS | |||||
| 2006 | 25.5 | 31.0 | 12.7 | 15.5 | 15.3 |
| 2016 | 19.4 | 30.7 | 12.5 | 18.4 | 19.1 |
|
|||||
The educational attainment of Anglophone agri-food workers in the Montréal–Laval CAR was relatively higher in 2016 than it was in 2006. The proportion with no certificate, diploma or degree decreased from 21.3% to 15.8% over the decade, while the proportion who had a college or university degree increased from 35.0% in 2006 to 40.0% in 2016.
In 2016, the proportion of Anglophone agri-food workers whose highest qualification was at the secondary level (36.4%) was higher than that of their Francophone peers (30.7%), who were more likely to have an apprenticeship or trades diploma (12.5%) as their highest qualification than their Anglophone counterparts (7.7%). Like their counterparts in the agriculture sector, Montréal–Laval’s Anglophone agri-food workers were less likely to have a postsecondary qualification (47.7%) than their Francophone counterparts (50.0%).
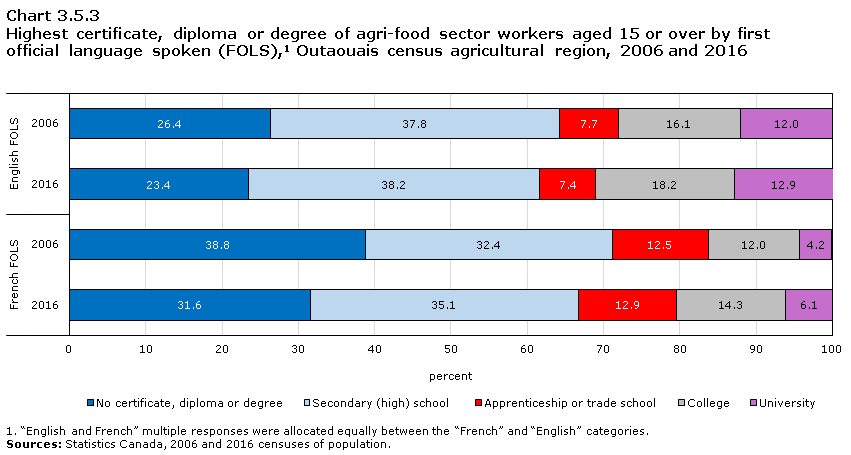
Data table for Chart 3.5.3
| No certificate, diploma or degree | Secondary (high) school | Apprenticeship or trade school | College | University | |
|---|---|---|---|---|---|
| percent | |||||
| English FOLS | |||||
| 2006 | 26.4 | 37.8 | 7.7 | 16.1 | 12.0 |
| 2016 | 23.4 | 38.2 | 7.4 | 18.2 | 12.9 |
| French FOLS | |||||
| 2006 | 38.8 | 32.4 | 12.5 | 12.0 | 4.2 |
| 2016 | 31.6 | 35.1 | 12.9 | 14.3 | 6.1 |
|
|||||
The educational attainment of Anglophone agri-food workers in Outaouais improved between 2006 and 2016. However, it remained lower than that of their Anglophone counterparts across the province. The proportion of Anglophone agri-food workers in this CAR who had no certificate, diploma or degree decreased between 2006 (26.4%) and 2016 (23.4%) and the proportion who had a college or university degree increased over the decade, from 28.1% to 31.1%. However, in 2016, Anglophone workers in the Outaouais agri-food sector remained more likely than their Anglophone counterparts across Quebec to have no qualifications (23.4% versus 18.6%) and less likely to have a college or university degree (31.1% versus 37.0%).
Moreover, the educational attainment of Anglophone workers in the Outaouais agri-food sector was generally higher than that of their Francophone counterparts. The proportion of Francophone agri-food workers with no certificate, diploma or degree (31.6%) was larger than that of their Anglophone peers (23.4%) in 2016 and the proportion of Francophone agri-food workers who had a university degree (6.1%) was less than half that of their Anglophone counterparts (12.9%).
As elsewhere in the province, the proportion of Anglophone agri-food workers in the Outaouais CAR who had an apprenticeship or trades diploma as their highest qualification (7.4%) was lower than that of their Francophone counterparts (12.9%) in 2016. However, the proportion of Anglophone agri-food workers who had a postsecondary degree (38.5%) remained greater than that of their Francophone peers (33.3%).
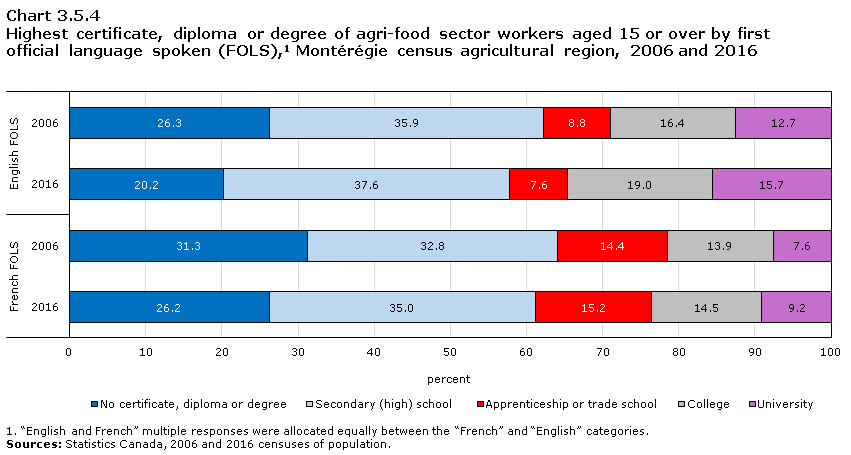
Data table for Chart 3.5.4
| No certificate, diploma or degree | Secondary (high) school | Apprenticeship or trade school | College | University | |
|---|---|---|---|---|---|
| percent | |||||
| English FOLS | |||||
| 2006 | 26.3 | 35.9 | 8.8 | 16.4 | 12.7 |
| 2016 | 20.2 | 37.6 | 7.6 | 19.0 | 15.7 |
| French FOLS | |||||
| 2006 | 31.3 | 32.8 | 14.4 | 13.9 | 7.6 |
| 2016 | 26.2 | 35.0 | 15.2 | 14.5 | 9.2 |
|
|||||
The educational attainment of Anglophone agri-food workers in Montérégie increased between 2006 and 2016. The proportion of these workers with no certificate, diploma or degree decreased over the decade, from 26.3% to 20.2%. Furthermore, the proportion with a college or university degree rose from 29.1% in 2006 to 34.7% in 2016.
In 2016, about one in four Francophone agri-food workers had no certificate, diploma or degree, a greater proportion than that of their Anglophone counterparts. The proportion of Francophone agri-food workers whose highest qualification was at the college level (14.5%) or university level (9.2%) was lower than that of their Anglophone counterparts (19.0% and 15.7%, respectively). As was the case across Quebec, the proportion of Anglophone agri-food workers with an apprenticeship or trades diploma (7.6%) was half that of their Francophone counterparts (15.2%) in Montérégie. However, Anglophone agri-food workers in this CAR remained more likely to have a postsecondary qualification (42.3%) than their Francophone peers (38.9%).
3.6 Class of worker
The vast majority of the Anglophone workers in Quebec’s agri-food sector were employees in 2006 (88.6%) and in 2016 (90.4%). These proportions were lower than those of their Francophone counterparts (94.1% in 2006 and 94.4% in 2016). In 2016, about 9% of Anglophone agri-food workers were self-employed, whether incorporated or not. This proportion was lower among their Francophone counterparts (around 5%).
There were few differences between the Montréal–Laval, Outaouais, and Montérégie CARs regarding the class of worker of Anglophone agri-food workers. In these regions, Anglophone agri-food workers were slightly more likely to be self-employed and less likely to be employees than Francophone agri-food workers.
3.7 Employment income
Employment income includes all income received as wages, salaries and commissions from paid employment and net self-employment income from farm or non-farm unincorporated business and/or professional practice during the calendar year prior to the census. The employment income of agri-food sector workers may include income from other sources than the job occupied in this sector.
This report contains information on all individuals categorized as workers, including those who worked during the reference week (for example, from May 1 to May 7, 2016) or the census year (e.g.: 2016), but who did not work in the year prior to the census (e.g.: 2015). However, as these workers did not work in the year prior to the census, their data are excluded from this section. They are identified by the category “not applicable” in the charts below and are excluded from the median income, work activity and average number of weeks worked per year calculations.
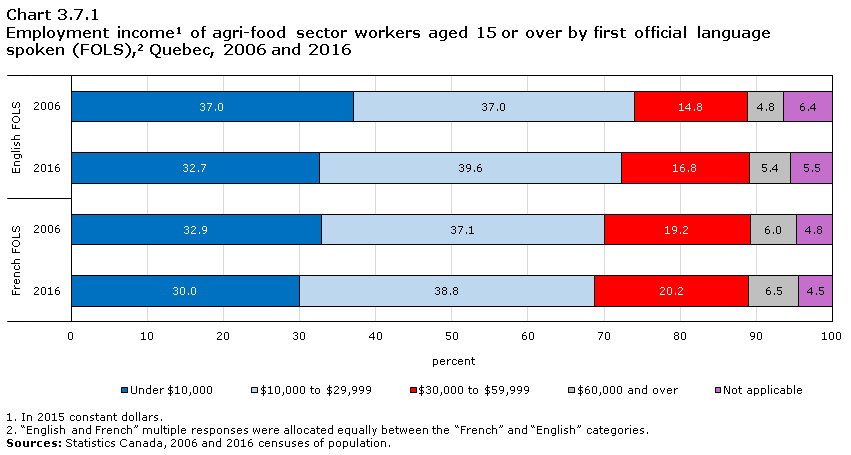
Data table for Chart 3.7.1
| Under $10,000 | $10,000 to $29,999 | $30,000 to $59,999 | $60,000 and over | Not applicable | |
|---|---|---|---|---|---|
| percent | |||||
| English FOLS | |||||
| 2006 | 37.0 | 37.0 | 14.8 | 4.8 | 6.4 |
| 2016 | 32.7 | 39.6 | 16.8 | 5.4 | 5.5 |
| French FOLS | |||||
| 2006 | 32.9 | 37.1 | 19.2 | 6.0 | 4.8 |
| 2016 | 30.0 | 38.8 | 20.2 | 6.5 | 4.5 |
|
|||||
In Quebec, the median employment income of Anglophone agri-food workers increased between 2006 ($13,860) and 2016 ($15,895). However, the employment income of Anglophone agri-food workers remained lower than that of their Francophone counterparts, whose median employment income increased from $16,000 in 2006 to $17,365 in 2016. In 2016, the proportion of Anglophone agri-food workers with an employment income under $10,000 (32.7%) was higher than that of their Francophone counterparts (30.0%) and the proportion of Anglophone agri-food workers with employment income above or equal to $30,000 (22.2%) was below that of their Francophone counterparts (26.7%).
The median employment income of Anglophone agri-food workers was lower than that of their Francophone peers, but this gap was smaller than in the agriculture sector in 2016 ($1,470 versus $4,135).
In 2016, 61.8% of Anglophone workers in Quebec’s agri-food sector worked full-time, compared to 59.5% of their Francophone counterparts. In addition, Anglophone agri-food workers worked on average 39.5 weeks per year, compared to 40.4 for their Francophone counterparts.
The median employment income gap between Anglophone men and women who worked in Quebec’s agri-food industry narrowed slightly between 2006 ($5,405) and 2016 ($5,050). The median employment income of Anglophone women working in this sector increased from $11,190 to $13,215 between 2006 and 2016, while that of men increased from $16,595 to $18,265 over the same period.
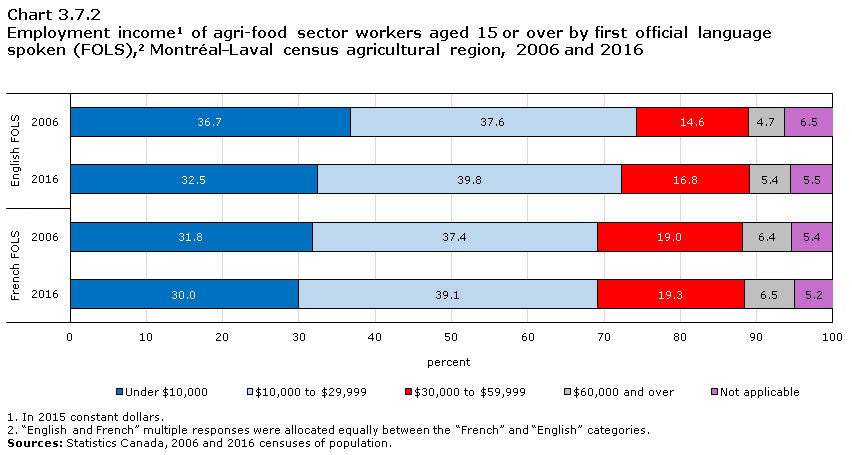
Data table for Chart 3.7.2
| Under $10,000 | $10,000 to $29,999 | $30,000 to $59,999 | $60,000 and over | Not applicable | |
|---|---|---|---|---|---|
| percent | |||||
| English FOLS | |||||
| 2006 | 36.7 | 37.6 | 14.6 | 4.7 | 6.5 |
| 2016 | 32.5 | 39.8 | 16.8 | 5.4 | 5.5 |
| French FOLS | |||||
| 2006 | 31.8 | 37.4 | 19.0 | 6.4 | 5.4 |
| 2016 | 30.0 | 39.1 | 19.3 | 6.5 | 5.2 |
|
|||||
The employment income of Anglophone agri-food workers in the Montréal–Laval CAR was very similar to that of their Anglophone counterparts across Quebec. There was a similar gap in median employment income between Anglophone and Francophone workers. The median employment income of Anglophone agri-food workers in this CAR increased from $13,920 in 2006 to $15,855 in 2016, while that of their Francophone counterparts rose from $16,650 in 2006 to $17,125 in 2016.
In 2016, the proportion of agri-food workers in Montréal–Laval who worked full-time was similar among Anglophones (61.5%) and Francophones (61.0%). The average number of weeks worked annually was also similar among Anglophone (39.6) and Francophone (39.5) agri-food workers.
The median employment income gap between Anglophone men and women working in the Montréal–Laval agri-food sector was relatively stable between 2006 ($5,190) and 2016 ($5,225). The median employment income of Anglophone women working in this CAR’s agri-food sector rose from $11,070 in 2006 to $12,975 in 2016, while that of men increased from $16,260 to $18,200 over the same period.
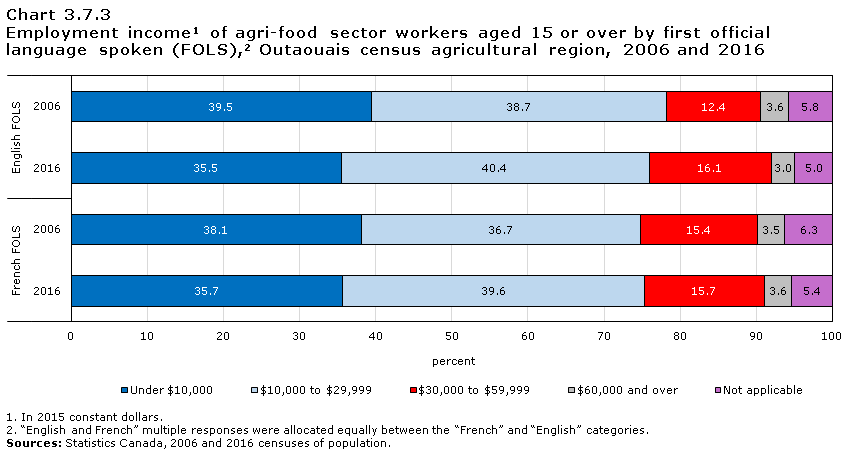
Data table for Chart 3.7.3
| Under $10,000 | $10,000 to $29,999 | $30,000 to $59,999 | $60,000 and over | Not applicable | |
|---|---|---|---|---|---|
| percent | |||||
| English FOLS | |||||
| 2006 | 39.5 | 38.7 | 12.4 | 3.6 | 5.8 |
| 2016 | 35.5 | 40.4 | 16.1 | 3.0 | 5.0 |
| French FOLS | |||||
| 2006 | 38.1 | 36.7 | 15.4 | 3.5 | 6.3 |
| 2016 | 35.7 | 39.6 | 15.7 | 3.6 | 5.4 |
|
|||||
In Outaouais, the median employment income of Anglophone agri-food workers increased between 2006 ($12,955) and 2016 ($15,100). The proportion of Anglophone agri-food workers with employment income below $10,000 declined from 39.5% in 2006 to 35.5% in 2016, and the proportion who reported employment income of $30,000 or more rose over the decade (16.0% in 2006 and 19.1% in 2016).
There was a smaller increase in the median employment income of Francophone agri-food workers between 2006 ($13,535) and 2016 ($14,015). In contrast to the provincial trend, the median employment income of Anglophone workers in the Outaouais agri-food sector was thus higher than that of their Francophone counterparts in 2016.
In 2016, the proportion of Anglophone agri-food workers who worked full-time (59.6%) surpassed that of their Francophone counterparts (53.1%) in Outaouais, which may help explain the median employment income gap between these workers. However, the average number of weeks worked per years was identical for Anglophone and Francophone agri-food workers (39.9).
In Outaouais, the median employment income gap between Anglophone men and women in the agri-food sector narrowed from $7,050 to $3,285 between 2006 and 2016. The median employment income of Anglophone women who worked in the sector rose from $9,810 in 2006 to $13,415 in 2016, while that of men rose from $16,855 in 2006 to $16,705 in 2016.
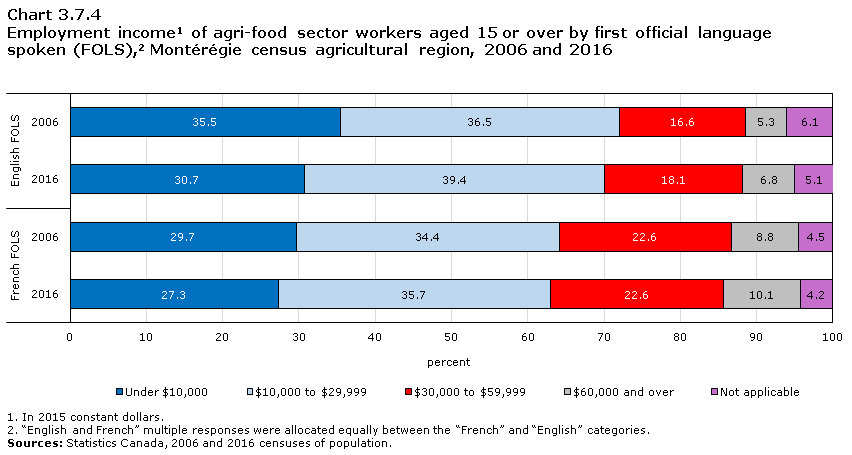
Data table for Chart 3.7.4
| Under $10,000 | $10,000 to $29,999 | $30,000 to $59,999 | $60,000 and over | Not applicable | |
|---|---|---|---|---|---|
| percent | |||||
| English FOLS | |||||
| 2006 | 35.5 | 36.5 | 16.6 | 5.3 | 6.1 |
| 2016 | 30.7 | 39.4 | 18.1 | 6.8 | 5.1 |
| French FOLS | |||||
| 2006 | 29.7 | 34.4 | 22.6 | 8.8 | 4.5 |
| 2016 | 27.3 | 35.7 | 22.6 | 10.1 | 4.2 |
|
|||||
In Montérégie, the median employment income of Anglophone agri-food workers rose from $14,555 to $17,040 between 2006 and 2016. The proportion of Anglophone workers in this CAR’s agri-food sector with low employment income – below $10,000 – decreased between 2006 (35.5%) and 2016 (30.7%).
The employment income of Anglophone agri-food workers was lower than that of their Francophone counterparts in Montérégie. The latter’s median employment income increased from $18,490 in 2006 to $19,740 in 2016. Nearly one in three Francophone agri-food workers reported employment income of $30,000 or more in 2016, compared with about one in four Anglophone agri-food workers.
The number of average weeks worked per year was slightly lower among Anglophone (40.3) than among Francophone (41.4) agri-food workers in 2016. However, the share of agri-food workers who worked full-time was similar for Anglophones (62.9%) and Francophones (62.5%).
The median employment income gap between Anglophone men and women in Montérégie’s agri-food sector fell between 2006 ($6,360) and 2016 ($4,755). The median employment income of Anglophone women working in this sector rose from $12,150 in 2006 to $14,920 in 2016, while that of men increased from $18,510 to $19,675 over the same period.
3.8 Industry
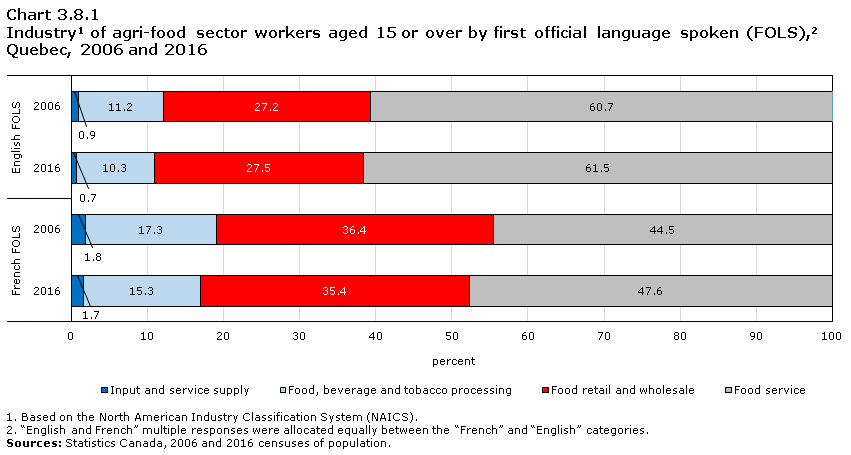
Data table for Chart 3.8.1
| Input and service supply | Food, beverage and tobacco processing | Food retail and wholesale | Food service | |
|---|---|---|---|---|
| percent | ||||
| English FOLS | ||||
| 2006 | 0.9 | 11.2 | 27.2 | 60.7 |
| 2016 | 0.7 | 10.3 | 27.5 | 61.5 |
| French FOLS | ||||
| 2006 | 1.8 | 17.3 | 36.4 | 44.5 |
| 2016 | 1.7 | 15.3 | 35.4 | 47.6 |
|
||||
Quebec’s Anglophone agri-food workers worked in similar industriesNote in 2006 and 2016. These industries differed from those of their Francophone counterparts. In 2016, Anglophone agri-food workers were more likely to work in food services (61.5%) than their Francophone counterparts (47.6%). In Quebec, workers in the food services industry had the lowest median employment income of all workers in the agri-food sector in 2016.
Furthermore, the proportions of Anglophone agri-food workers who worked in the food retail and wholesale industry (27.5%) or in the food, beverage and tobacco processing industry (10.3%) were lower than those of their Francophone counterparts (35.4% and 15.3%, respectively).
Young Anglophone agri-food workers – aged 15 to 34 – were more likely to work in food services (68.4%) than their counterparts who were aged 55 or older (50.7%) in 2016. Moreover, while the proportion of Francophone women working in the agri-food sector who were active in food services (54.4%) was greater than that of men (40.6%), there were few industry differences between men and women among their Anglophone counterparts.
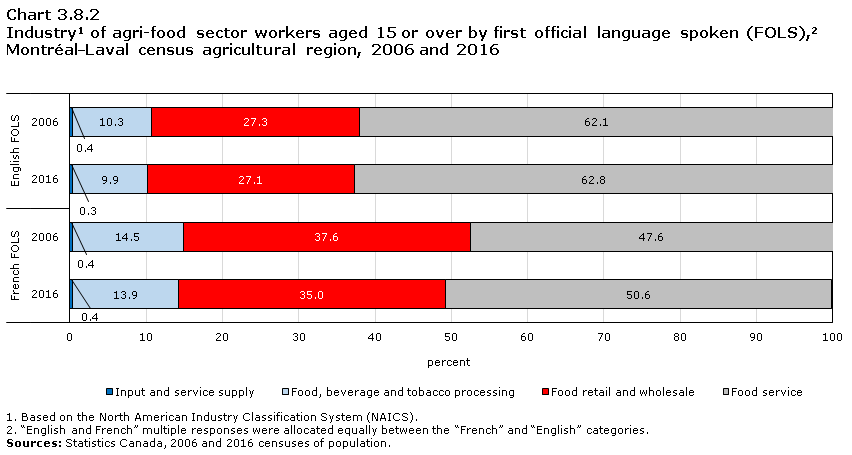
Data table for Chart 3.8.2
| Input and service supply | Food, beverage and tobacco processing | Food retail and wholesale | Food service | |
|---|---|---|---|---|
| percent | ||||
| English FOLS | ||||
| 2006 | 0.4 | 10.3 | 27.3 | 62.1 |
| 2016 | 0.3 | 9.9 | 27.1 | 62.8 |
| French FOLS | ||||
| 2006 | 0.4 | 14.5 | 37.6 | 47.6 |
| 2016 | 0.4 | 13.9 | 35.0 | 50.6 |
|
||||
In Montréal–Laval, Anglophone agri-food workers worked in similar industries than those of their Anglophone counterparts across the province. In 2016, more than three in five Anglophone agri-food workers worked in food services in this CAR, compared to about half of their Francophone counterparts.
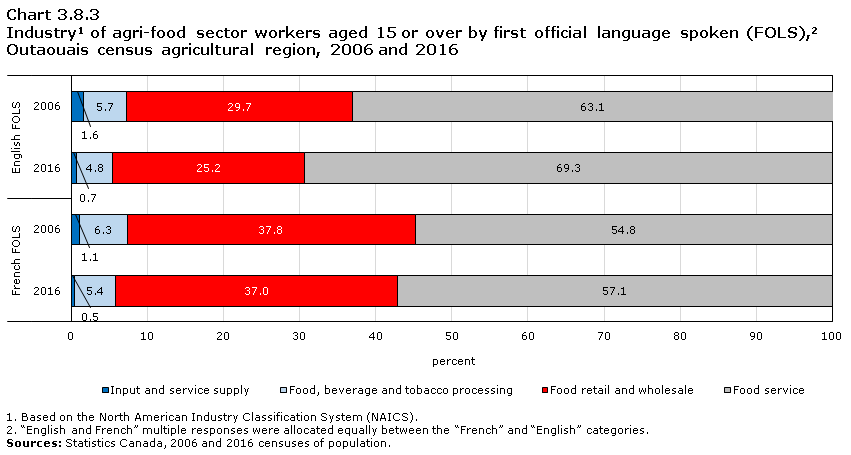
Data table for Chart 3.8.3
| Input and service supply | Food, beverage and tobacco processing | Food retail and wholesale | Food service | |
|---|---|---|---|---|
| percent | ||||
| English FOLS | ||||
| 2006 | 1.6 | 5.7 | 29.7 | 63.1 |
| 2016 | 0.7 | 4.8 | 25.2 | 69.3 |
| French FOLS | ||||
| 2006 | 1.1 | 6.3 | 37.8 | 54.8 |
| 2016 | 0.5 | 5.4 | 37.0 | 57.1 |
|
||||
In Outaouais, the proportion of Anglophone agri-food workers who worked in food services rose between 2006 (63.1%) and 2016 (69.3%). Anglophone agri-food workers were rmore likely to work in this industry than their Francophone counterparts (57.1%) in 2016. However, the latter were more likely to work in food retail and wholesale (37.0%) than their Anglophone peers (25.2%).
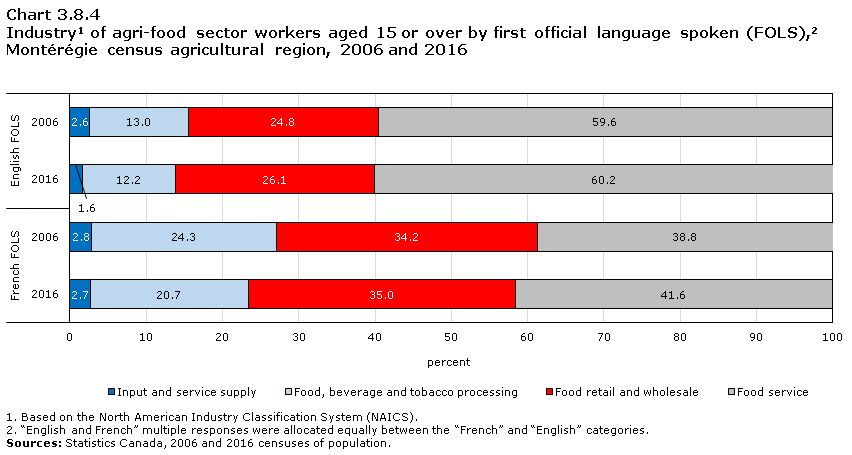
Data table for Chart 3.8.4
| Input and service supply | Food, beverage and tobacco processing | Food retail and wholesale | Food service | |
|---|---|---|---|---|
| percent | ||||
| English FOLS | ||||
| 2006 | 2.6 | 13.0 | 24.8 | 59.6 |
| 2016 | 1.6 | 12.2 | 26.1 | 60.2 |
| French FOLS | ||||
| 2006 | 2.8 | 24.3 | 34.2 | 38.8 |
| 2016 | 2.7 | 20.7 | 35.0 | 41.6 |
|
||||
In Montérégie, Anglophone agri-food workers worked in similar industries in 2006 and 2016. The proportion of Anglophone agri-food workers who worked in food services (60.2%) exceeded that of their Francophone peers (41.6%) in 2016. In addition, Francophone agri-food workers were more likely to work in food retail and wholesale than their Anglophone counterparts (35.0% versus 26.1%) and the proportion of Francophone agri-food workers who worked in food, beverage and tobacco processing (20.7%) surpassed that of their Anglophone counterparts (12.2%).
3.9 Languages used at work
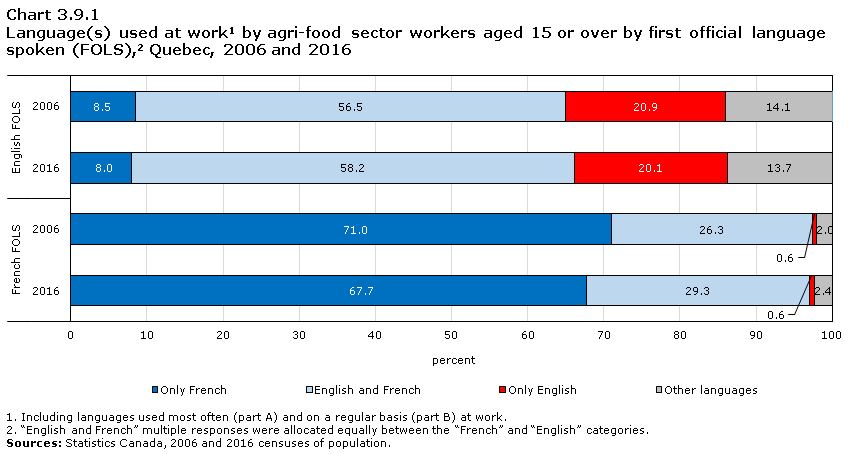
Data table for Chart 3.9.1
| Only French | English and French | Only English | Other languages | |
|---|---|---|---|---|
| percent | ||||
| English FOLS | ||||
| 2006 | 8.5 | 56.5 | 20.9 | 14.1 |
| 2016 | 8.0 | 58.2 | 20.1 | 13.7 |
| French FOLS | ||||
| 2006 | 71.0 | 26.3 | 0.6 | 2.0 |
| 2016 | 67.7 | 29.3 | 0.6 | 2.4 |
|
||||
The languages used at work by Anglophone workers in Quebec’s agri-food sector were similar in 2006 and 2016. About one in five Anglophone agri-food workers used only English at work and nearly three in five used both English and French in 2016. A lower proportion of Anglophone agri-food workers used only French at work (8.0%) or a language other than English or French (13.7%), either exclusively or with an official language.
In 2016, the proportion of Anglophone workers who used only English or only French at work was highest in the food, beverage and tobacco processing industry (23.7% and 12.5%, respectively).
Among Francophone agri-food workers, the proportion who used both English and French at work increased from 26.3% to 29.3% between 2006 and 2016.
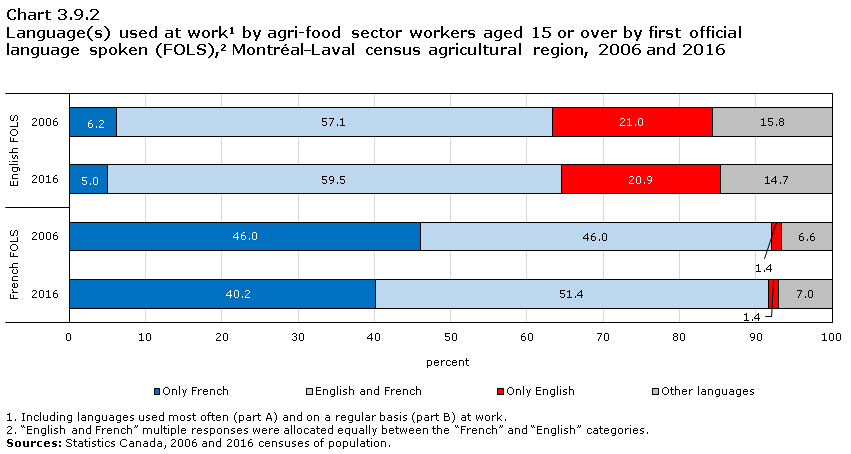
Data table for Chart 3.9.2
| Only French | English and French | Only English | Other languages | |
|---|---|---|---|---|
| percent | ||||
| English FOLS | ||||
| 2006 | 6.2 | 57.1 | 21.0 | 15.8 |
| 2016 | 5.0 | 59.5 | 20.9 | 14.7 |
| French FOLS | ||||
| 2006 | 46.0 | 46.0 | 1.4 | 6.6 |
| 2016 | 40.2 | 51.4 | 1.4 | 7.0 |
|
||||
The languages used at work by Anglophone agri-food workers in the Montréal–Laval CAR varied little from those used by their Anglophone counterparts across Quebec. The proportion of Anglophone agri-food workers in this CAR who used both English and French at work increased slightly between 2006 (57.1%) and 2016 (59.5%).
In the Montréal–Laval CAR, more than half of Francophone agri-food workers used both English and French at work in 2016, compared with less than 30% of Francophone agri-food workers across Quebec.
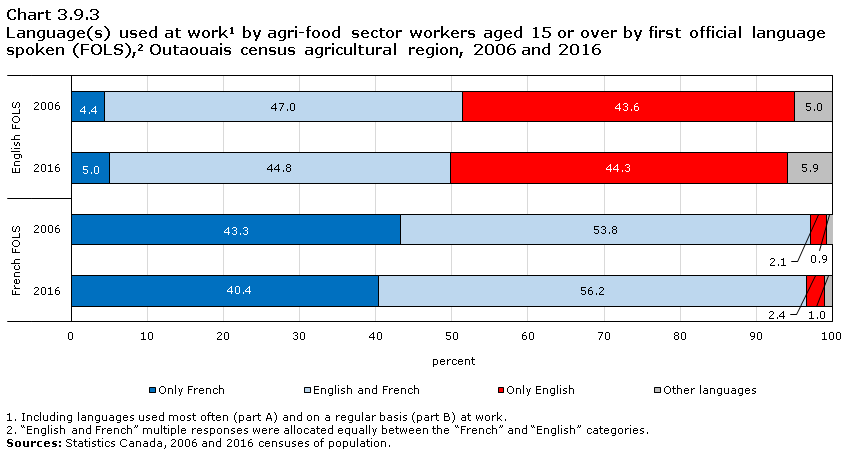
Data table for Chart 3.9.3
| Only French | English and French | Only English | Other languages | |
|---|---|---|---|---|
| percent | ||||
| English FOLS | ||||
| 2006 | 4.4 | 47.0 | 43.6 | 5.0 |
| 2016 | 5.0 | 44.8 | 44.3 | 5.9 |
| French FOLS | ||||
| 2006 | 43.3 | 53.8 | 2.1 | 0.9 |
| 2016 | 40.4 | 56.2 | 2.4 | 1.0 |
|
||||
In 2016, the share of Anglophone workers in the Outaouais agri-food sector who only used English at work (44.3%) was nearly double the provincial average for the sector’s Anglophone workers. The languages used at work by Anglophone agri-food workers in this CAR changed little between 2006 and 2016. However, the proportion who used English and French decreased slightly between 2006 (47.0%) and 2016 (44.8%). This proportion was lower than that of their Francophone counterparts, of which about 56% used English and French at work in 2016.
Data table for Chart 3.9.4
| Only French | English and French | Only English | Other languages | |
|---|---|---|---|---|
| percent | ||||
| English FOLS | ||||
| 2006 | 10.5 | 64.8 | 14.6 | 10.1 |
| 2016 | 10.6 | 64.7 | 13.9 | 10.8 |
| French FOLS | ||||
| 2006 | 69.0 | 29.6 | 0.4 | 1.0 |
| 2016 | 65.9 | 32.0 | 0.4 | 1.7 |
|
||||
In Montérégie, just under two in three Anglophone agri-food workers used both English and French at work in 2016. This proportion was above the provincial average for Anglophone agri-food workers (58.2%). The languages used at work by Anglophone agri-food workers in this CAR were similar in 2006 and 2016. About one in ten Anglophone agri-food workers used only French at work in 2016, and nearly one in seven used only English. Among their Francophone counterparts, nearly one-third used both English and French at work.
Conclusion
Certain trends emerge from this portrait of farms with English-speaking main operators and of Anglophone workers in Quebec’s agriculture and agri-food industries.
A larger proportion of farms with an English-speaking main operator reported low gross farm receipts.
In some respects, farms whose main operator was English-speaking were different from other Quebec farms. In 2016, a higher proportion of English-language farms reported low gross farm receipts, despite English-language farms being more likely to cover a large farm area. These differences can be explained in part by the concentration of English-language farms in certain farm types, such as cattle ranching and farming. However, further studies would be required to better understand these differences in farm receipts and farm area between English- and French-language farms.
International migration contributes to the Anglophone workforce in the agriculture and agri-food sectors
The proportion of Anglophone workers in the agriculture and agri-food sectors who were born outside Canada increased between 2006 and 2016. This increase is associated with a stable – albeit aging – Anglophone agricultural population, and a significant growth in the number of Anglophone workers in Quebec’s agri-food sector. This situation was observed in the CARs of Outaouais and Montérégie, and particularly in Montréal–Laval, which is located in the heart of the Montréal CMA, where a large number of immigrants choose to settle. In this CAR, the number of Anglophone workers in the agriculture and agri-food sectors rose sharply over the decade.
A small proportion of Anglophone agricultural workers had an apprenticeship or trades diploma as their highest qualification
On one hand, Anglophone agricultural workers were more likely to have a college or university degree than their Francophone counterparts in 2006 and 2016. On the other hand, at the provincial level and in the Montréal–Laval CAR, they were also less likely to have a postsecondary diploma than their Francophone peers, mainly due to the small proportion of Anglophone agricultural workers with an apprenticeship or trades diploma as their highest qualification.
The median employment income of Anglophone workers in the agricultural and agri-food sectors was lower than that of their Francophone counterparts
One particularly striking observation is the gap in median employment income between Anglophone and Francophone workers in the agricultural and agri-food sectors. In the case of the agriculture sector, this gap widened between 2006 and 2016. In this sector, the lower employment income of Anglophone workers may be explained by the smaller proportion of Anglophone workers who worked full-time or by the smaller proportion of Anglophone workers with a postsecondary qualification. As for the agri-food sector, the concentration of Anglophone workers in food services, an industry for which median employment income is lower, may partly explain the employment income gap with their Francophone counterparts. Lastly, in the agriculture and agri-food sectors, the proportion of workers born outside Canada was higher among Anglophones than among their Francophone counterparts, with immigrants facing additional challenges on the labour market.
Future studies would provide a better understanding of the dynamics that may explain this gap in median employment income between Anglophone and Francophone workers in Quebec’s agriculture and agri-food sectors.
Differences observed between language groups could be related to multiple factors not studied in this descriptive report. Further research would be necessary to assess their contribution.
Glossary
Census farm: A farm, ranch or other agricultural operation that produces at least one of the following products intended for sale: crops, livestock, poultry, animal products, greenhouse or nursery products, Christmas trees, mushrooms, sod, honey or bees, and maple syrup products. Sales in the previous 12 months are not required, but there must be the intention to sell.
Census of Agriculture: Statistics Canada conducts the Census of Agriculture every five years to develop a statistical portrait of Canada’s farms and its agricultural operators. The data provides users with a comprehensive picture of the major commodities of the agriculture industry while also supplying information on new or less common crops, livestock, finances and use of technology.
This study uses data from the 2016 Census of Agriculture in order to present information on farms: operating arrangements, farm type, age group and generational profile of operators, land tenure, total farm area, total gross farm receipts and total farm capital. This information is presented by the first official language of the first operator listed on the 2016 Census of Agriculture form for each farm. The first official language spoken of this operator is derived from their responses to the 2016 short-form Census of Population.
Census of Population: Statistics Canada conducts the Census of Population every five years in order to paint a statistical portrait of Canada and Canadians on one specific day. The census is designed to provide information about people and housing units in Canada by their demographic, social and economic characteristics. A sample of Canada households (25% in 2016 and 20% in 2006) receive a long-form questionnaire. All other households receive a short-form questionnaire.
This study uses data from the 2006 and 2016 long-form censuses of population in order to present change in the characteristics of French-speaking and English-speaking workers by their first official language spoken in agriculture and agri-food sectors. These characteristics include age, sex, place of birth, Indigenous identity, level of education, class of worker, employment income, languages used at work and industry. In addition, this study uses data from the 2016 short-form Census of Population in order to derive the first official language spoken of the first operator listed on the 2016 Census of Agriculture form for every farm.
Class of worker: Refers to whether a person is an employee or is self-employed.
Employment income: All income received as wages, salaries and commissions from paid employment and net self-employment income from farm or non-farm unincorporated business and/or professional practice during the calendar year preceding the census.
Farm area: Refers to land owned or operated by an agricultural operation. This includes cropland, summer fallow, improved and unimproved pasture, woodlands and wetlands, and all other land (including idle land and land on which farm buildings are located).
Farm capital: Refers to the value of all farmland, buildings, farm machinery and equipment, and livestock and poultry, as reported on Census Day. Farm capital does not include the value of crops in the field or in storage, or farm inputs on hand, such as fertilizer and seed.
Farm operator: Those persons responsible for the management decisions in operating an agricultural operation. These can be owners, tenants or hired managers of the agricultural operation.
First official language spoken: Refers to a variable defined within the framework of the Official Languages Act. It refers to the first official language (i.e., English or French) spoken by the person. The derivation method first takes into account the knowledge of the two official languages, then the mother tongue, and finally the language spoken most often at home.
People are assigned to the “French” category when it is the only official language they speak well enough to conduct a conversation; when they can conduct a conversation in French or in English, or in neither language, and have French as their mother tongue (alone or in combination with a non-official language); or when they can conduct a conversation in French or English, or in neither language, have both French and English as their mother tongue, or neither language, and speak French most often at home (alone or in combination with a non-official language).
People are assigned to the “English” category when it is the only official language they speak well enough to conduct a conversation; when they can conduct a conversation in French or in English, or in neither language, and have English as their mother tongue (alone or in combination with a non-official language); or when they can conduct a conversation in English or French, or in neither language, have both French and English as their mother tongue, or neither language, and speak English most often at home (alone or in combination with a non-official language).
People are assigned to “English and French” when they speak both English and French well enough to conduct a conversation and when their mother tongues and languages used most often at home are both English and French or neither English nor French.
People are assigned to “Neither English nor French” when they speak neither English nor French well enough to conduct a conversation and when their mother tongue and language used most often at home is a language other than English or French.
Gross farm receipt: Refers to the receipts from all agricultural products sold, program payments and custom work receipts of the agricultural operation in the year prior to the census or the last complete accounting (fiscal) year. It does not include sales of forestry products (firewood, pulpwood, logs, fence posts, etc.), of capital items (quota, land, machinery, etc.), or receipts from the sale of any goods purchased only for retail sales. It is gross receipts before deducting expenses.
Appendix A
| NAICSTable A.1 Note 1 codes | |||
|---|---|---|---|
| 2006 CensusTable A.1 Note 2 | 2016 CensusTable A.1 Note 3 | ||
| 1110 Farms (1111 to 1129) | 1111 Oilseed and grain farming | 1110 Farms (except Greenhouse production and Aquaculture) | 1111 Oilseed and grain farming |
| 1112 Vegetable and melon farming | 1112 Vegetable and melon farming | ||
| 1113 Fruit and tree nut farming | 1113 Fruit and tree nut farming | ||
| 1114 Greenhouse, nursery and floriculture production | 1119 Other crop farming | ||
| 1119 Other crop farming | 1121 Cattle ranching and farming | ||
| 1121 Cattle ranching and farming | 1122 Hog and pig farming | ||
| 1122 Hog and pig farming | 1123 Poultry and egg production | ||
| 1123 Poultry and egg production | 1124 Sheep and goat farming | ||
| 1124 Sheep and goat farming | 1129 Other animal production | ||
| 1125 Animal aquaculture | 1114 Greenhouse, nursery and floriculture production | ||
| 1129 Other animal production | 1125 Aquaculture | ||
|
|||
| Industry | NAICSTable A.2 Note 1 codes | |
|---|---|---|
| 2006 CensusTable A.2 Note 2 | 2016 CensusTable A.2 Note 3 | |
| Input and service supply | 1150 Support activities for agriculture and forestry | 1150 Support activities for agriculture and forestry |
| 3253 Pesticide, fertilizer and other agricultural chemical manufacturing | 3253 Pesticide, fertilizer and other agricultural chemical manufacturing | |
| 4171 Farm, lawn and garden machinery and equipment wholesaler-distributors | 4171 Farm, lawn and garden machinery and equipment merchant wholesalers | |
| 4183 Agricultural supplies wholesaler-distributors | 4183 Agricultural supplies merchant wholesalers | |
| Food, beverage and tobacco processing | 3111 Animal food manufacturing | 3111 Animal food manufacturing |
| 3112 Grain and oilseed milling | 3112 Grain and oilseed milling | |
| 3113 Sugar and confectionery product manufacturing | 3113 Sugar and confectionery product manufacturing | |
| 3114 Fruit and vegetable preserving and specialty food manufacturing fruit and vegetable preserving and specialty food manufacturing | 3114 Fruit and vegetable preserving and specialty food manufacturing fruit and vegetable preserving and specialty food manufacturing | |
| 3115 Dairy product manufacturing | 3115 Dairy product manufacturing | |
| 3116 Meat product manufacturing | 3116 Meat product manufacturing | |
| 3117 Seafood product preparation and packaging | 3117 Seafood product preparation and packaging | |
| 3118 Bakeries and tortilla manufacturing | 3118 Bakeries and tortilla manufacturing | |
| 3119 Other food manufacturing | 3119 Other food manufacturing | |
| 3121 Beverage manufacturing | 3121 Beverage manufacturing | |
| 3122 Tobacco manufacturing | 3122 Tobacco manufacturing | |
| Food retail and wholesale | 4111 Farm product wholesaler-distributors | 4111 Farm product merchant wholesalers |
| 4131 Food wholesaler-distributors | 4131 Food merchant wholesalers | |
| 4132 Beverage wholesaler-distributors | 4132 Beverage merchant wholesalers | |
| 4133 Cigarette and tobacco product wholesaler-distributors | 4133 Cigarette and tobacco product merchant wholesalers | |
| 4451 Grocery stores | 4451 Grocery stores | |
| 4452 Specialty food stores | 4452 Specialty food stores | |
| 4453 Beer, wine and liquor stores | 4453 Beer, wine and liquor stores | |
| Food service | 4542 Vending machine operators | 4542 Vending machine operators |
| 7221 Full-service restaurants | 7223 Special food services | |
| 7222 Limited-service eating places | 7224 Drinking places (alcoholic beverages) | |
| 7223 Special food services | 7225 Full-service restaurants and limited-service eating places | |
| 7224 Drinking places (alcoholic beverages) | ||
|
||
Appendix B
| Census agricultural region | FOLS | |||||||
|---|---|---|---|---|---|---|---|---|
| 2006 | 2016 | |||||||
| English | French | Neither English nor French | Total | English | French | Neither English nor French | Total | |
| number | ||||||||
| Abitibi-Témiscamingue–Nord-du-Québec | 55 | 1,615 | 0 | 1,670 | 40 | 1,345 | 0 | 1,385 |
| Bas-Saint-Laurent | 10 | 5,655 | 0 | 5,665 | 15 | 4,815 | 0 | 4,825 |
| Centre-du-Québec | 135 | 8,485 | 25 | 8,650 | 125 | 7,690 | 100 | 7,915 |
| Chaudière-Appalaches | 45 | 10,400 | 0 | 10,450 | 80 | 10,310 | 25 | 10,415 |
| Estrie | 795 | 4,735 | 20 | 5,555 | 680 | 4,960 | 40 | 5,690 |
| Gaspésie–Îles-de-la-Madeleine | 55 | 550 | 0 | 605 | 70 | 455 | 0 | 530 |
| Lanaudière | 50 | 4,800 | 130 | 4,970 | 30 | 3,950 | 10 | 3,990 |
| Laurentides | 250 | 3,490 | 0 | 3,740 | 235 | 3,605 | 125 | 3,965 |
| Mauricie | 15 | 2,755 | 0 | 2,780 | 20 | 2,625 | 10 | 2,660 |
| Montérégie | 1,890 | 16,390 | 175 | 18,450 | 1,650 | 16,665 | 275 | 18,585 |
| Montréal–Laval | 495 | 1,620 | 115 | 2,225 | 715 | 2,065 | 165 | 2,950 |
| Outaouais | 680 | 1,065 | 15 | 1,760 | 765 | 1,000 | 0 | 1,775 |
| Québec | 60 | 3,525 | 0 | 3,590 | 65 | 3,395 | 50 | 3,510 |
| Saguenay–Lac-St-Jean–Côte-Nord | 15 | 3,100 | 0 | 3,120 | 20 | 3,110 | 0 | 3,135 |
| Total: Quebec | 4,545 | 68,200 | 485 | 73,230 | 4,525 | 65,990 | 810 | 71,325 |
| percent | ||||||||
| Abitibi-Témiscamingue–Nord-du-Québec | 3.2 | 96.6 | 0.0 | 100.0 | 2.9 | 97.1 | 0.0 | 100.0 |
| Bas-Saint-Laurent | 0.2 | 99.8 | 0.0 | 100.0 | 0.3 | 99.7 | 0.0 | 100.0 |
| Centre-du-Québec | 1.5 | 98.1 | 0.3 | 100.0 | 1.6 | 97.1 | 1.3 | 100.0 |
| Chaudière-Appalaches | 0.4 | 99.6 | 0.0 | 100.0 | 0.8 | 99.0 | 0.3 | 100.0 |
| Estrie | 14.4 | 85.3 | 0.4 | 100.0 | 12.0 | 87.3 | 0.7 | 100.0 |
| Gaspésie–Îles-de-la-Madeleine | 9.4 | 90.6 | 0.0 | 100.0 | 14.1 | 85.9 | 0.0 | 100.0 |
| Lanaudière | 1.0 | 96.5 | 2.5 | 100.0 | 0.8 | 98.9 | 0.3 | 100.0 |
| Laurentides | 6.7 | 93.3 | 0.0 | 100.0 | 5.9 | 90.9 | 3.2 | 100.0 |
| Mauricie | 0.5 | 99.3 | 0.0 | 100.0 | 0.9 | 98.7 | 0.4 | 100.0 |
| Montérégie | 10.2 | 88.8 | 0.9 | 100.0 | 8.9 | 89.7 | 1.5 | 100.0 |
| Montréal—Laval | 22.1 | 72.8 | 5.1 | 100.0 | 24.3 | 70.2 | 5.5 | 100.0 |
| Outaouais | 38.5 | 60.5 | 1.0 | 100.0 | 43.2 | 56.5 | 0.0 | 100.0 |
| Québec | 1.7 | 98.3 | 0.0 | 100.0 | 1.9 | 96.8 | 1.4 | 100.0 |
| Saguenay–Lac-St-Jean–Côte-Nord | 0.5 | 99.5 | 0.0 | 100.0 | 0.6 | 99.3 | 0.0 | 100.0 |
| Total: Quebec | 6.2 | 93.1 | 0.7 | 100.0 | 6.3 | 92.5 | 1.1 | 100.0 |
Sources: Statistics Canada, 2006 and 2016 censuses of population. |
||||||||
| Census agricultural region | FOLS | |||||||
|---|---|---|---|---|---|---|---|---|
| 2006 | 2016 | |||||||
| English | French | Neither English nor French | Total | English | French | Neither English nor French | Total | |
| number | ||||||||
| Abitibi-Témiscamingue–Nord-du-Québec | 870 | 9,925 | 15 | 10,810 | 1,385 | 9,575 | 15 | 10,975 |
| Bas-Saint-Laurent | 85 | 13,060 | 0 | 13,155 | 70 | 13,190 | 0 | 13,270 |
| Centre-du-Québec | 220 | 16,335 | 30 | 16,580 | 205 | 17,830 | 45 | 18,080 |
| Chaudière-Appalaches | 210 | 28,085 | 0 | 28,315 | 335 | 30,325 | 0 | 30,665 |
| Estrie | 1,115 | 15,790 | 10 | 16,915 | 1,360 | 17,750 | 30 | 19,135 |
| Gaspésie–Îles-de-la-Madeleine | 495 | 8,155 | 0 | 8,650 | 545 | 7,340 | 0 | 7,885 |
| Lanaudière | 670 | 29,060 | 45 | 29,775 | 1,000 | 32,645 | 50 | 33,690 |
| Laurentides | 1,795 | 33,390 | 20 | 35,210 | 2,445 | 37,185 | 55 | 39,690 |
| Mauricie | 135 | 15,625 | 15 | 15,780 | 270 | 16,550 | 20 | 16,840 |
| Montérégie | 9,255 | 88,420 | 440 | 98,110 | 12,310 | 94,410 | 870 | 107,590 |
| Montréal–Laval | 44,260 | 91,135 | 2,195 | 137,585 | 55,195 | 102,270 | 2,955 | 160,415 |
| Outaouais | 3,515 | 15,375 | 25 | 18,915 | 4,535 | 16,880 | 105 | 21,515 |
| Québec | 665 | 43,085 | 70 | 43,820 | 1,180 | 48,530 | 120 | 49,830 |
| Saguenay–Lac-St-Jean–Côte-Nord | 615 | 22,665 | 0 | 23,290 | 575 | 22,880 | 0 | 23,460 |
| Total: Quebec | 63,915 | 430,105 | 2,890 | 496,910 | 81,405 | 467,365 | 4,270 | 553,045 |
| percent | ||||||||
| Abitibi-Témiscamingue–Nord-du-Québec | 8.1 | 91.8 | 0.2 | 100.0 | 12.7 | 87.2 | 0.1 | 100.0 |
| Bas-Saint-Laurent | 0.7 | 99.3 | 0.0 | 100.0 | 0.5 | 99.4 | 0.0 | 100.0 |
| Centre-du-Québec | 1.3 | 98.5 | 0.2 | 100.0 | 1.1 | 98.6 | 0.2 | 100.0 |
| Chaudière-Appalaches | 0.8 | 99.2 | 0.0 | 100.0 | 1.1 | 98.9 | 0.0 | 100.0 |
| Estrie | 6.6 | 93.3 | 0.1 | 100.0 | 7.1 | 92.8 | 0.2 | 100.0 |
| Gaspésie–Îles-de-la-Madeleine | 5.8 | 94.2 | 0.0 | 100.0 | 6.9 | 93.1 | 0.0 | 100.0 |
| Lanaudière | 2.2 | 97.6 | 0.2 | 100.0 | 3.0 | 96.9 | 0.1 | 100.0 |
| Laurentides | 5.1 | 94.8 | 0.1 | 100.0 | 6.2 | 93.7 | 0.1 | 100.0 |
| Mauricie | 0.9 | 99.0 | 0.1 | 100.0 | 1.6 | 98.3 | 0.1 | 100.0 |
| Montérégie | 9.4 | 90.1 | 0.4 | 100.0 | 11.4 | 87.8 | 0.8 | 100.0 |
| Montréal–Laval | 32.2 | 66.2 | 1.6 | 100.0 | 34.4 | 63.8 | 1.8 | 100.0 |
| Outaouais | 18.6 | 81.3 | 0.1 | 100.0 | 21.1 | 78.5 | 0.5 | 100.0 |
| Québec | 1.5 | 98.3 | 0.2 | 100.0 | 2.4 | 97.4 | 0.2 | 100.0 |
| Saguenay–Lac-St-Jean–Côte-Nord | 2.6 | 97.3 | 0.0 | 100.0 | 2.4 | 97.5 | 0.0 | 100.0 |
| Total: Quebec | 12.9 | 86.6 | 0.6 | 100.0 | 14.7 | 84.5 | 0.8 | 100.0 |
Sources: Statistics Canada, 2006 and 2016 censuses of population. |
||||||||
- Date modified: