
Aboriginal Peoples Survey
Inuit participation in the wage and land-based economies in Inuit Nunangat

Archived Content
Information identified as archived is provided for reference, research or recordkeeping purposes. It is not subject to the Government of Canada Web Standards and has not been altered or updated since it was archived. Please "contact us" to request a format other than those available.
by Paula Arriagada and Amanda Bleakney
Skip to text
Text begins
Introduction
Inuit are the original people from the North American Arctic. In Canada, Inuit communities have stretched from the westernmost Arctic to the eastern shores of Newfoundland and Labrador for uncounted generations. This area known as Inuit Nunangat includes communities located in the four Inuit regions: Nunatsiavut (Northern coastal Labrador), Nunavik (Northern Quebec), the territory of Nunavut, and the Inuvialuit region (Northwest Territories).Note
In 2016, there were 65,025 Inuit in Canada, and close to three-quarters (73%) lived in Inuit Nunangat. According to the Census, the Inuit population increased 29% from 2006 to 2016. Inside Inuit Nunangat, the Inuit population grew by 20% compared with outside of Inuit Nunangat where the Inuit population grew by 62%. The rapid growth of the Inuit population is expected to continue. According to all scenarios from the most recent Aboriginal population projections, the Inuit population overall could reach between 86,000 and 95,000 people by 2036, while Inuit living in Inuit Nunangat could reach between 64,000 and 72,000 (Morency et al., 2015).
The Inuit population is also young, with an average age of 27.7 years, significantly younger than the non-Aboriginal population (40.9 years). In 2016, the average age of Inuit in Inuit Nunangat was even younger, at 26.4 years compared with 31.2 years for Inuit living outside Inuit Nunangat. The aging of this young population and subsequent entry into the labour market will have numerous implications regarding employment opportunities and the need for economic growth in Inuit Nunangat in the coming decades (Palesch, 2016).
Research has shown that Inuit, as well as Métis and First Nations people, have experienced significant disparities in the labour market. These inequalities are reflected in lower employment and participation rates, and higher unemployment compared to the non-Aboriginal population (Moyser, 2017; Pendakur and Pendakur, 2011; Wilson and MacDonald, 2010; Bernier, 1997).
In addition, existing research has highlighted numerous factors related to less favourable labour market outcomes among Inuit. These factors include lower educational attainment, insufficient training, greater geographic mobility, as well as weak infrastructure in communities to support employment (Palesch, 2016; Pauktuutit Inuit Women of Canada, 2016; Ciceri and Scott, 2006; Conference Board of Canada, 2002). Limited access to postsecondary education, lack of affordable housing, lack of childcare, and shortage of jobs are other barriers to economic participation that have been identified (Robertson, 2018; Palesch, 2016; Pauktuutit Inuit Women of Canada, 2016; Thomas, 2016).
These labour force indicators need to be considered in the context of the unique mixed economy that has developed in Inuit Nunangat, linking land-based activities with the wage economy (Inuit Tapiriit Kanatami and Aboriginal Affairs and Northern Development Canada, 2007). For example, while many Inuit engage in land-based activities, others have had to adapt to the growing pressures on hunting or fishing (such as increasing costs, climate change, erosion of land-based knowledge and skills, and changing interests) by entering the wage economy (Kumar et al., 2019; Laidler et al., 2009). At the same time, for many other Inuit, engagement in the wage economy takes precedence over participating in land-based activities. This relationship between the wage economy and land-based activities will continue to evolve with the changing demographic and socio-economic characteristics of Inuit, as Inuit increasingly participate in formal schooling and the population continues to age (Kumar et al., 2019). An understanding of the wage economy and land-based activities among Inuit is essential in the development of policies and programs to increase participation in both.
Using data from the 2017 Aboriginal Peoples Survey (APS), this paper examines participation in both wage-based and land-based economies among Inuit living in Inuit Nunangat. The land-based economy normally encompasses activities such as hunting, fishing, trapping and gathering wild plants (Inuit Tapiriit Kanatami, 2018; Clinton and Vail, 2008); however, for the purpose of this study, making clothing and footwear as well as handicrafts and artwork will also be included. This paper focuses exclusively on Inuit Nunangat as this is where the majority of Inuit live, and additionally where the majority of land-based activities among Inuit take place (Robertson, 2018).
Specifically, the first part of the paper examines participation in the wage economy among Inuit living in Inuit Nunangat, focusing on a breakdown by occupation and industrial sector. It is important to note that although in some instances data for Inuit aged 15 and older may be presented, most of the analyses will focus on those in the core working age group (25 to 54). This age restriction is applied to allow for a more focused analysis of socio-economic factors.
The second section presents data on Inuit adults engaged in the land-based economy with a focus on selected factors associated with such participation in order to better understand the diverse Inuit Nunangat economy. Finally, the discussion provides insight into areas such as education and childcare availability, which may help close the labour gap for Inuit living in Inuit Nunangat. This section ends by highlighting the importance of finding ways to increase or maintain participation in land-based activities that are vital to the identity, culture and nutrition of Inuit.
Overview of the wage economy in Inuit Nunangat
According to the 2017 APS, just over half (52%) of Inuit aged 15 or older living in Inuit Nunangat were employed. The results show little difference among men and women: 53% of Inuit women were employed compared with 51% of Inuit men. There were, however, differences in employment by age. Among core working age Inuit aged 25 to 54, the employment rate was 61% compared with 42% for those aged 55 and older, and 40% for Inuit aged 15 to 24.
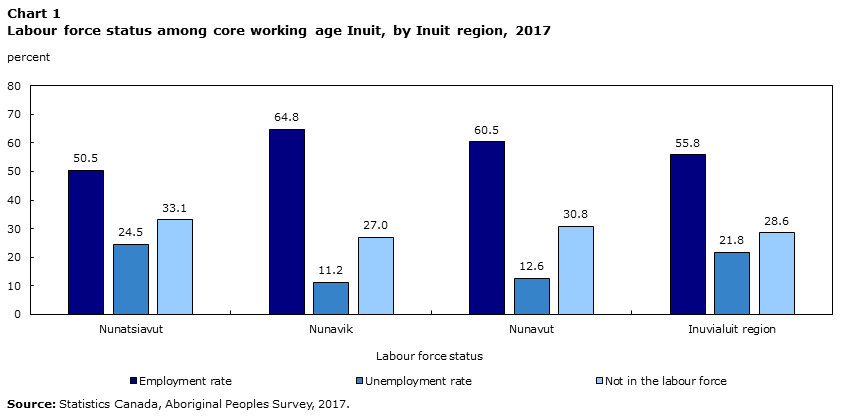
There were also differences across regions within Inuit Nunangat. Specifically, the share of the core working age Inuit who were employed ranged from 51% in Nunatsiavut and 56% in the Inuvialuit region, to 61% in Nunavut and 65% in Nunavik (Chart 1).
Data table for Chart 1
| Employment rate | Unemployment rate | Not in the labour force | |
|---|---|---|---|
| percent | |||
| Nunatsiavut | 50.5 | 24.5 | 33.1 |
| Nunavik | 64.8 | 11.2 | 27.0 |
| Nunavut | 60.5 | 12.6 | 30.8 |
| Inuvialuit region | 55.8 | 21.8 | 28.6 |
| Source: Statistics Canada, Aboriginal Peoples Survey, 2017. | |||
The majority (79%) of employed Inuit living in Inuit Nunangat had a permanent job in 2017. This was most common among those aged 55 and older and Inuit in the core working age group (83% and 82%, respectively), compared with 66% of those aged 15 to 24.
Furthermore, among employed Inuit living in Inuit Nunangat, almost a quarter (23%) worked part-time; that is, less than 30 hours per week at their main job. Young Inuit adults were the most likely to work part-time (41%) compared to 19% of those aged 55 and older, and 17% of Inuit aged 25 to 54.Note
In 2017, the overall unemployment rateNote among Inuit aged 15 and older and living in Inuit Nunangat was 16%. A higher proportion of Inuit men were unemployed than Inuit women but this difference was not statistically significant (19% compared with 14%). Again, there were differences by age as the unemployment rate was higher among younger Inuit at 26% than Inuit aged 25 to 54 (14%) and 9% for those aged 55 and older. Among core working age Inuit, unemployment rates were highest in Nunatsiavut (25%), followed by the Inuvialuit region (22%), Nunavut (13%), and 11% for Nunavik.
In addition, more than a third (38%) of Inuit aged 15 and older living in Inuit Nunangat were not in the labour forceNote in 2017 (38% for Inuit men and 39% for Inuit women). This was most common among older adults (54%), followed by those aged 15 to 24 (46%), and core working age adults (30%). Across the Inuit regions, the proportions for the core working age population ranged from 33% in Nunatsiavut to 31% in Nunavut, 29% in the Inuvialuit region, and 27% in Nunavik.
Individuals can be out of the labour force for a number of reasons including being retired, caring for children/other family members, going to school, having a chronic illness or disability, or being a discouraged searcher (that is, those who want to work and are available to work, but did not look for work because they believed no suitable work was available). Being a discouraged searcher was the most commonly reported reason for not being in the labour force among core working age Inuit living in Inuit Nunangat (30%). Furthermore, Inuit men aged 25 to 54 living in Inuit Nunangat were more likely than Inuit women to report being a discouraged searcher (42% versus 14%Note E: Use with caution).
When discussing labour force participation among Inuit, it is also important to recognize that the Inuit Nunangat economy relies on certain sectors for most of their employment (Pauktuutit Inuit Women of Canada, 2016). Specifically, the Inuit Nunangat regions are predominantly driven by public sector industries such as federal, territorial, and municipal public administration, health, social assistance and education, as well as natural resources sectors. For example, data from the 2017 APS Nunavut Inuit Supplement showed that more than half of Inuit enrolled under the Nunavut Agreement in Nunavut reported working for either the federal, territorial or municipal governments.Note
This section of the paper uses the North American Industry Classification System (NAICS)Note and the National Occupational Classification (NOC)Note to examine the representation of Inuit across different industrial sectors and occupations in Inuit Nunangat. This is important because it will allow for a more comprehensive understanding of the labour force participation among this population.
Public administration is the most prevalent industry among employed core working age Inuit living in Inuit Nunangat
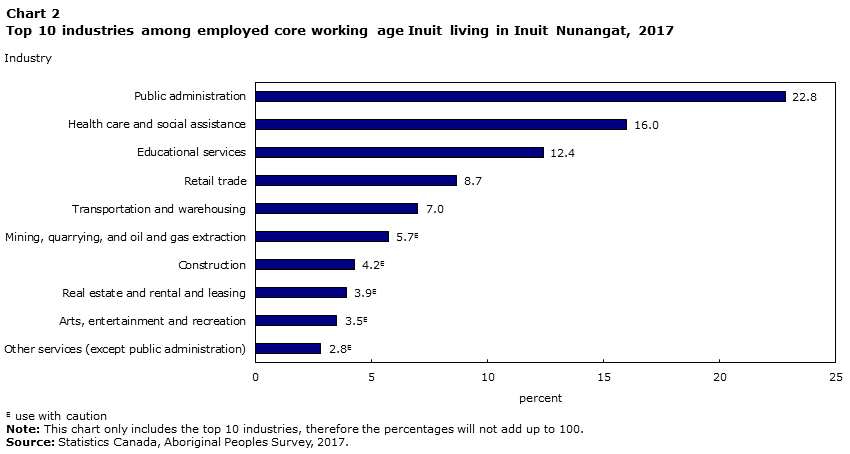
In 2017, and with the exception of Nunavik, public administration was the most prevalent industry among core working age Inuit living in Inuit Nunangat (23%), followed by health care and social assistance (16%), educational services (12%), retail trade (9%), and transportation and warehousing (7%) (Chart 2).
Nunavik’s top industry was health care and social assistance (22%), and was significantly higher than the share in the Inuvialuit region (14%) and Nunavut (14%). Educational services was also higher among those living in Nunavik (14%) and Nunavut (13%), compared to those in the Inuvialuit region (7%Note E: Use with caution) and Nunatsiavut (7%Note E: Use with caution). Employment in mining, quarrying, and oil and gas extraction was more prevalent within Nunatsiavut (11%Note E: Use with caution) and Nunavut (7%Note E: Use with caution).
Data table for Chart 2
| Industry | Percent |
|---|---|
| Public administration | 22.8 |
| Health care and social assistance | 16.0 |
| Educational services | 12.4 |
| Retail trade | 8.7 |
| Transportation and warehousing | 7.0 |
| Mining, quarrying, and oil and gas extraction |
5.7Note E: Use with caution |
| Construction | 4.2Note E: Use with caution |
| Real estate and rental and leasing | 3.9Note E: Use with caution |
| Arts, entertainment and recreation | 3.5Note E: Use with caution |
| Other services (except public administration) |
2.8Note E: Use with caution |
|
E use with caution Note: This chart only includes the top 10 industries, therefore the percentages will not add up to 100. Source: Statistics Canada, Aboriginal Peoples Survey, 2017. |
|
Variations were observed in industry by sex. For example, a slightly higher proportion of men were employed in the public administration sector than women (26% versus 20%). Other industries prevalent among Inuit men included transportation and warehousing (12%Note E: Use with caution), mining, quarrying, and oil and gas extraction (10%Note E: Use with caution), retail trade (9%Note E: Use with caution), construction (8%Note E: Use with caution), and arts, entertainment and recreation (5%Note E: Use with caution).
Among Inuit women, the most common employment sector was health care and social assistance (27%), significantly higher than their male counterparts (4%Note E: Use with caution). The second most prevalent sector was public administration (20%), followed by educational services which was also more common among women than men (19% versus 5%Note E: Use with caution).
Core working age Inuit living in Inuit Nunangat most likely to be employed in sales and service occupations
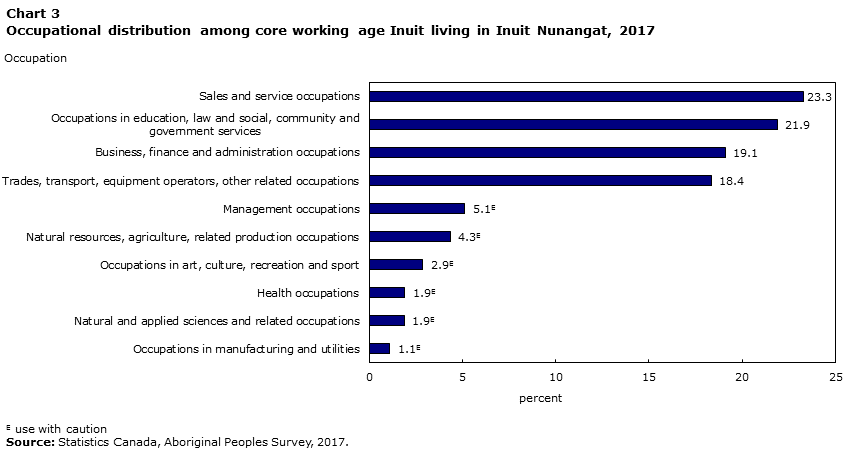
Sales and service occupations made up the largest share of occupations among core working age Inuit living in Inuit Nunangat (23%), followed by occupations in education, law and social, community and government services (22%), occupations in business, finance and administration (19%), as well as occupations in trades, transport, equipment and other related occupations (18%) (Chart 3).
Data table for Chart 3
| Occupation | Percent |
|---|---|
| Sales and service occupations | 23.3 |
| Occupations in education, law and social, community and government services | 21.9 |
| Business, finance and administration occupations | 19.1 |
| Trades, transport, equipment operators, other related occupations | 18.4 |
| Management occupations | 5.1Note E: Use with caution |
| Natural resources, agriculture, related production occupations | 4.3Note E: Use with caution |
| Occupations in art, culture, recreation and sport | 2.9Note E: Use with caution |
| Health occupations | 1.9Note E: Use with caution |
| Natural and applied sciences and related occupations | 1.9Note E: Use with caution |
| Occupations in manufacturing and utilities | 1.1Note E: Use with caution |
|
E use with caution Source: Statistics Canada, Aboriginal Peoples Survey, 2017. |
|
Those working in sales and service occupations had one of the lowest median incomes across the 10 occupations groups ($26,138) (Table 1). Comparatively, occupations in education, law and social, community and government social services had a higher median income ($55,539), as well as those in occupations in business, finance and administration ($69,695).
| Occupation | Median income |
|---|---|
| dollars | |
| Management occupations | 44,122 |
| Business, finance, and administration occupations | 69,695 |
| Natural and applied sciences and related occupations | Note F: too unreliable to be published |
| Health occupations | Note F: too unreliable to be published |
| Occupations in education, law and social, community and government services | 55,539 |
| Occupations in art, culture, recreation and sport | Note F: too unreliable to be published |
| Sales and service occupations | 26,138 |
| Trades, transport and equipment operators and related occupations | 35,896 |
| Natural resources, agriculture and related production occupations | 31,579 |
| Occupations in manufacturing and utilities | Note F: too unreliable to be published |
|
F too unreliable to be published Note: Employment income refers to all income received as wages, salaries and commission from paid employment and net self-employment income from farm or non-farm unincorporated business and/or professional practice during the reference period. Source: Statistics Canada, Aboriginal Peoples Survey, 2017. |
|
Regionally, sales and service occupations made up the largest share of employment in Nunavik (31%) and Inuvialuit region (29%), and were higher compared to Nunavut (20%) and Nunatsiavut (16%). At the same time, occupations in education, law and social, community and government services made up the largest share of employment in Nunatsiavut (24%) and Nunavut (22%), while the share was significantly lower in the Inuvialuit region (15%) than all other Inuit Nunangat regions. Finally, the share of occupations in trades and transport was higher in Nunavut (21%) than in the Inuvialuit region (17%), Nunavik (13%), and Nunatsiavut (11%Note E: Use with caution).
Inuit women were six times more likely than Inuit men to hold occupations in education, law and social, community and government services (36% versus 6%Note E: Use with caution), and were also more likely to work in business, finance and administration occupations (28% versus 9%Note E: Use with caution). Occupations in trades, transport, equipment and other related occupations was the most commonly reported occupation group among core working age Inuit men living in Inuit Nunangat (37%).
Land-based economy in Inuit Nunangat
This paper has thus far provided an overview of the wage economy by industry and occupation; however, many Inuit contribute to their families and communities through land-based activities. The term ‘livelihoods’ has been used in past research to refer to the many ways in which Inuit families generate income and support themselves; not only through wage employment but also through activities such as harvesting food, producing goods, artwork and handicrafts (Inuit Tapiriit Kanatami, 2018). In this case, it is necessary to move beyond exclusive concepts such as employment in order to fully understand the Inuit economy (Inuit Tapiriit Kanatami, 2018; Anderson and Thompson, 2016).
Existing research has shown that a number of factors are associated with participation in land-based activities, including sex, age, health, income, labour force status, family type, and remoteness (Kumar et al., 2019; Kumar and Janz, 2010). This section of the paper adds to the research by examining, in more detail, Inuit participation in land-based activities and factors associated with such participation to better reflect the complex work reality in communities where many Inuit live.
A number of questions were asked regarding land-based activities in the 2017 APS. These questions focused on whether respondents had participated in hunting, fishing and trapping; gathering wild plants; making clothing or footwear, as well as making carvings, drawings, jewelry and other kinds of artwork in the last year. Additionally, respondents were asked how often they engaged in such activities, and the reasons for participating (e.g., to supplement income, for own use or family’s use, or for cultural reasons).Note
In 2017, the majority (85%) of core working age Inuit living in Inuit Nunangat had participated in at least one of these land-based activities in the past 12 months. The results also show that 65% of core working age Inuit in Inuit Nunangat hunted, fished or trapped, while 48% gathered wild plants, 35% made clothing or footwear, and 15% made carvings, drawings, jewelry and other kinds of artwork.
Furthermore, findings from the APS also show that when Inuit engaged in these land-based activities, they did so often. For example, among those who gathered wild plants in the last year, more than half (52%) did so at least a few times per week while they were in season, and another 25% participated once a week. Among Inuit who hunted, fished or trapped, 46% did so at least a few times a week during the season with another 23% doing so once a week. Similar patterns were evident for the other land-based activities.
Land-based activity participation varies by Inuit region
Participation in land-based activities varied across the four Inuit Nunangat regions. For example, hunting, fishing or trapping was lowest in the Inuvialuit region (60%) compared with the other three regions (Table 2). At the same time, the prevalence for gathering wild plants among Inuit aged 25 to 54 was consistently higher in Nunatsiavut (68%) and Nunavik (71%) compared with Nunavut (38%) and the Inuvialuit region (48%).
Moreover, making clothing or footwear was highest in Nunavik and Nunavut (39% and 36%, respectively) than the other two Inuit regions. Finally, the prevalence for making carvings, drawings and other types of artwork ranged from 18% in Nunatsiavut and 16% in Nunavik to 15% in Nunavut and 13% in the Inuvialuit region.
Inuit men and women engage in different land-based activities
Overall, core working age Inuit women living in Inuit Nunangat were more likely to have participated in the land-based economy in the last 12 months than Inuit men (87% versus 82% engaged in at least one land-based activity).
When split by type of activity, core working age men were more likely to hunt, fish and trap than women overall (73% for men versus 58% for women) and across all Inuit regions. Conversely, women were more likely to gather wild plants and make clothing and footwear than men overall. Moreover, men were more likely than women to make carvings, draw and create other kinds of artwork in Nunavik (20% versus 13%Note E: Use with caution) and Nunavut (18% versus 12%Note E: Use with caution) than the other Inuit Nunangat regions (Table 2).
| Region | Hunting, fished or trapped | Gathered wild plants | Made clothing or footwear | Made carvings, drawings or other kinds of artwork |
|---|---|---|---|---|
| percent | ||||
| Inuit Nunangat | 65.3 | 48.3 | 34.9 | 15.4 |
| Women Table 2 Note † | 58.2 | 57.5 | 63.2 | 12.8 |
| Men | 73.1Note * | 38.6Note * | 4.5Note E: Use with caution Note * | 18.2Note * |
| Nunatsiavut | 73.0 | 68.3 | 17.5 | 17.9 |
| Women Table 2 Note † | 62.9 | 78.6 | 31.9 | 18.4 |
| Male | 82.7Note * | 58.5Note * | Note F: too unreliable to be published | 17.4 |
| Nunavik | 62.8 | 71.2 | 38.9 | 16.3 |
| Women Table 2 Note † | 56.4 | 84.5 | 69.9 | 12.6Note E: Use with caution |
| Men | 69.8Note * | 56.3Note * | Note F: too unreliable to be published | 20.4Note * |
| Inuvialuit region | 59.9 | 47.6 | 24.9 | 12.7 |
| Women Table 2 Note † | 50.9 | 49.8 | 45.1 | 14.6 |
| Men | 69.7Note * | 45.3 | Note F: too unreliable to be published | 10.6Note E: Use with caution |
| Nunavut | 66.3 | 38.1 | 36.1 | 15.2 |
| Women Table 2 Note † | 59.3 | 46.2 | 65.4 | 12.3Note E: Use with caution |
| Men | 73.7Note * | 29.5Note * | 4.9Note E: Use with caution Note * | 18.3Note * |
|
E use with caution F too unreliable to be published
|
||||
Household composition, education, and employment are key factors in land-based activity participation among core working age Inuit living in Inuit Nunangat
Core working age Inuit living in Inuit Nunangat with at least a high school education or higher were more likely to participate in at least one land-based activity than those with less than a high school diploma during the past year (Table A.1 in the Appendix). Furthermore, labour force status was linked to land-based activities as Inuit not in the labour force were less likely to participate than those who were employed (79% versus 88%). Still, the fact that almost eight-in-ten Inuit not in the labour force participated in at least one land-based activity in the past 12 months reinforces the need to look beyond conventional labour force status indicators.
Other socio-economic variables found to be related to land-based activity participation included personal income, however this was specific to the type of activity. For example, those with a personal income at or above the medianNote were more likely to participate in hunting, fishing, and trapping than those with an income below the median (71% versus 60%). This difference may be due to the fact that cost of equipment and gas required for these activities continues to increase (Fawcett et al., 2018) which may be a barrier to participation.
Household composition was also linked to participation in land-based activities. For example, female lone-parent households were less likely to participate in land-based activities than couples without children (75% versus 89%). Furthermore, in Nunatsiavut and the Inuvialuit region, Inuit living in larger households of three or more people were typically more likely to participate in land-based activities than smaller households.
Additionally, those with at least one person under the age of 18 living at home were more likely to participate in land-based activities than those with none (86% versus 80%). It is possible that these types of households rely more strongly on the land-based economy to provide for their younger and larger families.
Finally, those with a high sense of belonging to their Inuit group were more likely to participate in land-based activities than those who were neutral or reported low sense of belonging (87% versus 60%Note E: Use with caution), further solidifying the relationship between traditional activities and one’s Inuit identity and sense of community.
Just over a quarter of core working age Inuit living in Inuit Nunangat participate in land-based activities to supplement their income
There are many reasons why Inuit participate in land-based activities; including leisure, to share with family or the community, or for cultural reasons (see Table A.2 in Appendix for further information on reasons for participation). There are also financial reasons as many Inuit participated in these activities in order to supplement their income. Specifically, over a quarter (27%) of core working age Inuit in Inuit Nunangat who participated in at least one land-based activity in the past year did so for money or to supplement their income.
Men were more likely than women to participate in the land-based economy to supplement their income (29% compared to 25%). Regionally, those in Nunavik were the most likely to participate in land-based activities to supplement their income (35%), followed by those in Nunavut (26%), the Inuvialuit region (19%) and Nunatsiavut (17%). Additionally, those who were unemployed as well as those not in the labour force were more likely than employed Inuit to have participated in these activities for money.
Discussion and conclusion
For Inuit, the term ‘livelihood’ encompasses work in the wage economy and in the labour that connects them with the land, their culture and their community. The results from the 2017 APS presented in this paper highlight how important it is to include the land-based economy in any examination of the labour market. Furthermore, these findings suggest the need for policies and programs aimed at improving Inuit employment and related economic outcomes.
In 2017, about six-in-ten (61%) core working age Inuit living in Inuit Nunangat were employed. At the same time, the findings also highlight the fact that there is a significant proportion of Inuit that do not participate in the wage economy. Specifically, 30% of Inuit aged 25 to 54 living in Inuit Nunangat were not in the labour force. These proportions were highest in Nunatsiavut (33%) and Nunavut (31%), followed by 29% in the Inuvialuit region and 27% in Nunavik. Being a discouraged searcher, that is, those who believed no work was available, was the common reason for not looking for work. Further, Inuit men were significantly more likely than Inuit women to be discouraged searchers (42% versus 14%Note E: Use with caution).
This study also focused on industries and occupations to highlight the sectors that predominantly drive the Inuit Nunangat wage economy. In this case, public administration was the most prevalent industry, followed by health care and social assistance, educational services, and transportation and warehousing. In terms of occupations, those in sales and services make up the largest share of occupations among core working age Inuit living in Inuit Nunangat. This was followed by occupations in education, law, social, community and government services, and business, finance, and administration.
In addition, this paper examined the factors associated with participation in land-based activities among core working age Inuit. Conventional measures of labour force participation, in association with participation in land-based activities such as hunting, fishing, gathering wild plants or artwork, provide a more accurate picture of the complex work reality in these communities.
The results show that more than eight-in-ten (85%) Inuit aged 25 to 54 living in Inuit Nunangat participated in at least one of these land-based activities in the past year. There were, however, differences in participation by type of activity. Specifically, 65% of Inuit engaged in hunting, fishing or trapping, while 48% gathered wild plants. In addition, more than a third (35%) made clothing and footwear and 15% made carvings, drawings and other types of artwork. In addition, the results show that when Inuit engaged in these activities, about half did so at least a few times per week. Further, it is important to note that over a quarter (27%) of core working age Inuit living in Inuit Nunangat who participated in these activities, reported doing so for money or as a way to supplement their income.
Several characteristics are associated with participation in land-based activities. Inuit women, for example, are more likely to participate in the land-based economy than Inuit men, although the types of activities that men and women participate in differ. Another important factor is education, as those with at least a high school education were more likely to participate in land-based activities. In addition, Inuit who were not in the labour force were less likely to participate than those who were employed. However, when they do participate in these activities, they are more likely to do so for money or to supplement their income.
The results also show that household composition matters, especially for female lone-parent households as they are less likely to participate in the land-based economy. Larger households and those with at least one person under the age of 18, on the other hand, were more likely to participate in land-based activities. Furthermore, the results also show that a stronger connection to their Inuit group is important as those who reported a high sense of belonging were more likely to participate in land-based activities than those who were neutral or reported a low sense of belonging.
The results of this study highlight the fact that participation in both the wage- and land-based economies are important for Inuit living in Inuit Nunangat. However, there are barriers to participation in both. For example, in a number of Inuit communities, there are not enough jobs, and when opportunities are available, many Inuit do not have the required education or skills (Robertson, 2018). The 2017 APS asked respondents about barriers to employment and what would help them find work. Specifically, 83% of unemployed Inuit cited a “shortage of jobs” as a barrier while almost half (46%) of Inuit who worked part-time did so because full-time employment was not available. Furthermore, skills training, education, and “more jobs”, were cited as being most helpful in gaining employment. Among Inuit women, child care assistance was frequently cited as what would help them most in finding work (11%Note E: Use with caution of Inuit women who were unemployed and 19% for those not in the labour force).
Moreover, Inuit also face barriers to participation in land-based activities such as climate change, loss of traditional knowledge, lack of money for equipment and supplies, as well as changes in government policies regarding hunting and harvesting (Kumar et al., 2019). Land-based activities are vital to Inuit identity, culture, as well as nutrition and food security, which reinforces the need for further research on the informal land-based economy.
The results presented in this paper serve to emphasize the fact that understanding the labour market experiences of Inuit living in Inuit Nunangat is one part of the diverse Inuit economy. In this case, it is necessary to consider both the wage- and land-based economies, as the two are interconnected, in order for policymakers to develop long-term strategies.
Data sources and methods
Data sources
The data used are from the 2017 Aboriginal Peoples Survey (APS). The 2017 APS is a voluntary, national survey of First Nations people living off reserve, Métis and Inuit aged 15 or older. The objectives of the APS are to identify the needs of these Aboriginal groups and to inform policy and programs. The APS aims to provide current and relevant data for a variety of stakeholders, including Aboriginal organizations, communities, service providers, researchers, governments, and the general public.
The APS is a post-censal survey, designed to follow and complement the Census of Population. The 2017 APS represents the fifth cycle of the survey and follows the thematic approach that was first introduced in the 2012 APS. The focus for the 2017 APS is participation in the Canadian economy, transferable skills, practical training, and use of information technology. It collected data on part-time employment, self-employment, business assistance, job satisfaction, job seeking, and non-participation in the labour force and job skills. It also collected unique and detailed information on education, health, languages, society and community.
The 2017 APS was developed by Statistics Canada with funding provided by Indigenous Services Canada, Crown-Indigenous Relations and Northern Affairs Canada, Health Canada, and Employment and Social Development Canada.
While this paper analyzes the employment rates of the Inuit population from the 2017 APS, official employment, unemployment and participation rates are produced via the Labour Force Survey (LFS), which is conducted every month. For more information on the LFS, see: Labour Force Survey
The target population of the 2017 APS was composed of the Aboriginal identity population of Canada, 15 years of age or older as of January 15, 2017, living in private dwellings. It excluded people living on Indian reserves and settlements and in certain First Nations communities in Yukon and the Northwest Territories (NWT). The sample for the survey was derived from a sampling frame of individuals who answered "Yes" to one of the three Census questions defining the Aboriginal identity population (questions 18, 20 and 21) or those who reported Aboriginal ancestry to question 17. Although not part of the 2017 APS target population, some individuals with Aboriginal ancestry who did not report Aboriginal identity were still sampled, since past survey experience indicates that nearly one-third of these individuals will report an Aboriginal identity on the APS. Therefore, unlike the target population, the sampled population (or survey population) was composed of both the identity population and the Aboriginal ancestry-only population. Additional details of the survey are available at: Aboriginal Peoples Survey (APS) and in the Concepts and Methods Guide.
The 2017 APS was conducted from January through August, 2017. The overall response rate was 76%. Response rates were higher in Inuit Nunangat (85%).
Methods
The study population for this analysis were people who self-identified as Inuit, aged 25 to 54 years. It was possible to report both single and multiple responses to the Aboriginal identity question on the APS. The data presented here represent a combination of the single and multiple responses for Inuit.
Prevalence estimates presented in this article are based on descriptive analysis conducted using SAS-callable SUDAAN and STATA. Weighted estimates were calculated using methods that took into account the survey design of the APS. Missing values including “don’t know,” “not stated” and “refusal” were excluded from the denominator when calculating percentages. Statistically significant differences between two estimates were identified using hypothesis testing.
To ensure confidentiality of respondents, estimates based on small cell counts (10 or less) were suppressed as were estimates with unacceptable precision (coefficient of variation greater than 33.3%). Estimates with marginal precision (coefficient of variation between 16.6% and 33.3%) are presented with an “E” and should be used with caution. Median income was calculated with bootstrap weights, but it should be noted that the variance estimates are unstable. If the sample size for a median income was less than 30 an ‘F’ was placed in the table.
Appendix
| Nunatsiavut | Nunavik | Inuvialuit region | Nunavut | Inuit Nunangat | |
|---|---|---|---|---|---|
| percent | |||||
| Overall population aged 25 to 54 years | 92.7 | 87.7 | 78.8 | 83.3 | 84.6 |
| Sex | |||||
| Women Table A.1 Note † | 91.2 | 92.0 | 81.9 | 85.5 | 87.1 |
| Men | 94.1 | 82.9Note * | 75.3 | 81.0 | 81.8Note * |
| Education | |||||
| Less than secondary | 93.1 | 84.9 | 76.5 | 76.0Note * | 79.5Note * |
| Secondary Table A.1 Note † | 92.9 | 86.2 | 85.1 | 92.5 | 90.6 |
| Any post-secondary | 92.0 | 94.6 | 79.7 | 87.1 | 87.8 |
| Economic family structure | |||||
| Couples without children Table A.1 Note † | 90.9 | 95.1Note E: Use with caution | 74.1 | 89.8Note E: Use with caution | 88.9 |
| Couples with children | 94.5 | 90.2 | 84.3 | 85.8 | 87.1 |
| Male lone-parent | Note F: too unreliable to be published | Note F: too unreliable to be published | 87.0Note E: Use with caution | 71.6Note E: Use with caution | 72.7Note E: Use with caution |
| Female lone-parent | 88.0Note E: Use with caution | 84.5 | 65.6 | 70.1Note E: Use with caution | 75.3Note * |
| Other economic family | 85.8Note E: Use with caution | 80.3 | 89.4Note E: Use with caution | 78.4 | 79.7 |
| Household crowding | |||||
| One person or less per room Table A.1 Note † | 93.2 | 88.6Note E: Use with caution | 84.3 | 85.4Note E: Use with caution | 86.5 |
| More than one person per room | 100Note E: Use with caution | 88.6Note E: Use with caution | 67.3Note E: Use with caution | 92.2Note E: Use with caution | 90.2 |
| Household tenure | |||||
| Owner Table A.1 Note † | 93.0 | Note F: too unreliable to be published | 87.4Note E: Use with caution | Note F: too unreliable to be published | 76.1Note E: Use with caution |
| Renter | 100Note E: Use with caution | 88.0 | 78.0 | 93.7 | 90.9 |
| Employment status | |||||
| Employed Table A.1 Note † | 93.0 | 89.1 | 76.4 | 87.8 | 87.6 |
| Unemployed | 97.9Note * | 91.5Note E: Use with caution | 79.6 | 79.3Note E: Use with caution | 83.6 |
| Not in labour force | 89.6 | 83.7 | 82.9 | 76.1Note * | 79.1Note * |
| Sense of belonging to Inuit group | |||||
| High sense of belonging Table A.1 Note † | 92.7 | 88.9 | 80.9 | 86.2 | 86.8 |
| Neutral or low sense of belonging | 94.3 | 73.6Note E: Use with caution | 52.1Note E: Use with caution Note * | Note F: too unreliable to be published | 60.3Note E: Use with caution Note * |
| Employment income | |||||
| Below median income Table A.1 Note † | 93.7 | 85.4 | 79.4 | 81.9 | 83.2 |
| Above or equal to median income | 91.8 | 90.0 | 78.1 | 84.7 | 85.9 |
| Household composition | |||||
| 1 to 2 people Table A.1 Note † | 88.2 | 82.0 | 68.9 | 80.2 | 80.1 |
| 3 to 4 people | 95.4Note * | 85.9 | 79.2Note * | 85.8 | 85.9 |
| 5 people or more | 91.8 | 90.9 | 85.9Note * | 82.7 | 85.1 |
| Number of persons aged less than 18 in household | |||||
| At least one person Table A.1 Note † | 91.6 | 89.8 | 83.3 | 84.9 | 86.3 |
| None | 94.3 | 81.6Note * | 71.5Note * | 77.7 | 79.5Note * |
| Knowledge of Aboriginal language | |||||
| At least some Table A.1 Note † | 93.3 | 87.7 | 80.9 | 82.9 | 84.5 |
| None | 87.9 | Note ...: not applicable | 71.0Note * | Note F: too unreliable to be published | 84.4 |
|
... not applicable F too unreliable to be published E use with caution
Source: Statistics Canada, Aboriginal Peoples Survey, 2017. |
|||||
| Reason for participating | Nunatsiavut | Nunavik | Inuvialuit region | Nunavut | Inuit Nunangat |
|---|---|---|---|---|---|
| percent | |||||
| Pleasure or leisure | 46.7 | 72.2 | 60.9 | 69.5 | 68.2 |
| Money or supplement income | 16.9 | 34.9 | 19.3 | 26.2 | 27.3 |
| Own use or family's use | 98.6 | 97.1 | 95.0 | 93.3 | 94.7 |
| Share with community | 53.2 | 62.4 | 70.4 | 61.7 | 61.9 |
| Cultural reasons | 45.2 | 57.4 | 55.7 | 59.5 | 57.8 |
| Other reason | Note F: too unreliable to be published | 4.8Note E: Use with caution | 4.3Note E: Use with caution | 5.6Note E: Use with caution | 5.1 |
|
E use with caution F too unreliable to be published Source: Statistics Canada, Aboriginal Peoples Survey, 2017. |
|||||
References
Anderson, T., and A. Thompson. 2016. Assessing the social determinants of self-reported Inuit health in Inuit Nunangat. Statistics Canada Catalogue no. 89-653-X2016009. Ottawa: Statistics Canada
Bernier, A. 1997. The Dimensions of Wage Inequality among Aboriginal Peoples. Analytical Studies Branch Research Paper Series, no. 109. Statistics Canada Catalogue no.11F0019MPE. Ottawa: Statistics Canada.
Ciceri, C., and K. Scott. 2006. The Determinants of Employment among Aboriginal Peoples. Aboriginal Policy Research Consortium International (APRCi). 132.
Conference Board of Canada. 2002. 2002 Nunavut Economic Outlook: An Examination of the Nunavut Economy. Prepared for the Nunavut Economic Development Strategy. Ottawa: The Conference Board of Canada.
Fawcett, D., T. Pearce, R. Notaina, J. Ford, and P. Collings. 2018. “Inuit adaptability to changing environment conditions over an 11-year period in Ulukhaktok, Northwest Territories.” Polar Record 54 (2): 119-132.
Inuit Tapiriit Kanatami. 2018. Inuit Perspectives on a Canadian Poverty Reduction Strategy. Ottawa: Inuit Tapiriit Kanatami (ITK).
Inuit Tapiriit Kanatami and Aboriginal Affairs and Northern Development Canada. 2007. Inuit Social Trends Series: Employment, Industry and Occupations of Inuit in Canada, 1981-2000. Aboriginal Affairs and Northern Development Canada Catalogue no. R2-455/2007E-PDF. Ottawa: Minister of Public Works and Government Services Canada.
Kumar, M., C. Furgal, P. Hutchinson, W. Roseborough and S. Kootoo-Chiarello. 2019. Harvesting activities among First Nations people living off reserve, Métis and Inuit: Prevalence, time trends and associated factors – Findings from the Aboriginal Peoples Survey. Statistics Canada Catalogue no. 89-653-X2019001. Ottawa: Statistics Canada.
Kumar, M., and T. Janz. 2010. An exploration of cultural activities of Métis in Canada. Statistics Canada Catalogue no. 11-008-X. Ottawa: Statistics Canada.
Laidler, G., J. Ford, W. Gough, T, Ikummaq, A. Gagnon, S. Kowal, K. Qrunnut, and C. Irgnaut. 2009. “Travelling and hunting in a changing Artic: assessing Inuit vulnerability to sea ice change in Igloolik, Nunavut.” Climatic Change 94 (3-4): 363-397.
Morency, J., E. Caron-Malenfant, S. Coulombe, and S. Langlois. 2015. Projections of the Aboriginal Population and Households in Canada, 2011 to 2036. Statistics Canada Catalogue no. 91-552-X. Ottawa: Statistics Canada.
Moyser, M. 2017. Aboriginal People living off-reserve and the labour market: Estimates from the Labour Force Survey, 2007-2015. Statistics Canada Catalogue no. 71-588-X. Ottawa: Statistics Canada.
Palesch, N. 2016. Creating Opportunity in Inuit Nunangat: The Crisis in Inuit Education and Labour Market Outcomes. CSLS Research Reports 2016-12. Ottawa: Centre for the Study of Living Standards (CSLS).
Pauktuutit Inuit Women of Canada. 2016. Strategy to Engage Inuit Women in Economic Participation. Ottawa: Pauktuutit.
Pendakur, K. and R. Pendakur. 2011. “Aboriginal Income Disparity in Canada.” Canadian Public Policy 37 (1): 61-83.
Robertson, H. 2018. Labour market experiences of Inuit: Key findings from the 2017 Aboriginal Peoples Survey. Statistics Canada Catalogue no. 89-653-X2018004. Ottawa: Statistics Canada.
Thomas, J. 2016. Nunavik’s Labour Market and Educational Attainment Paradox. CSLS Research Report 2016-13. Ottawa: Centre for the Study of Living Standards (CSLS).
Clinton, G., and S. Vail. 2008. 2008 Nunavut Economic Outlook: Our Future to Choose. Nunavut Economic Forum.
Wilson, D., and D. MacDonald. 2010. The Income Gap between Aboriginal Peoples and the rest of Canada. Ottawa: Canadian Centre for Policy Alternatives.
- Date modified: