
Just the Facts
Ethnocultural diversity among lesbian, gay and bisexual people in Canada: An overview of educational and economic outcomes

Archived Content
Information identified as archived is provided for reference, research or recordkeeping purposes. It is not subject to the Government of Canada Web Standards and has not been altered or updated since it was archived. Please "contact us" to request a format other than those available.
Skip to text
Text begins
Disaggregated data provide insights on the outcomes of different groups of people and can be used to inform policy, programs and services toward a fairer and more inclusive society. Research shows that lesbian, gay and bisexual
To address gaps in disaggregated data on the LGB population, this article provides a portrait of ethnocultural and linguistic diversity among the LGB population in Canada. It is the fourth article of a series using data from combined cycles of the Canadian Community Health Survey (CCHS) from 2015 to 2018. Building on earlier thematic articles in the series, this study takes a closer look at the educational and economic outcomes of Canadian-born, immigrant and racialized LGB individuals to better understand inequities experienced by different segments of the population. In this study, data on respondents reporting an Indigenous identity are not included in the analysis, with the exception of the box on linguistic diversity.
The diversity of the lesbian, gay and bisexual population in Canada
According to data from the CCHS from the 2015-to-2018 period, 2.6% of racializedNote people aged 15 and older indicated that they were LGB, compared with 3.3% of the non-racialized population.Note The small sample size of the LGB population only allowed for a limited analysis of the largest racialized populations. It includes South Asian, Chinese, Black, Filipino and Latin American people, as well as those who selected two or more racial or cultural groups (i.e., multiple racialized groups). Only the groups with statistically significant proportions relative to the non-racialized population are reported below.
Among the population aged 15 years and older, a larger proportion (6.0%) of people who selected multiple racialized groups indicated they were LGB, compared with the non-racialized population (3.3%), while a slightly lower share of the Black population (2.1%E) reported being LGB.Note Specifically, a gay or lesbian sexual orientation was reported by 0.5%E of South Asian and 0.6%E of Black people, compared with 1.6% of the non-racialized population. A larger share of people who selected multiple racialized groups (3.4%E) indicated they were bisexual, compared with 1.8% of the non-racialized population, while a slightly smaller percentage of the Filipino population (0.7%E) reported being bisexual.
There was considerable overlap between the racialized and immigrant populations, with the majority (77.6%) of racialized people aged 15 and older also being immigrants to Canada. Among the population aged 15 and older, a smaller proportion (2.3%) of immigrants indicated that they were LGB, relative to their Canadian-born counterparts (3.4%).
Table 1 shows that the distribution of region or country of birth was similar among heterosexual and LGB immigrants—except for a higher proportion of LGB immigrants who were born in the United States, compared with their heterosexual counterparts (9.6%E versus 3.3%). It is possible that factors such as the level of acceptance of LGB people in a respondent’s region or country of birth may influence their willingness to disclose their sexual orientation.
| Region of birth | HeterosexualTable 1 Note † | Lesbian, gay or bisexual |
|---|---|---|
| percent | ||
| Asia | 45.8 | 43.5 |
| Europe | 27.7 | 25.1 |
| South, Central America and the Caribbean | 12.7 | 12.9Note E: Use with caution |
| United States | 3.3 | 9.6Note E: Use with cautionNote * |
| Africa | 9.4 | 6.6Note E: Use with caution |
| Other | 1.0 | Note F: too unreliable to be published |
|
E use with caution (coefficient of variation 15.0% to 35.0%) F too unreliable to be published
Source: Statistics Canada, 2015 to 2018 Canadian Community Health Survey. |
||
Among the population aged 25 to 64, LGB people—bisexual individuals in particular—were younger on average than the heterosexual population. Chart 1 shows the average age by sexual orientation among the Canadian-born, immigrant, racialized and non-racialized populations. Non-racialized immigrants tended to be older, while racialized people born in Canada were generally younger. However, the younger age profile of the LGB population was consistent across all groups.

Data table for Chart 1
| Immigrant status | Racialized population category | Heterosexual | Lesbian or gay | Bisexual |
|---|---|---|---|---|
| average age | ||||
| Canadian-born | Non-racialized | 45 | 44 | 39 |
| Racialized | 37 | 35 | 32 | |
| Immigrant | Non-racialized | 48 | 45 | 43 |
| Racialized | 43 | 38 | 40 | |
|
Note: Data on Indigenous respondents are not included in the analysis. Source: Statistics Canada, 2015 to 2018 Canadian Community Health Survey. |
||||
Canadian-born gay or lesbian people are more likely to hold a university degree than their heterosexual counterparts
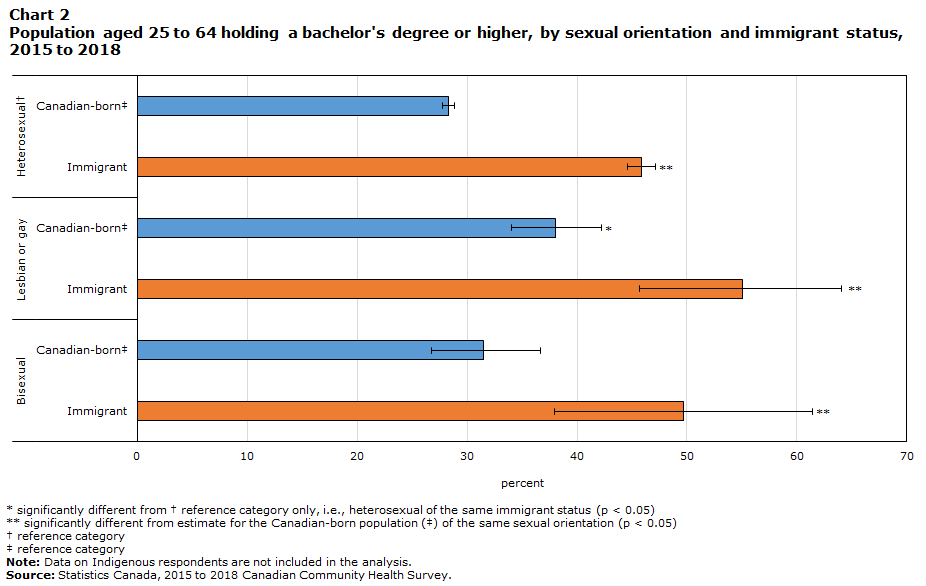
The second article in this series, Educational participation and attainment of lesbian, gay and bisexual people in Canada, found that 4 in 10 (41.2%) gay or lesbian people aged 25 to 64 held a university degree at the bachelor’s level or higher—a significantly greater share than among bisexual (34.2%) and heterosexual (32.6%) individuals. The present article further examines university completion rates (i.e., holding a bachelor’s degree or higher) by sexual orientation for the Canadian-born, immigrant, racialized and non-racialized populations.
Reflecting the pattern seen in the overall population, gay or lesbian people born in Canada were more likely to hold a bachelor’s degree or higher than their heterosexual counterparts (38.0% versus 28.3%, respectively). Almost one-third (31.5%) of Canadian-born bisexual people held a university degree, a difference not statistically significant when compared with people of other sexual orientations (Chart 2).
Data table for Chart 2
| Sexual orientation | Immigrant status | Percent | 95% confidence intervals | |
|---|---|---|---|---|
| lower | upper | |||
| percent | ||||
| HeterosexualTable 2 Note † | Canadian-bornTable 2 Note ‡ | 28.3 | 27.7 | 28.8 |
| Immigrant | 45.8Note ** | 44.6 | 47.1 | |
| Lesbian or gay | Canadian-bornTable 2 Note ‡ | 38.0Note * | 34.0 | 42.2 |
| Immigrant | 55.0Note ** | 45.6 | 64.1 | |
| Bisexual | Canadian-bornTable 2 Note ‡ | 31.5 | 26.8 | 36.7 |
| Immigrant | 49.6Note ** | 37.9 | 61.4 | |
Source: Statistics Canada, 2015 to 2018 Canadian Community Health Survey. |
||||
Among Canadian-born people, university completion rates also varied by gender and sexual orientation. A higher share of gay men (40.0%), lesbian or gayNote women (34.6%), and heterosexual women (31.5%) held a university degree than heterosexual men (25.0%). Other differences by gender and sexual orientation were not statistically significant.
The vast majority of racialized people born in Canada have at least one foreign-born parent (also called the “second generation”), rather than having all parents born in Canada (third generation). Among the general population, the high educational attainment of the second-generation has been well documented.Note
Racialized gay or lesbian people born in Canada had high university completion rates. Among the Canadian-born population aged 25 to 64, a larger proportion of racialized gay or lesbian people (64.3%E) held a university degree than non-racialized gay or lesbian individuals (37.1%).Note Racialized heterosexual people also had higher educational attainment than non-racialized heterosexual individuals (Table 2). Research on the general population suggests that education and labour market outcomes vary according to specific racialized groups (e.g., Chinese or Black) and gender; however, the sample size of the LGB population did not allow for further disaggregation of the racialized population in the present study.
In summary, among the Canadian-born population, gay or lesbian people were more likely to hold a university degree than their heterosexual counterparts. However, among the Canadian-born, a larger share of racialized heterosexual and gay or lesbian people held a university degree than non-racialized individuals of all sexual orientations (Table 2).
| Sexual orientation | Percent | 95% confidence intervals | |
|---|---|---|---|
| lower | upper | ||
| percent | |||
| Non-racializedTable 2 Note ‡ | |||
| HeterosexualTable 2 Note † | 27.3 | 26.7 | 27.8 |
| Lesbian or gay | 37.1Note * | 33.1 | 41.2 |
| Bisexual | 29.9 | 25.9 | 34.2 |
| Racialized | |||
| HeterosexualTable 2 Note † | 46.3Note ** | 43.4 | 49.2 |
| Lesbian or gay | 64.3Note E: Use with cautionNote ** | 43.2 | 80.9 |
| Bisexual | Note F: too unreliable to be published | Note F: too unreliable to be published | Note F: too unreliable to be published |
|
E use with caution (coefficient of variation 15.0% to 35.0%) F too unreliable to be published
Source: Statistics Canada, 2015 to 2018 Canadian Community Health Survey. |
|||
Regardless of sexual orientation, a larger share of immigrants hold a university degree than their Canadian-born counterparts
Canada’s immigrant selection criteria have prioritized education over the past three decades, resulting in a population of immigrants to Canada with high levels of educational attainment.Note Previous research on the general population indicates that immigrants are more highly educated than the Canadian-born.Note In the present study, this trend held true regardless of sexual orientation. More than half of gay or lesbian immigrants (55.0%) and nearly half of bisexual (49.6%) and heterosexual (45.8%) immigrants aged 25 to 64 had at least a bachelor’s degree—a higher percentage than that of Canadian-born people of the same sexual orientation (Chart 2).
Education outcomes also varied among racialized and non-racialized immigrants. Table 3 shows that non-racialized gay or lesbian immigrants were the most likely to hold a university degree (67.7%), followed by racialized heterosexual (47.3%) and non-racialized heterosexual (42.4%) immigrants. Other differences in educational attainment among immigrants were not statistically significant.
| Sexual orientation | Percent | 95% confidence intervals | |
|---|---|---|---|
| lower | upper | ||
| percent | |||
| Non-racializedTable 3 Note ‡ | |||
| HeterosexualTable 3 Note † | 42.4 | 40.5 | 44.4 |
| Lesbian or gay | 67.7Note * | 53.3 | 79.3 |
| Bisexual | 55.8Note E: Use with caution | 38.5 | 71.8 |
| Racialized | |||
| HeterosexualTable 3 Note † | 47.3Note ** | 45.7 | 48.8 |
| Lesbian or gay | 47.5 | 36.2 | 59.0 |
| Bisexual | 45.6Note E: Use with caution | 31.2 | 60.8 |
E use with caution (coefficient of variation 15.0% to 35.0%)
Source: Statistics Canada, 2015 to 2018 Canadian Community Health Survey. |
|||
Economic outcomes among the lesbian, gay and bisexual population
In line with previous research, the third article in the series, Labour and economic characteristics of lesbian, gay and bisexual people in Canada, found that employment income varied according to sexual orientation and gender, averaged over the 2015-to-2018 period. Among full-time workers aged 25 to 64, heterosexual men tended to earn higher median incomes than heterosexual women and LGB individuals, regardless of their age group and level of education. Bisexual people were younger on average than heterosexual individuals, yet even among the younger population (aged 25 to 34 years) with a university degree, bisexual men and bisexual women earned less than their heterosexual and gay or lesbian counterparts.
Using a similar methodology (see Note to readers), the next section examines differences in employment income among immigrants and Canadian-born people, with an intersectional analysis of racialized and non-racialized populations. Canadian-born and immigrant populations are analyzed separately, as labour market outcomes are affected by immigrant-specific characteristics such as foreign credential recognition, foreign work experience and knowledge of official languages. By contrast, individuals born in Canada primarily acquire experiences relevant to labour outcomes domestically. Immigration policy and selection criteria can also alter immigrants’ demographic characteristics, admission category, region of origin, geographic distribution in Canada and pre-admission Canadian work experience, which in turn have an impact on employment income.Note
While the available data did not allow for the disaggregation by immigration-related factors described above, it is important to consider that some LGB individuals immigrate as refugees or seek asylum because of the risk of harm they may face in their home countries. These individuals may have different experiences and outcomes than those who do not face such situations. In 69 countries around the world, consensual sexual relations between same-sex adults is still criminalized.Note At the same time, stigmatization of people perceived as non-heterosexual remains high in many countries where same-sex activity is not criminalized. The Immigration and Refugee Board of Canada has established guidelinesNote to provide a better understanding of the challenges that sexually and gender diverse people, as well as intersex people, may experience in presenting their asylum cases.
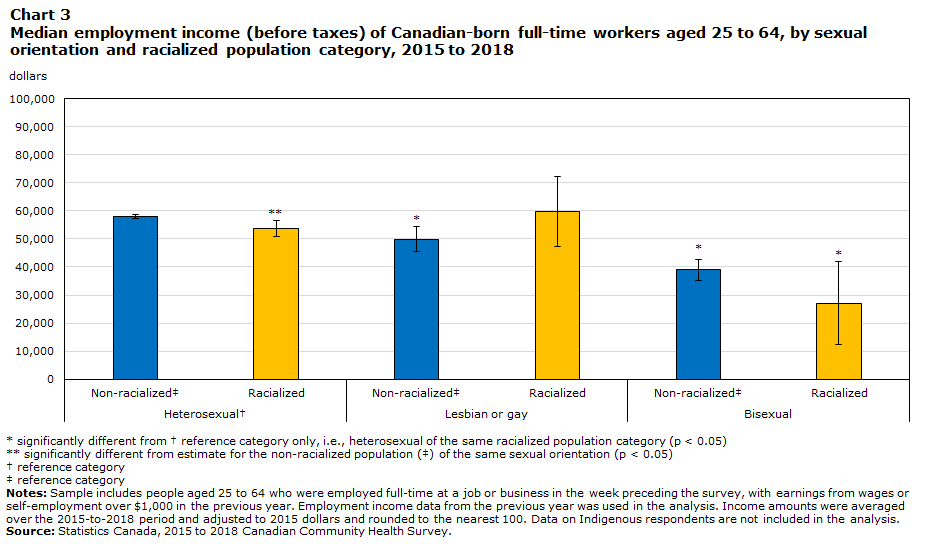
Canadian-born bisexual people—both racialized and non-racialized—have lower employment incomes than their heterosexual and gay or lesbian counterparts
According to CCHS data from 2015 to 2018, heterosexual people had the highest median annual employment income ($58,000) among Canadian-born full-time workers aged 25 to 64. Gay or lesbian individuals earned lower median incomes ($50,100) than their heterosexual counterparts, while bisexual people had the lowest earnings ($38,800) among the Canadian-born population.
Employment earnings also varied by gender among the population born in Canada. Heterosexual men earned the highest before-tax median income overall ($65,000), followed by gay men ($52,100) and heterosexual women ($49,400). Lesbian women earned less ($46,900) than heterosexual men, yet there were no statistically significant differences between lesbian women and other groups studied.
Economic outcomes were less favourable for Canadian-born bisexual men and women. Bisexual men had a lower median employment income ($38,100) than heterosexual and gay men, and bisexual women earned less ($39,100) than heterosexual women. Differences between Canadian-born bisexual men and women were not statistically significant.
The vast majority (95%) of the population of Canadian-born full-time workers aged 25 to 64 were non-racialized. Therefore, the earnings patterns among non-racialized people were very similar to those of the Canadian-born population overall. Chart 3 shows that non-racialized heterosexual individuals had the highest median annual employment income ($58,200). Non-racialized gay or lesbian people had lower median employment incomes ($49,900), while non-racialized bisexual people earned less ($39,100) than their heterosexual and gay or lesbian counterparts.
Annual employment earnings of racialized people born in Canada are also shown in Chart 3. Racialized bisexual individuals had the lowest median employment income overall ($27,100), while the difference in earnings between heterosexual and gay or lesbian people ($53,700 and $59,800, respectively) was not statistically significant.Note In other words, Canadian-born bisexual people—both racialized and non-racialized—had less favourable economic outcomes than their heterosexual and gay or lesbian counterparts. There was no statistically significant difference in earnings between racialized and non‑racialized bisexual people born in Canada.
Data table for Chart 3
| Sexual orientation | Racialized population category | Dollars | 95% confidence intervals | |
|---|---|---|---|---|
| lower | upper | |||
| dollars | ||||
| HeterosexualTable 3 Note † | Non-racializedTable 3 Note ‡ | 58,200 | 57,507 | 58,962 |
| Racialized | 53,700Note ** | 50,953 | 56,492 | |
| Lesbian or gay | Non-racializedTable 3 Note ‡ | 49,900Note * | 45,508 | 54,370 |
| Racialized | 59,800 | 47,305 | 72,358 | |
| Bisexual | Non-racializedTable 3 Note ‡ | 39,100Note * | 35,368 | 42,911 |
| Racialized | 27,100Note * | 12,194 | 41,910 | |
Source: Statistics Canada, 2015 to 2018 Canadian Community Health Survey. |
||||
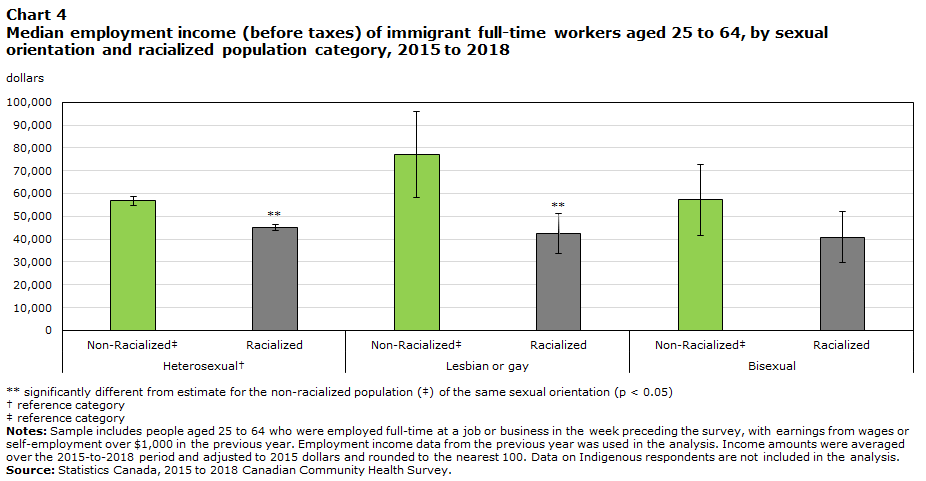
Non-racialized heterosexual and gay or lesbian immigrants have more favourable economic outcomes than racialized immigrants of all sexual orientations
While Canadian-born LGB individuals, particularly bisexual people, had lower median employment incomes relative to heterosexual people, a somewhat different pattern was seen among the immigrant population aged 25 to 64. The comparative advantage that Canadian-born heterosexual people had was not seen for heterosexual immigrants, who had similar earnings as LGB immigrants. Heterosexual immigrants had lower median earnings than Canadian-born heterosexual people ($48,300 versus $58,000), yet earned more than Canadian-born bisexual people ($38,800). There were no statistically significant differences in earnings across immigrants of different sexual orientations who worked full-time in the reference week.
Employment earnings varied by gender among the immigrant population, but only for heterosexual individuals. Heterosexual immigrant men had a higher median employment income than heterosexual immigrant women ($53,500 versus $43,000), yet other differences between men and women immigrants of different sexual orientations were not statistically significant.
When racialized immigrants aged 25 to 64 were compared by sexual orientation, there were no statistically significant differences in median employment incomes across sexual orientation groups. This relative parity partially reflects the generally lower annual median income of heterosexual ($45,000) and gay or lesbian ($42,400) racialized immigrants, which was similar to that of their bisexual counterparts ($40,700). For non-racialized immigrants, differences across sexual orientations were not statistically significant (Chart 4).
Disparities in employment income were only evident when comparing racialized and non-racialized immigrants. Chart 4 shows that non-racialized heterosexual and gay or lesbian immigrants had higher median incomes than racialized immigrants of all sexual orientations. Among bisexual immigrants, differences in employment income between racialized and non-racialized individuals were not statistically significant.
Data table for Chart 4
| Sexual orientation | Racialized population category | Dollars | 95% confidence intervals | |
|---|---|---|---|---|
| lower | upper | |||
| dollars | ||||
| HeterosexualTable 4 Note † | Non-RacializedTable 4 Note ‡ | 56,900 | 54,958 | 58,852 |
| Racialized | 45,000Note ** | 43,625 | 46,371 | |
| Lesbian or gay | Non-RacializedTable 4 Note ‡ | 77,200 | 58,312 | 96,115 |
| Racialized | 42,400Note ** | 33,642 | 51,072 | |
| Bisexual | Non-RacializedTable 4 Note ‡ | 57,300 | 41,750 | 72,816 |
| Racialized | 40,700 | 29,488 | 51,852 | |
Source: Statistics Canada, 2015 to 2018 Canadian Community Health Survey. |
||||
The younger age structure of the LGB population, bisexual people in particular, suggests that they may be in earlier stages of their careers, and this would be expected to be a contributing factor in the generally lower earnings seen among this population. However, a multivariate regression analysis confirmed that the earnings gaps among the groups studied remained after taking into account age and educational attainment.
Start of text boxA higher proportion of LGB individuals than heterosexual people spoke both of Canada’s official languages at home
According to CCHS data from 2015 to 2018, 9 in 10 (90.3%) people aged 15 and older spoke one of Canada’s two official languages at home, either alone or with other languages, regardless of sexual orientation. However, linguistic patterns varied among people of different sexual orientations.
While the majority (67.6%) of people in Canada spoke English or English and a non-official language at home, this was the case for a larger share of bisexual individuals than people of other sexual orientations. Nearly three-quarters (74.4%) of bisexual individuals spoke English or English and a non-official language most often at home, compared with over two-thirds (67.8%) of heterosexual people and 6 in 10 gay or lesbian individuals (61.3%) (Chart 5).
A greater proportion of the gay or lesbian population spoke French or French and a non-official language most often at home, relative to heterosexual and bisexual individuals. Over one-quarter (26.5%) of gay or lesbian people spoke French or French and a non-official language at home compared with one in five (20.0%) heterosexual people and one in six (16.1%) bisexual people.
When it came to English–French bilingualism at home, a somewhat larger proportion of gay or lesbian and bisexual individuals (6.3%E and 5.0%, respectively) than heterosexual people (3.0%) spoke both of Canada’s official languages (or both languages and a non-official language) most often at home.
Heterosexual individuals were more likely than LGB people to speak a non-official language (i.e., a language other than English or French) most often at home. Almost 1 in 10 (9.2%) heterosexual people spoke a non-official language most often at home, compared with a smaller share of the gay or lesbian (5.9%) and bisexual (4.5%E) population (Chart 5).

Data table for Chart 5
| Sexual orientation | Official languages spoken most often at home | Percent | 95% Confidence intervals | |
|---|---|---|---|---|
| lower | upper | |||
| percent | ||||
| Heterosexual | English / English and other | 67.8 | 67.4 | 68.1 |
| French / French and other | 20.0 | 19.8 | 20.2 | |
| English and French / English, French and other | 3.0 | 2.9 | 3.2 | |
| Non-official language | 9.2 | 8.8 | 9.5 | |
| Lesbian or gay | English / English and other | 61.3 | 58.0 | 64.4 |
| French / French and other | 26.5 | 23.9 | 29.3 | |
| English and French / English, French and other | 6.3Note E: Use with caution | 4.7 | 8.4 | |
| Non-official language | 5.9 | 4.5 | 7.8 | |
| Bisexual | English / English and other | 74.4 | 71.9 | 76.8 |
| French / French and other | 16.1 | 14.2 | 18.1 | |
| English and French / English, French and other | 5.0 | 3.9 | 6.5 | |
| Non-official language | 4.5Note E: Use with caution | 3.3 | 6.0 | |
|
E use with caution (coefficient of variation 15.0% to 35.0%) Source: Statistics Canada, 2015 to 2018 Canadian Community Health Survey. |
||||
Note to readers
The Canadian Community Health Survey (CCHS) covers the population aged 12 years and older living in all provinces and territories. Excluded from the sampling frame are individuals living in First Nations communities (on reserve), institutional residents (health institutions, prisons, religious institutions, convents, etc.), full-time members of the Canadian Forces, youth aged 12 to 17 living in foster homes and residents of certain remote regions. The CCHS covers approximately 98% of the Canadian population aged 12 and older. With a sample of 130,000 respondents every two years, it is a well-suited data source for research on smaller populations such as lesbian, gay and bisexual people living in Canada.
This article presents pooled data from the 2015-to-2016 and 2017-to-2018 CCHS cycles. The weights of the two two-year cycles were divided by two to represent the total average population over the four years.
This study examines sexual orientation data and does not report results specific to transgender and non-binary people. In 2019, the CCHS began collecting data on both self-reported sex at birth and gender identity, which are required to identify the transgender and non-binary population. Prior to 2019, the CCHS only collected information on the sex of respondents (male or female), as recorded by the interviewer. Although sex and gender refer to two different concepts, the terminology related to gender is used throughout this article to make it easier for readers.
The sexual orientation variable contained three response category options with the following definitions: heterosexual (sexual relations with people of the opposite sex); homosexual, that is lesbian or gay (sexual relations with people of your own sex); and bisexual (sexual relations with people of both sexes). In 2019 and subsequent cycles of the CCHS, the definitional text is omitted from these categories, and an additional write-in category is included for respondents to specify a sexual orientation. Data from the 2019 CCHS and subsequent years were not included because of this change in reporting methodology and impacts on comparability for sexual orientation data.
In this release, data on the “racialized population” are measured with the “visible minority” variable. The “non-racialized population” is measured with the category “not a visible minority” of the variable, excluding Indigenous respondents. The term “visible minority” refers to whether a person belongs to one of the visible minority groups defined by the Employment Equity Act. The Employment Equity Act defines visible minorities as “persons, other than Aboriginal peoples, who are non-Caucasian in race or non-white in colour.” The visible minority population consists mainly of the following groups: South Asian, Chinese, Black, Filipino, Latin American, Arab, Southeast Asian, West Asian, Korean and Japanese. In this article, further disaggregation of these groups was limited by the small sample size of the LGB population. Data on Indigenous respondents are not included in this study, with the exception of the box on linguistic diversity.
The term “immigrant” refers to a person who is or has been a landed immigrant or permanent resident. Such a person has been granted the right to live in Canada permanently by immigration authorities. Immigrants who have obtained Canadian citizenship by naturalization are included in this group.
The CCHS collected income data from the previous year from a combination of sources (tax records, respondent-provided data and imputed data) with slight changes to methodology over the 2015-to-2018 period. The sample used for the employment income section of this release includes respondents aged 25 to 64 whose main source of personal income in the previous year came from wages, salaries or self-employment with annual employment incomes over $1,000 in the previous year. The sample was restricted to respondents who worked full-time (i.e., 30 hours or more) in the week preceding the survey. Data on work volume (i.e., full-time and full-year work status) were not available for the year in which income data were collected. Income amounts were averaged over the 2015-to-2018 period and adjusted to 2015 dollars. Amounts presented were rounded to the nearest 100.
For additional information about CCHS data quality and methodology.
This study was funded by Women and Gender Equality Canada (WAGE).
- Date modified: