
Just the Facts
A portrait of the school-age population and measures of student achievement

Archived Content
Information identified as archived is provided for reference, research or recordkeeping purposes. It is not subject to the Government of Canada Web Standards and has not been altered or updated since it was archived. Please "contact us" to request a format other than those available.
The most recent Census data show that 11% of the school age population (5- to 24-year-olds) are immigrants; ranging from 1% in Nunavut to 14% in Manitoba. Western and central Canada posted the highest concentration of immigrants, with the top percentages in Manitoba (14%), Ontario (13%), Alberta (13%) and British Columbia (13%).
The percentage of the school age population belonging to a visible minority group was 27% in 2016, with this proportion being higher in Ontario (35%) and British Columbia (37%).
Across Canada, 4.5% of the school age population identified as First Nations, 2.2% identified as Métis and 0.3% identified as Inuk. The highest percentage of the school age population who identified as First Nations, Métis or Inuk was in Nunavut (95%), with the vast majority identifying as Inuk (94%).

Data table for Chart 1
| First Nations (North American Indian) | Métis | Inuk(Inuit) | |
|---|---|---|---|
| percent | |||
| Canada | 4 | 2 | 0 |
| Newfoundland and Labrador | 8 | 2 | 2 |
| Prince Edward Island | 2 | 1 | 0 |
| Nova Scotia | 5 | 3 | 0 |
| New Brunswick | 4 | 1 | 0 |
| Quebec | 2 | 1 | 0 |
| Ontario | 3 | 1 | 0 |
| Manitoba | 17 | 9 | 0 |
| Saskatchewan | 18 | 7 | 0 |
| Alberta | 5 | 4 | 0 |
| British Columbia | 6 | 3 | 0 |
| Yukon | 26 | 4 | 2 |
| Northwest Territories | 40 | 9 | 13 |
| Nunavut | 0 | 0 | 94 |
| Source: Statistics Canada, 2016 Census of Population; Table: 37-10-0098-05. | |||
Across all age groups, most of the school age population lived with their parents (87%) in 2016. Whether in a two-parent family or a lone-parent family, most parents were working full time. This was also true for the First Nations, Métis and Inuk school age population. Most children in this population were living with their parents (82%) and most parents were working full time.
Performance of the school age population
The most recent Programme for International Student Assessment (PISA) data (2015) showed that for 15-year-old students in Canada, science scores were most comparable between females and males (527 and 528). However, females outperformed males in reading (540 compared to 514) and males outperformed females in math (520 compared to 511).
Across all three assessments, the lowest score was in Saskatchewan in mathematics (484). The highest score was also observed for mathematics in Quebec with a score of 544. While the range of scores was wider in mathematics, in most of the provinces the mathematics scores observed were below the Canadian average. Only in Quebec (544) and British Columbia (522) the scores observed were higher than the Canadian average (516).
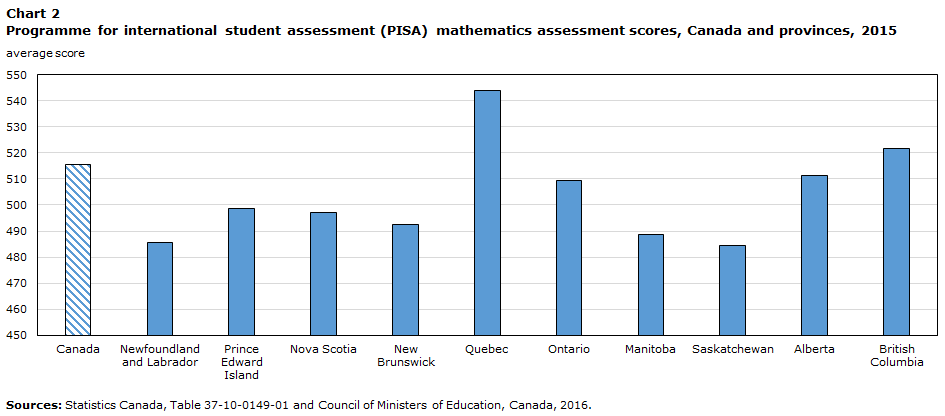
Data table for Chart 2
| Average score | |
|---|---|
| Canada | 516 |
| Newfoundland and Labrador | 486 |
| Prince Edward Island | 499 |
| Nova Scotia | 497 |
| New Brunswick | 493 |
| Quebec | 544 |
| Ontario | 509 |
| Manitoba | 489 |
| Saskatchewan | 484 |
| Alberta | 511 |
| British Columbia | 522 |
| Sources: Statistics Canada, Table 37-10-0149-01 and Council of Ministers of Education, Canada, 2016. | |
The most recent Pan-Canadian Assessment Program (PCAP) data showed scores in math, science and reading differed between the Anglophone and Francophone school systems. Math assessment scores were higher in Francophone school systems than was the case in Anglophone systems while the opposite was true for reading assessment scores.

Data table for Chart 3
| Total | Anglophone school system | Francophone school system | |
|---|---|---|---|
| average score | |||
| Math | 511 | 502 | 540 |
| Science | 508 | 508 | 506 |
| Reading | 507 | 509 | 500 |
| Source: Council of Ministers of Education, Canada (CMEC), Pan-Canadian Assessment Program, PCAP-2016: Report on the Assessment of Science, Reading, and Mathematics. | |||
- Date modified: