Criminal harassment in Canada, 2009
Archived Content
Information identified as archived is provided for reference, research or recordkeeping purposes. It is not subject to the Government of Canada Web Standards and has not been altered or updated since it was archived. Please "contact us" to request a format other than those available.
By Shelly Milligan
Criminal harassment increases over past decade
Lowest rate of criminal harassment in Manitoba
Highest rate of criminal harassment in Kingston
Female victims most often harassed by former intimate partners, male victims by acquaintances
Criminal harassment rarely involves weapons or injury to victims
Victims most often harassed at home
Probation most common sentence for criminal harassment
References
Criminal harassment, commonly referred to as stalking, refers to repeated conduct that is carried out over a period of time that causes victims to reasonably fear for their safety (Department of Justice, 2004). Examples of criminal harassment include repeatedly following or communicating with another person; repeatedly watching someone's house or workplace; or directly threatening another person or member of their family causing a person to fear for their safety or for the safety of someone known to them.1 While criminal harassment legislation was introduced in 1993 in response to violence against women, the law applies equally to all victims. The goal of the legislation is to identify and respond to criminal harassment before it escalates into serious physical harm to victims and to prohibit deliberate conduct that is psychologically harmful to others in causing them to fear for their safety (Department of Justice, 2004).
Using data from the Uniform Crime Reporting (UCR) Survey and the Adult Criminal Court Survey, this JuristatBulletin presents the most up-to-date information on police-reported incidents and court cases involving criminal harassment. Unless otherwise noted, data from the UCR Survey reflect all incidents of criminal harassment reported to police. It is important to note, however, that these data likely under-estimate the true extent of criminal harassment in Canada as not all incidents come to the attention of legal authorities. For example, self-reported data from 2009 indicate that about 3 in 10 Canadians (29%) who had been violently victimized in the previous year contacted police to report the incident (Perreault and Brennan, 2009).2
Criminal harassment increases over past decade
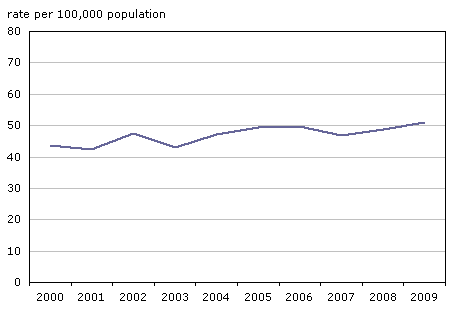
In 2009, Canadian police services reported just over 20,000 incidents of criminal harassment (Table 1), representing almost 5% of all violent crimes reported to police.3 Data from a sub-set of police services indicate that the rate of criminal harassment has been gradually increasing over the past decade (Chart 1).4 Reports of criminal harassment to police services increased by 7% from 2008 to 2009.
Chart 1
Criminal harassment, Canada, 2000 to 2009

Note: Rates are calculated on the basis of 100,000 population. Data are drawn from a sub-set of police services which, in 2009, represented 57% of the population of Canada. Data are not nationally representative. The 2009 data do not match the information presented elsewhere in this article due to differences in survey coverage.
Source: Statistics Canada, Canadian Centre for Justice Statistics, Incident-based Uniform Crime Reporting Survey, Trend Database.
Lowest rate of criminal harassment in Manitoba
In general, overall violent crime tends to be higher in western Canada than in the eastern part of the country;5 however, for criminal harassment, the opposite generally holds true. Among the provinces, the lowest rate in 2009 was in Manitoba (22 incidents per 100,000 population), the province with the second highest overall violent crime rate. In contrast, Prince Edward Island (82 incidents per 100,000 population) reported the highest rate of criminal harassment (Chart 2), yet was among those with the lowest overall violent crime rate.
Chart 2
Criminal harassment, by province and territory, 2009

Note: Rates are calculated on the basis of 100,000 population.
Source: Statistics Canada, Canadian Centre for Justice Statistics, Uniform Crime Reporting Survey.
Highest rate of criminal harassment in Kingston
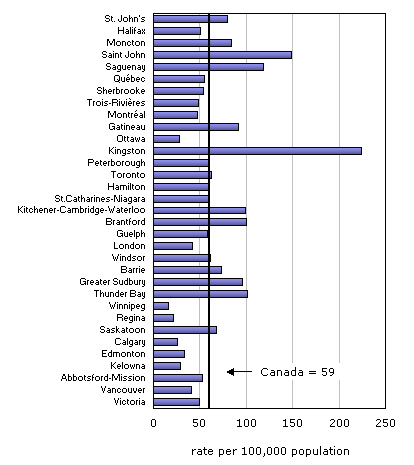
As at the provincial level, rates of criminal harassment tend to be higher among Canada's eastern census metropolitan areas (CMAs) than those in the western part of the country (Chart 3).6 In 2009, Kingston's rate (224) was the highest in the country and well above the rate reported in Saint John (149), the CMA with the next highest rate. In contrast, the lowest rates of criminal harassment were in western Canada, namely, Winnipeg (16), Regina (21) and Calgary (26) (Table 2).7
Chart 3
Criminal harassment, by census metropolitan area, 2009

Note: Rates are calculated on the basis of 100,000 population.
Source: Statistics Canada, Canadian Centre for Justice Statistics, Uniform Crime Reporting Survey.
Female victims most often harassed by former intimate partners, male victims by acquaintances
Typically, criminal harassment is a crime most often perpetrated against women. Females accounted for three-quarters of all victims (76%) of criminal harassment in 2009, compared to about half (51%) of victims of overall violent crime.
The relationship between victims and those accused of criminal harassment tends to differ depending on the sex of victims (Chart 4). In 2009, just under half (45%) of female victims were harassed by a former intimate partner while an additional 6% were harassed by a current intimate partner. Male victims, on the other hand, were more often harassed by a casual acquaintance (37%) than by a former (21%) or current (2%) intimate partner.
Chart 4
Criminal harassment, by relationship of accused to victim, Canada, 2009

1. Includes spouse (married or common-law), boyfriend, girlfriend and other intimate relationship.
2. Includes separated spouse (married or common-law), divorced spouse, ex-boyfriend or ex-girlfriend.
3. Includes non-spousal family members related by blood, marriage or adoption (e.g. parents, siblings, extended family members).
4. Includes acquaintances and authority figures.
Source: Statistics Canada, Canadian Centre for Justice Statistics, Incident-based Uniform Crime Reporting Survey.
Criminal harassment rarely involves weapons or injury to victims
As with most violent crime, weapons, such as firearms or knives, are rarely involved in incidents of criminal harassment. In 2009, threats (38%) or physical force (12%) were more commonly used against victims than weapons (3%). About half (48%) of all incidents involved neither weapons nor threats or physical force.
Given the relatively low proportion of incidents involving weapons or physical force, injuries to victims of criminal harassment are relatively rare. In 2009, about 2% of victims suffered physical injury, all of which was relatively minor.8
Nearly 3 in 10 (27%) incidents of criminal harassment involved other offences in 2009. Among these, uttering threats was the most common associated offence.9
Victims most often harassed at home
Most victims of criminal harassment (69%) were harassed in their own home or at another residence, such as a friend's home. Another 11% of incidents of criminal harassment took place in an outdoor public location, such as the street, road, highway or parking lot and 4% occurred at a school or university. The remaining 16% occurred in commercial or corporate areas, transit areas and other public/non profit institutions.
Probation most common sentence for criminal harassment
In 2008/2009, Canada's adult criminal courts completed about 3,200 cases of criminal harassment, accounting for just over 3% of total violent cases.10 Over half (52%) of all criminal harassment cases resulted in a finding of guilt, similar to the proportion for violent cases in general (54%). The remaining criminal harassment cases were acquitted (7%), stayed or withdrawn (37%) or resulted in another type of decision, such as not criminally responsible (4%).
Convictions for criminal harassment can result in more than one type of sanction. Probation was the most common sentence imposed for those found guilty of criminal harassment in 2008/2009 (63%).11 The median length of a probation sentence was 545 days, higher than the median length for violent cases in general, at 365 days.
Another one-quarter (26%) of guilty cases involving criminal harassment resulted in a sentence to custody. The median length of custody for criminal harassment cases was 31 days, lower than the median length of custody for violent cases in general (75 days).
References
AuCoin, Kathy. 2005. "Stalking-criminal harassment." Family Violence in Canada: A Statistical Profile, 2005. Kathy AuCoin (ed.). Statistics Canada Catalogue no. 85-224-XIE. www.statcan.gc.ca/pub/85-224-x/85-224-x2005000-eng.pdf (accessed January 6, 2011)
Dauvergne, Mia and John Turner. 2010. "Police-reported crime statistics in Canada, 2009." Juristat. Vol. 30, no. 2. Statistics Canada Catalogue no. 85-002-X.
www.statcan.gc.ca/pub/85-002-x/2010002/article/11292-eng.htm (accessed January 6, 2011)
Department of Justice Canada. 2004. A Handbook for Police and Crown Prosecutors on Criminal Harassment. Ottawa, Ontario.
www.justice.gc.ca/eng/pi/fv-vf/pub/har/index.html (accessed January 6, 2011)
Perreault, Samuel and Shannon Brennan. 2010. "Criminal victimization in Canada, 2009." Juristat. Vol. 30, no. 2. Statistics Canada Catalogue no. 85-002-X.
www.statcan.gc.ca/pub/85-002-x/2010002/article/11340-eng.htm (accessed January 6, 2011)
Notes
- See Canadian Criminal Code, R.S.C. 1985, Chap C-46, s.264(1).
- Information specific to victims of criminal harassment is available from the previous cycle of the General Social Survey on Victimization, conducted in 2004 but not repeated in 2009. These findings indicate that 37% of Canadians who had been the victim of criminal harassment in the previous year subsequently reported the incident to police (AuCoin, 2005).
- Unless otherwise noted, this article is based upon incidents in which criminal harassment is the most serious offence.
- Based upon data from a sub-set of police services which, in 2009, represented 57% of the population of Canada. Data are not nationally representative.
- For further information on crime trends in Canada, see Dauvergne and Turner, 2010.
- A census metropolitan area (CMA) consists of one or more neighbouring municipalities situated around an urban core. A CMA must have a total population of at least 100,000 of which 50,000 or more live in the urban core. To be included in the CMA, other adjacent municipalities must have a high degree of integration with the urban core, as measured by commuting flows derived from census data. A CMA typically comprises more than one police service.
- The incidence of criminal harassment in a given area can be influenced by many factors, including local police service policies and reporting practices.
- See AuCoin, 2005 for an exploration of the psychological impacts of stalking.
- Includes any offence involved in the incident. The Uniform Crime Reporting Survey captures up to four offences for each incident.
- Reflects data from the Adult Criminal Court Survey for the 2008/2009 fiscal year. Refers to completed cases in which criminal harassment was the most serious offence. One case can involve multiple charges. Total violent cases refers to those in which the most serious offence was identified as a crime against the person.
- Refers to the most serious sentence imposed in the case. Overall, 90% of guilty criminal harassment cases received a probation term.
- Date modified:
