
Police-reported mass casualty events in Canada, 2010 to 2024
by Laura Savage and Shana Conroy
Key findings
- Mass casualty events—intentional acts of violence where four or more victims sustained some level of physical injury or died as part of the same incident—accounted for a very small proportion (0.1%) of police-reported violent crime between 2010 and 2024. In all, there were 5,475 mass casualty events during this period.
- Nearly two-thirds (64%) of mass casualty events involved the presence of a weapon. This was much less common for violent crime in general (20%) where a victim record was provided by police.
- While men and boys accounted just under half (48%) of victims of violent crime reported by police between 2010 and 2024, they represented a larger proportion (62%) of the 26,634 victims in mass casualty events. Among the 256 victims in mass casualty events who died, the gender gap was smaller (54% men and boys, 46% women and girls).
- For half (50%) of victims involved in mass casualty events between 2010 and 2024, the accused person was a stranger. A further 13% of victims were family members of the accused, while 4.6% were intimate partners. Strangers were less common for victims of overall violent crime (25%), while family members (30%) and intimate partners were more common (27%).
- Between 2018 and 2024, 2.2% of mass casualty events involved (or were suspected by police to have involved) organized crime or street gang activity. This proportion was much higher than for violent crime overall (0.3%).
- Of the 7,402 persons accused in mass casualty events, nearly eight in ten (78%) were men and boys, which was similar for violent crime in general (77%). Among those accused in mass casualty events, the rate was highest for men aged 18 to 24 (7.8 accused persons per 100,000 population) and lowest for women aged 35 and older (0.2).
- Three-quarters (76%) of persons accused in mass casualty events between 2018 and 2024 had at least one prior contact with police as an accused since 2010. Notably, just over one-third (35%) of accused persons had ten or more prior contacts.
- Two-thirds (66%) of incidents of police-reported violent crime were cleared (i.e., solved) by police between 2010 and 2024, with nearly half (46%) cleared by the laying or recommendation of charges. Cleared incidents were more common for mass casualty events (77%) and most (69%) mass casualty events were cleared by charge.
Violence often has devastating impacts for victims, families and communities. Ramifications may include shock and grief, and damage to perceptions of personal and public safety. This is especially true of mass casualty events where multiple people are injured or killed by intentional acts of violence. These incidents often have a far-reaching impact that extends well beyond the immediate victims and may garner a great deal of public attention, including national awareness, concern and demand for action (Norris, 2007; Schildkraut, 2022). It should be noted, however, that even when multiple victims are physically injury or killed, incidents of violence may not gain widespread media coverage or recognition. The media may focus on the most heinous of incidents, which shapes public awareness and reaction.
In April 2020, the deadliest intentional act of violence in Canadian history occurred in Nova Scotia, with 22 victims killed (one of whom was expecting a child) and 3 others injured. Following the incident, the province of Nova Scotia and the Government of Canada both issued an Order in Council.Note From there, the Mass Casualty Commission was established, which aimed to learn about the context and root causes that led to the incident, and to make actionable recommendations to keep communities safer (Mass Casualty Commission, 2023). In March 2023, the Commission released its final report entitled, “Turning the tide together: Final report of the Mass Casualty Commission,” which included seven volumes: context and purpose, what happened, violence, community, policing, implementation (a shared responsibility to act) and process. In all, the Commission made 130 recommendations, the first of which centred on data collection, research and policy development.
For the first time, Statistics Canada is publishing detailed information about mass casualty events in Canada. This Juristat article presents an analysis of the nature and prevalence of mass casualty events using police-reported data from the Uniform Crime Reporting (UCR) Survey, including incident, victim and accused person characteristics. Throughout this article, information about overall violent crime reported by police—where a victim record was provided—is also provided for comparison.
This article was produced with funding support from Public Safety Canada.
Start of text box 1
Text box 1
Defining and measuring mass casualty events
The Mass Casualty Commission defined a mass casualty as “an intentional act of violence during which one or more perpetrator(s) physically injure(s) and/or kill(s) four or more victims, whether or not known to the perpetrator, during a discrete period of time” (Mass Casualty Commission, 2023). To align with this definition, this article focuses on incidents of police-reported violent crime where four or more victims sustained physical injury or died and, due to a required focus on intent, incidents of criminal negligence causing bodily harm or death are excluded.Note Further, in this article, incidents are grouped according to the level of physical injury sustained by victims, as reported by police.Note The following categories are used to analyze mass casualty events:
- Mass casualty events (total): includes level 1, level 2 and level 3 mass casualty events
- Level 1 mass casualty events: incidents with four or more victims that sustained minor physical injury
- Level 2 mass casualty events: incidents with four or more victims that sustained physical injury and one to three victims sustained major physical injury or died
- Level 3 mass casualty events: incidents with four or more victims that sustained major physical injury or died
The Uniform Crime Reporting (UCR) Survey captures all criminal incidents that come to the attention of police in Canada.Note Where victim records are provided, information about the level of physical injury sustained during violent incidents is captured and categorized as:
- Death: loss of life
- Major injury: physical injury that required professional medical attention at the scene or transportation to a medical facility
- Minor injury: physical injury that required no professional medical treatment or only some first aid (e.g., bandage, ice)
- No injury: no visible physical injury at the time of the incident
Details about the psychological impact of violence on victims are not captured by the UCR Survey. Still, it is important to acknowledge that psychological injury—such as post-traumatic stress disorder, anxiety and depression—often results from violence and may have long-term, and possibly lifelong, consequences for victims (Norris, 2007; Shultz et al., 2014; Wang et al., 2023). According to the 2025 Survey of Safety in Public and Private Spaces, 55% of victims of violence said the most serious incident they experienced in the 12 months preceding the survey resulted in some type of negative emotional impact.Note When it came to longer-term emotional impacts, victims most often stated that they tried hard not to think about the incident or went out of their way to avoid situations that reminded them of it (33%) and that they felt constantly on guard, watchful or easily startled (31%). One-quarter (24%) of victims of violent crime reported experiencing three or more long-term psychological impacts consistent with post-traumatic stress disorder.Note
End of text box 1
Mass casualty events where four or more victims sustained physical injury or died average 365 incidents each year
Between 2010 and 2024, the vast majority (90%) of incidents of police-reported violent crime involved a single victim, whereas a small proportion (10%) of incidents involved multiple victims, including those who were and were not physically injured (Chart 1).Note More specifically, 7.7% of incidents involved two victims, 1.3% involved three victims, 0.4% involved four victims, 0.2% involved five to nine victims and 0.01% involved ten or more victims.Note
Chart 1 start

Data table for Chart 1
| Number of victims | Total mass casualty events | Level 1 mass casualty events Data table for Chart 1 Note 1 | Level 2 mass casualty events Data table for Chart 1 Note 2 | Level 3 mass casualty events Data table for Chart 1 Note 3 | Violent crime Data table for Chart 1 Note 4 |
|---|---|---|---|---|---|
| percent | |||||
Source: Statistics Canada, Canadian Centre for Justice and Community Safety Statistics, Uniform Crime Reporting Survey (Trend Database). |
|||||
| 1 victim | ... not applicable | ... not applicable | ... not applicable | ... not applicable | 90.39 |
| 2 victims | ... not applicable | ... not applicable | ... not applicable | ... not applicable | 7.67 |
| 3 victims | ... not applicable | ... not applicable | ... not applicable | ... not applicable | 1.34 |
| 4 victims | 59.6 | 60.5 | 57.7 | 44.2 | 0.38 |
| 5 to 9 victims | 38.3 | 37.5 | 41.0 | 47.0 | 0.21 |
| 10 or more victims | 2.1 | 2.0 | 1.3 | 8.8 | 0.01 |
Chart 1 end
Mass casualty events—that is, violent incidents where four or more victims sustained some level of physical injury or died—accounted for a very small proportion of police-reported violent crime in Canada between 2010 and 2024.Note Of the nearly 5.2 million incidents of violent crime—where a victim record was provided by police—during this period, there were 5,475 mass casualty events where four or more victims sustained physical injury or died (0.1% of all incidents of violent crime) (Table 1). Of all mass casualty events, the large majority (84%) were level 1 events, and level 1 events accounted for 0.09% of all violent crime (see Text box 1 for definitions). Level 2 and level 3 mass casualty events were more rare: there were 686 level 2 events (0.01% of all violent crime) and there were 181 level 3 events (0.003% of all violent crime).Note
On average, there were 365 mass casualty events (307 level 1 events, 46 level 2 events and 12 level 3 events) per year between 2010 and 2024.Note Of the 5,475 mass casualty events during this period, six in ten (60%) involved four victims, while nearly four in ten (38%) involved five to nine victims and a small proportion (2.1%) involved ten or more victims (Chart 1). The proportion of mass casualty events with four victims decreased, and the proportions with five to nine victims increased, for level 2 and level 3 events. Level 3 mass casualty events had the largest proportion of incidents with ten or more victims (8.8% versus 2.0% of level 1 events and 1.3% of level 2 events). Both level 1 and level 2 mass casualty events involved an average of five victims per incident, while level 3 events involved an average of six victims.
Between 2010 and 2024, the average annual rate for mass casualty events was 1.0 incidents per 100,000 population, while the rates for level 1 (0.8), level 2 (0.1) and level 3 (0.03) events were progressively smaller (Table 1).Note Rates for mass casualty events between 2010 and 2024 were highest in the territories (4.4 incidents per 100,000 population), Saskatchewan (3.6) and Manitoba (3.4) (Table 2).Note
Rural areas—that is, those outside of census metropolitan areas and census agglomerations—often face unique challenges related to crime, including fewer emergency resources and limited police presence.Note This can be extended to mass casualty events which, while relatively rare, can have a disproportionate impact on rural areas, particularly for more geographically isolated communities with delayed emergency response times and less specialized emergency teams (Ceccato, 2016; Donnermeyer et al., 2016; Souhami, 2022). Further, mass casualty events can challenge a community’s sense of safety, especially in small communities where there is often a strong sense of interconnectedness (Mass Casualty Commission, 2023). Between 2010 and 2024, rural areas had a higher average annual rate for mass casualty events than urban areas (1.5 versus 0.9 incidents per 100,000 population), similar to violent crime. This held true for level 1 and level 2 events (1.3 versus 0.8 and 0.2 versus 0.1, respectively); however, the rate for level 3 events was lower in rural areas (0.026) than urban areas (0.033).
Much more common for mass casualty events to involve the presence of a weapon compared to violent crime overall
Nearly two-thirds (64%) of mass casualty events involved the presence of a weapon between 2010 and 2024, which was much more common than for violent crime overall (20%) (Chart 2; Table 3).Note As would be expected, larger proportions of mass casualty events involved the presence of a weapon where victims sustained major injury or died (78% of level 2 events and 98% of level 3 events).Note
Chart 2 start

Data table for Chart 2
| Most serious weapon present | Total mass casualty events | Level 1 mass casualty events Data table for Chart 2 Note 1 | Level 2 mass casualty events Data table for Chart 2 Note 2 | Level 3 mass casualty events Data table for Chart 2 Note 3 | Violent crime Data table for Chart 2 Note 4 |
|---|---|---|---|---|---|
| percent | |||||
Source: Statistics Canada, Canadian Centre for Justice and Community Safety Statistics, Uniform Crime Reporting Survey (Trend Database). |
|||||
| No weapon present Data table for Chart 2 Note 5 | 35.6 | 39.0 | 21.7 | 1.9 | 79.9 |
| Weapon present | 64.4 | 61.0 | 78.3 | 98.1 | 20.1 |
| Firearm Data table for Chart 2 Note 6 | 8.3 | 5.9 | 14.1 | 44.4 | 2.5 |
| Knife or other piercing, cutting instrument | 12.8 | 8.9 | 33.4 | 33.1 | 6.2 |
| Club, blunt instrument | 5.9 | 5.0 | 12.5 | 4.4 | 2.4 |
| Other weapon Data table for Chart 2 Note 7 | 37.4 | 41.2 | 18.3 | 16.3 | 9.0 |
Chart 2 end
Although firearm-related crime represents a small proportion (2.6%) of violent crime in Canada (Conroy, 2025; Perreault, 2026), the presence of a firearm was more common for mass casualty events. Of the level 3 events—that is, where four or more victims sustained major injury or died—that occurred between 2010 and 2024, more than four in ten (44%) involved the presence of a firearm. This compared to 14% of level 2 events, 5.9% of level 1 events and 8.3% of mass casualty events in general. Regardless of the level of mass casualty event, a handgun was the most common type of firearm present (of all incidents, 32% of level 3 events, 7.2% of level 2 events, 2.5% of level 1 events and 4.1% of mass casualty events in general).
In terms of geographic differences, the proportion of mass casualty events that involved the presence of a firearm was slightly higher in urban areas (8.4%) than rural areas (7.5%). The opposite emerged for level 1 events (5.7% in urban areas versus 6.4% in rural areas). The presence of a firearm was slightly more common in urban areas (14%) than rural areas (13%) for level 2 events, while it was much more common for level three events (48% in urban areas versus 19% in rural areas).Note
Mass casualty events most commonly involved level 2 assault (assault with a weapon or causing bodily harm; 48%), assault level 1Note (21%) and robbery (8.9%).Note The most common violations for violent crime overall were assault level 1 (45%), assault level 2 (15%) and uttering threats (12%).
Compared to overall violent crime, mass casualty events more often involve stranger violence, less often involve family violence or intimate partner violence
The UCR Survey captures the relationship of the accused person to the victim on each victim record. As such, the accused–victim relationship is typically presented as a victim count. However, given the unique nature of mass casualty events, which may include a variety of relationships in a single incident, this section considers the accused–victim relationship in terms of incidents.Note
Between 2010 and 2024, one-quarter (24%) of mass casualty events involved familyNote violence, meaning at least one victim in the incident was a family member of an accused person (Chart 3).Note Meanwhile, nearly one in five (18%) mass casualty events involved intimate partnerNote violence. Incidents of violent crime more commonly involved family violence and intimate partner violence (31% and 30%, respectively).Note
Chart 3 start

Data table for Chart 3
| Closest accused–victim relationship | Total mass casualty events | Level 1 mass casualty events Data table for Chart 3 Note 1 | Level 2 mass casualty events Data table for Chart 3 Note 2 | Level 3 mass casualty events Data table for Chart 3 Note 3 | Violent crime Data table for Chart 3 Note 4 |
|---|---|---|---|---|---|
| percent | |||||
Source: Statistics Canada, Canadian Centre for Justice and Community Safety Statistics, Uniform Crime Reporting Survey (Trend Database). |
|||||
| Family member Data table for Chart 3 Note 5 | 23.8 | 24.2 | 20.8 | 24.6 | 30.9 |
| Intimate partner Data table for Chart 3 Note 6 | 18.1 | 18.3 | 17.2 | 15.6 | 29.6 |
| Stranger | 34.8 | 34.7 | 35.0 | 36.3 | 23.9 |
Chart 3 end
Inversely, 62% of mass casualty events involved stranger violence, meaning that at least one victim did not know the accused person.Note More specifically, just over one-third (35%) of mass casualty events were stranger violence only—that is to say, the accused person was not known to any victims in the incident. Such violence was less common for violent crime (24%).
While 8.3% of mass casualty events had a firearm present, this was less common for such events involving family violence (5.2%) and intimate partner violence (6.3%).Note Meanwhile, one in ten (9.4%) mass casualty events that were stranger violence only had a firearm present. Further, a very small proportion (1.7%) of mass casualty events involved the death of a victim. More specifically, a victim died in 2.7% of mass casualty events involving family violence and 2.2% involving intimate partner violence, which compared to 1.0% of mass casualty events that were stranger violence only.
Most victims in mass casualty events are men and boys
Between 2010 and 2024, there were 26,634 victims involved in mass casualty events (Table 4).Note This represented an annual average of 1,776 victims. During this period, most (62%) victims in mass casualty events were men and boys, while the remaining victims were women and girls (38%).Note While six in ten (60%) victims of level 1 mass casualty events were men and boys, they accounted for larger proportions of victims of level 2 and level 3 events (71% and 65%, respectively). Meanwhile, men and boys accounted for 48% of victims of violent crime.
The average annual rate for mass casualty events was higher for men and boys (6.0 victims per 100,000 population) than women and girls (3.7). In contrast, the rate of violent crime was 1,105 victims per 100,000 population for women and girls, and 1,016 for men and boys.
For mass casualty events, rates were highest for victims aged 12 to 17 (12.6), followed by those aged 18 to 44 (8.1). The median age of victims in mass casualty events was lower than for victims of violent crime (24 years versus 30 years) (Chart 4).Note
Chart 4 start

Data table for Chart 4
| Gender | Total mass casualty events | Level 1 mass casualty events Data table for Chart 4 Note 1 | Level 2 mass casualty events Data table for Chart 4 Note 2 | Level 3 mass casualty events Data table for Chart 4 Note 3 | Violent crime Data table for Chart 4 Note 4 |
|---|---|---|---|---|---|
| median age | |||||
Source: Statistics Canada, Canadian Centre for Justice and Community Safety Statistics, Uniform Crime Reporting Survey (Trend Database). |
|||||
| Victims | |||||
| Men and boys | 24 | 23 | 25 | 29 | 31 |
| Women and girls | 23 | 23 | 26 | 30 | 29 |
| Total Data table for Chart 4 Note 5 | 24 | 23 | 25 | 30 | 30 |
| Accused persons | |||||
| Men and boys | 23 | 23 | 22 | 23 | 32 |
| Women and girls | 23 | 23 | 22 | 26 | 29 |
| Total Data table for Chart 4 Note 6 | 23 | 23 | 22 | 23 | 31 |
Chart 4 end
Half of victims in mass casualty events are strangers to the accused person
For half (50%) of victims involved in mass casualty events between 2010 and 2024, the accused person was a stranger (Table 5).Note This proportion rose for victims in level 2 (54%) and level 3 (58%) mass casualty events, and a larger proportion of accused were strangers when victims of mass casualty events were men and boys (56%) than women and girls (41%). Meanwhile, accused persons were strangers for one-quarter (25%) of victims of overall violent crime.
Accused persons were acquaintances for one in five (21%) victims of mass casualty events. These were followed by family membersNote (13%), authority figuresNote (5.7%) and intimate partnersNote (4.6%). A larger proportion of accused were family members or intimate partners when victims of mass casualty events were women and girls (19% and 9.5%, respectively) than men and boys (9.4% and 1.6%, respectively). Compared to victims of mass casualty events, larger proportions of victims of overall violent crime were victimized by a family member (30%) or an intimate partner (27%).
Nearly half of victims who died in mass casualty events are women and girls
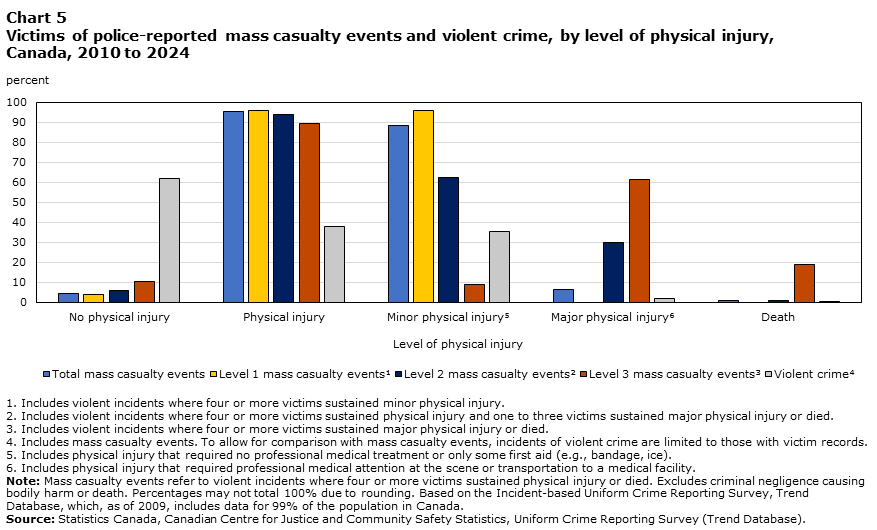
Nearly all (96%) victims involved in mass casualty events were physically injured between 2010 and 2024 (Chart 5).Note This proportion was slightly lower for victims involved in level 2 (94%) and level 3 (89%) mass casualty events. The large majority (88%) of victims in mass casualty events sustained minor injury,Note while major injuryNote (6.4%) and death (1.0%) were relatively rare.
Chart 5 start
Data table for Chart 5
| Level of physical injury | Total mass casualty events | Level 1 mass casualty events Data table for Chart 5 Note 1 | Level 2 mass casualty events Data table for Chart 5 Note 2 | Level 3 mass casualty events Data table for Chart 5 Note 3 | Violent crime Data table for Chart 5 Note 4 |
|---|---|---|---|---|---|
| percent | |||||
Source: Statistics Canada, Canadian Centre for Justice and Community Safety Statistics, Uniform Crime Reporting Survey (Trend Database). |
|||||
| No physical injury | 4.4 | 3.8 | 6.2 | 10.5 | 62.2 |
| Physical injury | 95.6 | 96.2 | 93.8 | 89.5 | 37.8 |
| Minor physical injury Data table for Chart 5 Note 5 | 88.3 | 96.2 | 62.6 | 8.8 | 35.5 |
| Major physical injury Data table for Chart 5 Note 6 | 6.4 | ... not applicable | 30.0 | 61.4 | 2.2 |
| Death | 1.0 | ... not applicable | 1.2 | 19.2 | 0.2 |
Chart 5 end
There were 256 victims who died in mass casualty events between 2010 and 2024. Women and girls accounted for 38% of victims of mass casualty events overall, but 46% of victims who died. In all, among victims of mass casualty events, 1.2% of women and girls died, and 0.8% of men and boys died. The median age of victims who died was comparable across genders (39 years among men and boys, and 38 years among women and girls).
Among victims of mass casualty events who died, the accused–victim relationship was most often a stranger (33%) or a family member (21%) for men and boys, and a family member (38%) or a stranger (30%) for women and girls.Note
Start of text box 2
Text box 2
Mass casualty events involving organized crime and street gang activity, and hate crime
The Uniform Crime Reporting (UCR) Survey, in alignment with the Criminal Code, defines a criminal organization as a group of three or more individuals who conspire in an ongoing collective or network—as one of its main purposes or activities—to profit from illicit activities. In contrast, a street gang is defined as a group of individuals who use intimidation and violence to commit criminal acts on a regular basis to obtain power and recognition, and control over specific areas of criminal activity. According to police-reported data, 2.2% of mass casualty events involved (or were suspected to have involved) organized crime or street gang activity between 2018 and 2024. This proportion was much higher than for violent crime overall (0.3%).Note
The UCR Survey also collects information about hate crime, which it defines as a criminal offence committed against a person or property that was motived in whole or in part by bias, prejudice or hate based on race, national or ethnic origin, language, colour, religion, sex, age, mental or physical disability, sexual orientation, gender identity or expression, or on any other similar factor. A very small proportion (0.7%) of mass casualty events between 2018 and 2024 involved (or were suspected to have involved) hate crime; however, it was higher for mass casualty events than violent crime overall (0.3%).Note
It is important to note that police data on organized crime and hate crime reflect only incidents that come to the attention of police and are classified as such. These counts may fluctuate significantly from year to year due to the challenges involved in determining whether an incident is related to organized crime or hate crime. Coding practices may vary depending on the specific details of an incident. Like other types of crime, counts may be impacted by the willingness of the public to report incidents to police, policing initiatives and awareness campaigns. As a result, the data presented in this text box should be interpreted with caution.
End of text box 2
Persons accused in mass casualty events are most often men aged 18 to 24
There were 7,402 persons accused in mass casualty events between 2010 and 2024 (Table 7).Note On average, there were 493 persons accused each year. Nearly eight in ten (78%) of those accused in mass casualty events were men and boys.Note This proportion was slightly lower for level 1 events (75%), but it rose for level 2 (87%) and level 3 (88%) events. In comparison, men and boys accounted for just over three-quarters (77%) of persons accused of violent crime during this period. Just over one-third (36%) of mass casualty events involved more than one accused. This was far less common for violent crime overall (7.0%).
Among persons accused in mass casualty events, the average annual rate was more than three times higher among men and boys than among women and girls (2.1 versus 0.6 accused persons per 100,000 population), similar to violent crime (1,064 versus 306). This difference remained for those accused in level 1 (1.6 among men and boys versus 0.5 among women and girls), level 2 (0.4 versus 0.1) and level 3 (0.1 versus 0.01) mass casualty events, though it was more pronounced for level 2 and level 3 events.
In all, of those accused in mass casualty events, rates were highest for those aged 18 to 24, similar to persons accused of violent crime. For mass casualty events, the highest rate was among men aged 18 to 24 (7.8 accused persons per 100,000 population) and the lowest for women aged 35 and older (0.2). Like victims, the median age of persons accused in mass casualty events was lower than for persons accused of violent crime (23 years versus 31 years) (Chart 4).Note
Start of text box 3
Text box 3
Prior contact with police among persons accused in mass casualty events
Recontact data provide valuable insight into the number, or volume, of criminal offences—that come to the attention of police—committed by the same person within a specific reference period and can reveal patterns of criminal behaviour, as well as a potential escalation of violence. One of the recommendations outlined in the Mass Casualty Commission’s final report, “Turning the tide together: Final report of the Mass Casualty Commission,” called for research and policy development aimed at collecting data on the criminal histories of individuals accused in mass casualty events. This text box uses police-reported data from the Uniform Crime Reporting (UCR) Survey to examine prior contact with police among persons accused in mass casualty events between 2018 and 2024.Note
A prior contact refers to any previous contact with police for a Criminal Code (including traffic) offence, violation under the Controlled Drugs and Substances Act or Cannabis Act, or other federal statute offence (e.g., Customs Act, Youth Criminal Justice Act) between 2010 and the date of the first mass casualty event.Note It is important to note that accused persons may have had additional contacts with police prior to 2010 or may have come into contact with police for other reasons (e.g., as a victim or witness of crime).
Three-quarters of persons accused in mass casualty events had at least one prior contact with police, large majority had prior contact for a violent offence
Of the 3,342 unique persons accused in mass casualty events between 2018 and 2024, three-quarters (76%) had at least one prior contact with police during the reference period (Chart 6; Table 8). Among those accused in mass casualty events, prior contact was higher for men and boys (78%) than women and girls (70%). In all, just over one-third (35%) of accused persons had ten or more prior contacts with police. Notably, these 1,182 accused persons accounted for 33,708 contacts with police during the reference period and had a median of 22 contacts. A small proportion (1.3%) of persons accused in mass casualty events between 2018 and 2024 were accused in more than one mass casualty event during the reference period.
Chart 6 start

Data table for Chart 6
| Number of prior contacts with police | Percent |
|---|---|
| Note: Mass casualty events refer to violent incidents where four or more victims sustained physical injury or died. Excludes criminal negligence causing bodily harm or death. Reflects unique persons accused in mass casualty events between 2018 and 2024 and the number of times they came into contact with police as an accused person for a criminal offence between January 1, 2010, and the date of the first mass casualty event. Accused persons may have had additional contacts with police before 2010, or may have come into contact with police for other reasons (e.g., as a victim or witness of crime). Percentages may not total 100% due to rounding.
Source: Statistics Canada, Canadian Centre for Justice and Community Safety Statistics, Criminal Profile Internal Record Linkage. |
|
| No prior contact | 23.5 |
| One prior contact | 10.4 |
| Two to four prior contacts | 16.9 |
| Five to nine prior contacts | 13.8 |
| Ten or more prior contacts | 35.4 |
Chart 6 end
Among persons accused in mass casualty events who had at least one prior contact with police, the large majority (85%) had at least one prior contact for a violent offence. The most common violations were assault level 1 (42%), assault level 2 (21%) and uttering threats (11%). Notably, charges were laid or recommended for two-thirds (67%) of these incidents, and nearly nine in ten (88%) accused persons had charges laid or recommended against them for at least one violent offence.
Most mass casualty events were more severe than the first prior contact with police
The Crime Severity Index (CSI) was developed as a complementary measure to the conventional crime rate and measures both the volume and relative severity of crime. Each crime is assigned a weight based on court sentencing outcomes over the previous five years, with higher weights being assigned to more serious crimes.Note The CSI can be used to measure the escalation of violence over time by comparing the weight assigned to the most recent offence with the weight assigned to a prior offence.Note In the context of mass casualty events, the weight assigned to the mass casualty event can be compared with an accused person’s prior contact with police (from January 1, 2010, to the date of the mass casualty event) to determine the relative severity. CSI values are based on the most serious violation in the incident. If a person was accused in more than one mass casualty event between 2018 and 2024, the event with the highest CSI weight was selected.
Compared to the first contactNote with police during the reference period, mass casualty events were more severe for 67% of accused persons, less severe for 23% of accused persons and the same severity for 9.4% of accused persons (Table 8). Notably, compared to the most serious prior police contact, mass casualty events were more severe for 34% of accused persons, less severe for 54% of accused persons and the same severity for 13% of accused persons.
End of text box 3
Private residences most common location for mass casualty events
In the UCR Survey, one location can be reported per incident. If an incident included multiple locations, the initial location is reported by police.
Mass casualty events between 2010 and 2024 most often occurred or began at residential locationsNote (46%), followed by open areasNote (30%) (Table 6).Note These two location types were also the most common for violent crime, although compared to mass casualty events, a larger proportion involved residential locations, while a smaller proportion involved open areas (58% and 21%, respectively).
During this period, there were 178 mass casualty events that occurred or began at schools,Note representing 3.3% of all such events. A slightly larger proportion of violent crime involved schools (3.6%).
Mass casualty events more often cleared, and cleared by charge, than incidents of violent crime overall
Just over three-quarters (77%) of all mass casualty events were cleared (i.e., solved) by police between 2010 and 2024, either by the laying or recommendation of charges, or cleared otherwise (Table 6).Note More specifically, 75% of level 1, 83% of level 2 and 82% of level 3 events were cleared. A relatively smaller proportion (66%) of violent crime was cleared by police. Higher clearance rates for mass casualty events, particularly for level 2 and level 3 events, may be partially attributable to the circumstances of these events, including increased visibility, more witnesses and the allocation of investigative resources. In addition, while most mass casualty events were cleared by charge (69% overall, and 67% of level 1, 80% of level 2 and 73% of level 3 events), 46% of violent crime was cleared in this way.
Mass casualty events that were cleared by police but did not result in the laying or recommendation of charges (7.7%) were most often cleared otherwise because victims requested that no further action be taken where an accused person was identified (47%) or due to departmental discretion (28%). A small proportion (4.0%) of mass casualty events were cleared otherwise because the accused died (including by suicide) prior to police laying or recommending charges. Notably, this reason accounted for 1.0% of level 1 events cleared otherwise, 4.2% of level 2 events cleared otherwise, and 80% of level 3 events cleared otherwise.
In all, 23% of mass casualty events—25% of level 1 events, 17% of level 2 events and 18% of level 3 events—were not cleared, meaning that they were still under investigation, there was insufficient evidence to proceed with criminal charges, or the victim or complainant declined to proceed (no accused person identified). This compared to 34% of incidents of violent crime.
Summary
Mass casualty events—that is, intentional acts of violence where four or more victims sustained some level of physical injury or died—accounted for a very small proportion of police-reported violent crime reported by police between 2010 and 2024. Of the nearly 5.2 million incidents of violent crime—where a victim record was provided by police—between 2010 and 2024, there were 5,475 mass casualty events where four or more victims sustained physical injury or died (0.1% of all violent crime), with an average annual rate of 1.0 incidents per 100,000 population. While these incidents are rare, they may have a profound impact on individuals and communities, and they are more likely to require a coordinated response from police, healthcare services and government.
One in five (20%) incidents of police-reported violent crime involved the presence of a weapon. As would be expected, this was much more common for mass casualty events (64%), especially where victims sustained major injury or died (78% of level 2 events and 98% of level 3 events).
Between 2010 and 2024, there were 26,634 victims involved in mass casualty events, most (62%) of whom were men and boys. Mass casualty events involved an average of five victims. The vast majority of victims in mass casualty events sustained minor injury (88%), while major injury (6.4%) and death (1.0%) were relatively rare. While women and girls accounted for 38% of victims of mass casualty events, this proportion rose to 46% where victims died.
For half (50%) of victims involved in mass casualty events between 2010 and 2024, the accused person was a stranger. A further 13% of victims were family members of the accused, while 4.6% were intimate partners. Strangers were less common for victims of overall violent crime (25%), while family members (30%) and intimate partners were more common (27%). Between 2018 and 2024, a small proportion (2.2%) of mass casualty events involved (or were suspected to have involved) organized crime or gang activity.
There were 7,402 persons accused in mass casualty events between 2010 and 2024. Nearly eight in ten (78%) of those accused in mass casualty events were men and boys. This proportion rose for level 2 (87%) and level 3 (88%) events. Just over one-third (36%) of mass casualty events involved more than one accused. Of those accused in mass casualty events between 2018 and 2024, three-quarters (76%) had at least one prior contact with police during the reference period and, in all, just over one-third (35%) of accused persons had ten or more prior contacts with police. A small proportion (1.3%) of accused persons who had a prior contact with police were accused in another mass casualty event during the reference period.
Two-thirds (66%) of incidents of police-reported violent crime were cleared (i.e., solved) by police between 2010 and 2024, with nearly half (46%) cleared by the laying or recommendation of charges. Cleared incidents were much more common for mass casualty events (77%) and most (69%) mass casualty events were cleared by charge.
Future analysis of mass casualty events could use court data to explore whether persons accused in mass casualty events were out on bail at the time of the incident, and homicide data to explore the primary apparent motive where victims of mass casualty events were killed. Further, linked data files could be used to explore characteristics of persons accused in such incidents, and their pathways through the criminal justice system. Such information could assist public safety authorities and health care providers in preventing and addressing mass casualty events in Canada.
Detailed data tables
Table 1 Police-reported mass casualty events and violent crime, by year, Canada, 2010 to 2024
Table 2 Police-reported mass casualty events and violent crime, by region, Canada, 2010 to 2024
Data sources and concepts
Uniform Crime Reporting Survey
The Uniform Crime Reporting (UCR) Survey was established in 1962 with the co-operation and assistance of the Canadian Association of Chiefs of Police. The UCR Survey is a compilation of police-reported crimes that have been reported to federal, provincial and municipal police services in Canada.
One incident can involve multiple offences. To ensure comparability, data presented in this article are based on the most serious violation in the incident. Police determine the most serious violation according to standardized classification rules in the UCR Survey that consider, for instance, whether the offence is violent as well as the maximum penalty imposed by the Criminal Code.
Incident-based Uniform Crime Reporting Survey, Trend Database
The Incident-based Uniform Crime Reporting (UCR2) Survey, Trend Database, is a microdata survey that captures detailed information on crimes reported to police, including the characteristics of incidents, victims and accused persons. UCR2 coverage between 2009 and 2024 is estimated at 99% of the population of Canada. UCR2 includes only the police services that have consistently responded to allow for comparisons over time.
To analyze mass casualty events, a dataset was created to capture all police-reported violent incidents (excluding criminal negligence causing bodily harm or death) from 2010 to 2024 where four or more victims sustained physical injury or died. Information about the level of physical injury is recorded for each victim and categorized as: death, major injury, minor injury, no injury and unknown injury. Victims whose level of injury was coded as unknown (0.7% of victims) were counted as uninjured. The number of victims in an incident includes those who sustained physical injury or died, those who did not sustain physical injury and those whose level of injury was coded as unknown. To be included in the mass casualty events file, all incidents must have had at least four victims that sustained physical injury or died. Some mass casualty events occurred over multiple days. After regrouping incidents considered one mass casualty event, dates were adjusted to reflect the earliest and latest incident dates. Only events that spanned three days or fewer were retained in the file.
A small proportion of police-reported incidents were determined to be part of the same mass casualty event based on multiple matching values (e.g., police service, incident date and time, violations) and were linked as one incident for analysis. Violent crime data include all incident file numbers, including mass casualty events which may have multiple incident file numbers. As such, a small proportion of mass casualty events may be counted more than once in violent crime data. Further, some mass casualty events included multiple values for weapon present, incident location and incident clearance status, and some victims of mass casualty events had multiple values for accused–victim relationship. For these variables, a ranking methodology was applied and a single value was selected for the affected variables in each mass casualty event or victim.
The UCR Survey requires police to provide a victim record for some types of violent crime, while it is optional for others. To allow for comparison with mass casualty events, incidents of violent crime are limited to those with victim records.
In Quebec, the information management system used by most police services produces a relatively high proportion of unknown values for the variable “most serious weapon present.” Although incidents of firearm-related crime are likely recorded correctly for the vast majority of cases, undercounting remains possible. Due to data quality concerns, weapon analysis excludes data from the province of Quebec unless the most serious weapon present was a firearm, and data from the Québec City Police Service are also excluded regardless of the most serious weapon present.
Data for the Saint John Police Service (SJPS) are also excluded. The Canadian Centre for Justice and Community Safety Statistics, in communication with the SJPS, decided to remove SJPS data from the 2016, 2017, 2018, 2019, 2023 and 2024 research files due to concerns with data quality in these years. As a result, SJPS data have also been removed from the trend file, which includes only those police services who have consistently reported data every year between 2009 and 2024.
References
Canadian Centre for Justice and Community Safety Statistics. (2025). Collection and reporting of Indigenous and racialized identity information through the Uniform Crime Reporting Survey: Operational guidelines for Canadian police services.
Ceccato, V. (2016). Rural crime and community safety. London: Routledge.
Conroy, S. (2025). Firearms and violent crime in Canada, 2023. Juristat. Statistics Canada Catalogue no. 85-002-X.
Donnermeyer, J., DeKeseredy, W. & Dragiewicz, M. (2016). “Policing rural Canada and the United States” in R. I. Mawby and R. Yarwood (eds.), Rural policing and policing the rural: A constable countryside? London: Routledge.
Mass Casualty Commission. (2023). Turning the tide together: Final report of the Mass Casualty Commission.
McCulloch, J. & Maher, J. (2022). Understanding the links between gender-based violence and mass casualty attacks: ‘Private’ violence and misogyny as public risk. Expert report prepared for the joint federal/provincial commission into the April 2020 Nova Scotia mass casualty.
Moreau, G. (2025). Understanding and using the police-reported Crime Severity Index. Juristat Bulletin—Quick Fact. Statistics Canada Catalogue no. 85-005-X.
Norris, F. H. (2007). Impact of mass shootings on survivors, families, and communities. PTSD Research Quarterly, 18(3).
Perreault, S. (2026). Firearms and violent crime in Canada, 2024. Juristat. Statistics Canada Catalogue no. 85-002-X.
Schildkraut, J. (2022). Supporting survivors and communities after mass shootings. Expert report prepared for the joint federal/provincial commission into the April 2020 Nova Scotia mass casualty.
Shultz, J., Thoresen, S., Flynn, B., Muschert, G., Shaw, J. Espinel, Z., Walter, F., Gaither, J., Garcia-Barcena, Y., O’Keefe, K. & Cohen, A. (2014). Multiple vantage points on the mental health effects of mass shootings. Current Psychiatry Reports, 16(469).
Souhami, A. (2022). A systematic review of the research on rural policing. Expert report prepared for the joint federal/provincial commission into the April 2020 Nova Scotia mass casualty.
Statistics Canada. (2025a). Hate crime in Canada, 2023. The Daily.
Statistics Canada. (2025b). Homicide trends in Canada, 2024. The Daily.
Statistics Canada. (2024). Understanding and using the Crime Severity Index.
Wang, S. K., Feng, M., Fang, Y., Lv, L., Sun, G. L., Yang, S. L., Guo, P., Cheng, S. F., Qian, M. C. & Chen, H. X. (2023). Psychological trauma, post-traumatic stress disorder and trauma-related depression: A mini-review. World Journal of Psychiatry, 13(6).
- Date modified: