
Women’s experiences of victimization in Canada’s remote communities
By Marta Burczycka, Canadian Centre for Justice and Community Safety Statistics
Highlights
- Rates of violence against women in remote areas of Canada are similar to those in accessible areas, according to self-reported data from the 2018 Survey of Safety in Public and Private Spaces. Remote areas, including very remote areas, are regions of Canada whose residents have greater difficulty in accessing key health, economic and social resources.
- About one in 15 (7%) women in remote areas indicated that they had experienced some type of physical or sexual violence in the previous year, including violence that occurred either within or outside of intimate relationships. This proportion was similar to those reported by women in accessible areas (6%).
- Equal proportions of women living in remote areas (12%) and in accessible areas (12%) experienced self-reported intimate partner violence (IPV) in the past year. However, having experienced it multiple times was more common for women in remote areas (95% of women who had experienced IPV) than it was for women in accessible areas (83%). More than four in ten (43%) women in remote areas who experienced IPV in the previous year said that they had experienced it on a daily, weekly or monthly basis.
- Violence against women in remote communities was more likely to have come to the attention of the police, compared to violence against women in accessible areas. More women in remote areas who had experienced violence by someone other than an intimate partner said that the most serious incident had been reported to police (43%, versus 12% among women in accessible areas), and the same was true for intimate partner violence (16% versus 6%). Further, women in remote areas were more likely than those in accessible areas to have contacted the police themselves.
- According to police-reported data from the 2019 Uniform Crime Reporting Survey, the rate of IPV against women in remote areas was over four times higher than the rate among women in accessible areas (2,002 versus 445 victims per 100,000). The rate of violence committed by someone other than an intimate partner was four times higher for women in remote areas (2,182 versus 574).
- According to self-reported data, sexual and/or physical abuse in childhood was as common for women in remote areas (27%) as it was for those in accessible areas (28%), and the frequency with women experienced these as children was also similar. While many instances of child abuse are never reported to the police, police-reported statistics show that physical assault against girls aged 15 and younger occurred in remote areas at a rate that was four times higher than in accessible areas (874 versus 223 victims per 100,000 girls). The rate of police-reported sexual assault and sexual violations was over three times higher for girls in remote areas (1,014 versus 322 victims per 100,000 in accessible areas).
- Self-reported data show that in both remote areas (84%) and accessible areas (86%), most women who experienced IPV did not reach out to victims’ services such as crisis lines, transition homes and other services. However, remoteness did not appear to be a key reason for not seeking help from victims’ services: across remote and accessible regions combined, less than one percent (0.8%) of women who experienced IPV and did not contact victims’ services said that they did not do so because the distance to reach services was too great.
- According to self-reported data from the 2019 General Social Survey on Canadians’ Safety (Victimization), more women in remote areas (41%) than accessible areas (21%) believed that crime in their community had increased during the previous five years. Additionally, women living in remote regions were less likely to have high confidence in the police (80%, versus 91% of women living in accessible areas) and the criminal courts (45% versus 60%).
- Seven in ten (72%) women in remote areas stated that their neighbourhood was characterized by signs of social disorder, such garbage lying around, loud parties or people openly using drugs―a considerably higher proportion than among women in accessible areas (58%). Despite this, most women (83%) in remote areas felt satisfied or very satisfied with their own safety from crime―also a higher proportion than among women in accessible communities (74%).
- Economic resiliency when faced with unexpected expenses can impact women’s lives in many ways. Slightly more women in remote areas (26%) than in accessible areas (21%) said that an unexpected expense of $500 or more would be difficult or impossible for their household to meet. Women in remote areas who had experienced IPV in the previous year were especially likely to report weak economic resiliency (48%), compared to women in accessible areas who had been victimized this way (24%).
Introduction
Many aspects of life in a geographically remote area of Canada differ greatly from life in an urban centre. Vast distances, often impassable at various times of year, separate residents from many goods and services that are more easily, and affordably, accessed elsewhere. For some, remoteness means tight-knit social bonds, which can provide support and stability at the same time as they can limit individuals’ feelings of autonomy (Annan 2008). Among other things, these aspects of remoteness are relevant to how women in remote communities experience gender-based violence. In Canada, the significance of remoteness as a potential correlate of violence against women has been noted, as remote communities are often characterized by geographic and social isolation, economic marginalization, and lower availability of both housing and victims’ services―all of which can contribute to women’s risk of gender-based violence (House of Commons 2019). Remote communities are also home to many First Nations, Métis and Inuit (Indigenous) women, who are overrepresented as victims of violence (Allen 2020; National Inquiry into Missing and Murdered Indigenous Women and Girls 2019).
The concept of remoteness is somewhat difficult to quantify. In 2017, Statistics Canada developed the Remoteness Index (RI), which allows for the classification of geographic areas based on the relative remoteness of the Census Subdivisions of which they are comprised (See Text box 1; Data sources). Relative remoteness is a concept based on an area’s residents’ ability to access health, social, economic and other resources, ranging from areas where they are easily accessible to areas where access is most difficult (very remote areas; Alasia et al. 2017). As the availability of these resources is central to an understanding of gender-based violence and society’s response to it, the RI is well positioned to add to an understanding of women’s experiences of violence in remote communities. Additionally, early applications of the Index have identified important social, demographic and economic realities that exist for women in these areas and which differentiate them from their counterparts in areas where resources are more accessible (Leclerc 2022; Leclerc 2021; Mardare Amini 2022).Note
To date, several studies using police-reported data have examined crime rates in rural areas of Canada, including the territories and northern regions of the provinces. These studies have consistently shown that compared to other parts of Canada, women in areas classified as rural and northern are over-represented as victims of police-reported violent crime (Allen 2020; Allen and Perreault 2015; Conroy 2021a; Perreault 2019; Rotenberg 2019). While related to remoteness, regional classifications based on north and south, and urban and rural, do not account for accessibility of services in the same way as the RI, which was developed specifically to measure accessibility (see Text box 1). The present study seeks to build upon these previous analyses through application of the Index, and provides a specific focus on violence against women in remote areas of Canada.
Many experiences of victimization are not reported to police. The under-reporting of certain types of violence, including sexual assault, has been well-established, and other forms of victimization―for example, psychological abuse or financial exploitation―are not always considered criminal in nature and thus, are absent from police-reported statistics. For this reason, the present study makes use of self-reported data in addition to police-reported statistics, to better understand the various ways in which women in remote areas experience victimization.
This Juristat article uses data from the 2018 Survey of Safety in Public and Private Spaces (SSPPS) to examine psychological, sexual and physical violence affecting women aged 15 and older in remote communities before the COVID-19 pandemic, with particular attention paid to the ways in which these women’s experiences differ from those of women residing in more accessible and urban areas of Canada. Self-reported data from the 2019 General Social Survey (GSS) on Canadians’ Safety (Victimization) will provide information on how women in remote areas perceive their communities and their safety. The article looks at the experiences of First Nations, Métis, and Inuit (Indigenous) women in these communities, and the experiences of diverse populations of women (e.g. LGBTQ2+ women) are explored wherever sample size allows.Note Police-reported data from the 2019 Uniform Crime Reporting Survey (UCR) will provide additional context for women’s experiences.
As noted, the present analysis uses data collected prior to the onset of the COVID-19 pandemic. While the most current self-reported victimization data predate the pandemic, certain correlates of violence―social isolation, substance use, availability of services, and others―measured by these surveys may have been exacerbated during the pandemic. Pre-pandemic self-reported data can therefore create a baseline understanding of gender-based violence in remote communities; this foundation can then be expanded with additional information on how COVID-19 impacted the known correlates of violence in these areas, as this information becomes available.
Start of text box 1
Text box 1
Measuring remoteness in Canada
Canada is a vast country, and its population is not evenly dispersed. Historically, the classifications “urban” and “rural” have been applied to Canadian communities, in an effort to understand how the experiences of their residents may differ from one another. These concepts are based on measurements of population density or commuting flows between communities (Statistics Canada 2016a; Statistics Canada 2016b). In everyday parlance and social science, familiar aspects of urban and rural areas―such as the concentration of businesses and homes of the former, versus the agricultural spaces and natural resource economies of the latter―are used to contextualize the experiences and opportunities of their residents.
While useful, urban and rural classifications capture a key way in which people’s place of residence can impact their lives―namely, the ease with which they are able to access services―in only a coincidental way. The methodologies used to determine urban and rural status do not explicitly and intentionally include measures of access to services such as healthcare, retail, and financial and legal services.
The development of Statistics Canada’s Remoteness Index (RI) sought to bridge this gap. Development involved the use of well-established information sources such as the Census of Population, together with data available from newer platforms such as Google Maps (Alasia et al. 2017). Starting with an area’s proximity to centres of economic activity and population agglomerations, key concepts related to accessibility were added. For instance, to find a true measure of accessibility of a service, the costs associated with travelling to it were considered. This is especially meaningful when one considers that some communities in Canada are only accessible by air, or by road on a seasonal basis. The resulting index assigns a numeric value to each census subdivision (CSD) in Canada, representing the relative remoteness of that CSD―and reflecting the relative ease with which residents of that CSD can access services. These remoteness values can then be grouped into five categories (easily accessible, accessible, less accessible, remote, very remote), representing a continuum which captures the accessibility of services in that type of area (Subedi et al. 2020).
The present report is based mostly on self-reported data from the 2018 Survey of Safety in Public and Private Spaces (SSPPS). Because the populations of remote areas of Canada are small, the sample of their residents who were surveyed by the SSPPS is small as well. For this reason, the smallest categories (remote and very remote) are combined, as are the categories accessible and easily accessible. Throughout this analysis, the term “remote” includes both remote areas, and the term “accessible” includes both accessible areas. Notably, other Canadian studies which used the RI found significant sociodemographic differences between women residents of very remote areas, when compared to those in remote areas and in more accessible areas (see Leclerc 2021; Mardare Amini 2022).
Between the categories “remote” and “accessible” is a middle category, “less accessible”. Information on the experiences of women in less accessible areas is presented in several tables, but not included in the body of the report: in keeping with the focus of the present article, the majority of data presented reflect the experiences of women in remote areas, with the experiences of women in accessible areas included for context.
Of note, while the RI represents a unique way of classifying geographies, analysis has shown that a degree of congruence exists between the RI and other geographical classifications used by Statistics Canada (Alasia et al. 2017). Among these are the designations urban and rural, which are based on a given area’s position relative to Census Metropolitan Ares and Census Agglomerations.Note Analyses based on urban and rural classifications are used in the present article where application of the RI was not possible.
End of text box 1
Prevalence and characteristics of violence against women in remote communities
Women in remote areas experience similar prevalence of violence as women in accessible communities
In 2019, remote areas across Canada were home to approximately 650,000 women aged 15 and olderNote ―about 4.4% of the overall population of women in Canada (Statistics Canada 2021a). Recent Canadian studies have revealed many ways in which the lives of women in these areas differ from the lives of women in accessible areas, with many reporting lower-than-average health, education and income (Leclerc 2022; Mardare Amini 2022). Analysis has also shown these areas to be home to a higher proportion of Indigenous women and fewer visible minority women, compared to accessible areas (Leclerc 2021). In spite of these differences, data from the SSPPS show that when it comes to being a victim of violence, the experiences of women in remote areas were mostly similar to those of women in accessible communities.
Overall, self-reported data show that violence against women was as common in remote areas as it was in accessible areas of Canada. About one in 15 (7%) women in remote areas indicated that they had experienced some type of physical (5%) or sexual (3%) violence in the previous year, including violence that occurred either within or outside of intimate relationships. These proportions mirrored those reported by women in accessible areas (4% respectively, differences not found to be statistically significant; Table 1).
Police-reported violence committed by a stranger less common in remote areas
According to self-reported data, 4% of women in remote areas experienced physical or sexual violence committed by someone other than an intimate partner in the previous year―the same proportion as among women in accessible areas. This included being physically attacked (2%), being threatened with being hit, attacked or threatened with a weapon (2%), and being sexually touched against their will (2%), by someone like a family member, acquaintance, co-worker, or other person (Table 2).
Aside from violence committed by intimate partners, the sample size of self-reported data collected from women in remote areas does not permit an analysis of who most often committed violence. Information reported by police services does provide this information. Data from the 2019 Uniform Crime Reporting Survey (UCR) show that in remote areas, a casual acquaintance was responsible for violence against 18% of women victims―making this the second most common relationship type involved in violence against women (after current spouses or common-law partners, 22%; Chart 1).Note
Chart 1 start
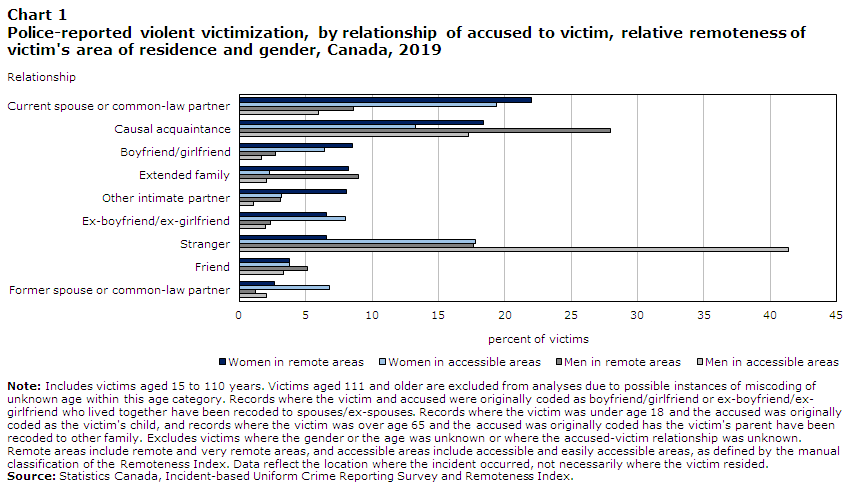
Data table for Chart 1
| Relationship | Women in remote areas | Men in remote areas | Women in accessible areas | Men in accessible areas |
|---|---|---|---|---|
| percent of victims | ||||
| Former spouse or common-law partner | 3 | 1 | 7 | 2 |
| Friend | 4 | 5 | 4 | 3 |
| Stranger | 7 | 18 | 18 | 41 |
| Ex-boyfriend/ex-girlfriend | 7 | 2 | 8 | 2 |
| Other intimate partner | 8 | 3 | 3 | 1 |
| Extended family | 8 | 9 | 2 | 2 |
| Boyfriend/girlfriend | 9 | 3 | 6 | 2 |
| Causal acquaintance | 18 | 28 | 13 | 17 |
| Current spouse or common-law partner | 22 | 9 | 19 | 6 |
|
Note: Includes victims aged 15 to 110 years. Victims aged 111 and older are excluded from analyses due to possible instances of miscoding of unknown age within this age category. Records where the victim and accused were originally coded as boyfriend/girlfriend or ex-boyfriend/ex-girlfriend who lived together have been recoded to spouses/ex-spouses. Records where the victim was under age 18 and the accused was originally coded as the victim's child, and records where the victim was over age 65 and the accused was originally coded has the victim's parent have been recoded to other family. Excludes victims where the gender or the age was unknown or where the accused-victim relationship was unknown. Remote areas include remote and very remote areas, and accessible areas include accessible and easily accessible areas, as defined by the manual classification of the Remoteness Index. Data reflect the location where the incident occurred, not necessarily where the victim resided. Source: Statistics Canada, Incident-based Uniform Crime Reporting Survey and Remoteness Index. |
||||
Chart 1 end
While this was similar to what police recorded in accessible areas, differences were noted with respect to other relationship types. For example, violence committed by a stranger was relatively common in accessible areas, with 18% of women victims having been victimized by someone they didn’t know (second only to current spouses or common-law partners, at 19%). In contrast, in remote areas, 7% of women victims had been victimized by a stranger. These patterns likely reflect the smaller communities present in remote areas, where many people know each other at least casually, and strangers are uncommon.
One in eight women in remote areas experienced physical, sexual or emotional violence by an intimate partner in the past year
Intimate partner violence (IPV) has been recognized as a key determinant of women’s health and wellbeing (World Health Organization 2021). Self-reported data from the SSPPS show that in Canada, physical or sexual violence committed by an intimate partner was as common for women in remote areas (4%) as it was for those in accessible areas in the previous year (3%, a difference not found to be statistically significant; Table 1). It should be noted, however, that women in remote communities may face particular challenges which can impact their experience of IPV, such as isolation and lack of housing (Annan 2008).
Women in remote communities experienced various forms of physical IPV in the year preceding the survey. These included being shaken, pushed, grabbed or thrown (2%), being threatened with being hit by a fist or something else that could hurt (2%), and having themselves or someone close to them be threatened with harm or death (2%; Table 2). Women also experienced sexual IPV, including being made to perform sex acts that they did not want to perform (1%) and experiencing forced sex or attempts at forced sex (1%). These forms of violence against women were as prevalent as they were in accessible areas.
In addition to physical and sexual violence, IPV can include psychological, emotional and financial abuse―for example, jealousy or controlling behaviour, insults, or preventing access to a job or financial resources.Note Just over one in ten women in both remote communities (11%) and in accessible areas (12%) experienced emotional, financial or psychological abuse committed by a current or former intimate partner in the previous 12 months (Table 2).
Emotional, psychological and financial abuse by an intimate partner can take many forms. Among women in remote areas, these included being put down or called names (8%), being told they were crazy, stupid or not good enough (7%), and having a partner who was jealous (5%) and who demanded to know where they were and who they were with at all times (5%; Table 2). There were no statistically significant differences between women in remote communities and those in accessible areas when it came to the prevalence of specific kinds of emotional, psychological or financial IPV.
When taken together, equal proportions of women living in remote areas (12%) and in accessible areas (12%) experienced some form of intimate partner violence, whether it was emotional, psychological or financial, or sexual or physical in nature. For the remainder of this analysis (and unless otherwise stated), these forms of intimate partner victimization will be considered together.
Experiences of violence as common for men as for women in remote areas
Overall, experiences of violence were as prevalent among men in remote communities as they were among women. For instance, there were no statistically significant differences between the proportion of men (10%) and women (12%) who had experienced intimate partner violence in the previous year; similarly, no statistical difference was detected between men (3%) and women (4%) when it came to violence by someone other than an intimate partner (Table 1).
Beneath these overall similarities, however, were differences in the types of violence men and women experienced. For example, men and women in remote areas were as likely to have experienced psychological, emotional or financial IPV (10% and 11%), but women were more likely to have experienced IPV that was physical or sexual in nature (4%, versus 1% of men). This was a contrast to what was noted in accessible communities, where physical and/or sexual IPV was equally as common among men (3%) as among women (3%).
While the prevalence of physical, sexual or emotional violence was similar for women in remote areas and those in accessible communities, a somewhat different pattern was noted among men. Fewer men living in remote areas experienced any type of physical or sexual violence (4%), compared to men in accessible areas (6%; Table 1). This reflected the fact that fewer men in remote areas (1%) than in accessible areas (3%) experienced physical or sexual IPV.
Over four in ten women in remote areas who experienced intimate partner violence in the past year said it happened daily, weekly or monthly
While the prevalence of violence against women was similar in remote areas and accessible ones, a notable difference was found when it came to the frequency of intimate partner violence. How frequently a woman experiences intimate partner violence is linked to her health and wellbeing, and is often used alongside indicators of the severity of violence (Messing and Thaller 2015).
In remote areas, most (95%) women who had experienced any IPV in the previous year said that it had happened multiple times (Table 3).Note More than four in ten (43%) experienced IPV on a daily, weekly or monthly basis, and just over half (52%) said that it had happened a few times in the past year. A considerably smaller proportion (5%) said that they had experienced one incident of IPV during that time.
Notably, multiple instances of IPV experienced in the previous year were less common for women in accessible areas. In the latter type of community, fewer women who had experienced IPV said that it had happened more than once in the previous year (83%), and a greater proportion said that they had experienced one incident during that time (17%).
Less frequent episodes of IPV―IPV that had happened “a few times” over the past year―were as common among women in remote areas (52%) and those in accessible ones (54%, a difference not found to be statistically significant).
Women in remote areas were also significantly more likely to experience multiple incidents of IPV in the previous year compared to men (95% versus 69%; data for men not shown). Instead, men who had been victimized were much more likely to have experienced IPV on one sole occasion (31%, compared to 5% among women).
Compared to accessible areas, women in remote areas who experienced intimate partner violence more likely to move out of a shared home after separation
Most women in remote areas who experienced IPV stayed with their partner. Among women living in remote areas who experience IPV in the year preceding the survey, a relatively small proportion separated from their partner (either temporarily or permanently) because of the violence (17%; Table 3). Notably, this proportion was the same among women in accessible areas (17%); however, women in remote areas who did leave an abusive partner were much more likely to move out of a home that they had shared. In remote areas, three-quarters (75%) of women who ended a relationship with an abusive partner with whom they had lived moved out―a considerably larger proportion than among women in accessible areas (41%), who more often stayed in shared accommodations following the end of the relationship.
That women in remote areas who experienced IPV more often moved out of a home shared with an abusive partner may seem to contradict reports of the lack of available housing in the Canadian North and other rural and remote areas (for example, see Schiff et al. 2015). A lack of housing has elsewhere been identified as a barrier to women in remote communities being able to escape violence (Maxwell 2020; Moffitt et al. 2013). In fact, data from the SSPPS do not contradict this. Instead, they show that in most cases, women in remote areas who moved out of a home they shared with their abuser went to stay with family or friends (88%; data not shown), instead of to a new place of their own.Note Among women in accessible areas who moved out as a result of violence, a similar proportion also went to stay with family and friends (77%, a difference not found to be statistically significant).
In line with this, SSPPS data show that many women in remote areas who had experienced IPV in the past year said that they reached out to family (44%) or friends (41%) to talk about what happened, positioning these relationships as key in women’s support networks (data not shown). This pattern was similar in accessible areas.
Data from the 2019 General Social Survey (GSS) on Canadians’ Safety (Victimization) provide additional insights into women’s social support networks in different types of communities. When asked about how many people they have in their lives to whom they feel close, there were no statistically significant differences between women in remote areas and those in accessible communities. In both cases, about three in ten women in remote areas (31%) and in accessible areas (31%) reported ten or more people with whom they had this type of relationship; about half (49% and 52%, respectively) reported between three and nine such people (Table 4). Other women stated that they had one or two such people in their lives (16% and 14%) or that they had no-one in their life to whom they felt close (3% and 2%). Of note, GSS data do not provide details on whether the people with whom women felt close lived in, or outside of, their communities.
These findings show that in both remote areas and accessible communities, women reach out to family and friends for support and in some cases, shelter. In this sense, the question of why women in remote areas are much more likely to move out of a home shared with a violent partner remains unanswered.
Use of shelters and other services similar among women in remote areas and accessible areas
While many women in remote communities who experienced IPV often turned to family and friends for support, others sought help with formal victims’ services agencies. In Canada, a multitude of victims’ services exist to provide safety and resources to women and others at risk of abuse, including crisis lines, transition homes, and sexual assault centres (Allen 2014). For women and others who find themselves in abusive situations, these services can provide a much-needed pathway to safety. However, women who live in remote communities may face special challenges in accessing services for victims of abuse, due to their geographic isolation and related factors (House of Commons 2019).
While the sample size of the SSPPS was too small to show how many women in remote areas contacted or used specific kinds of services, overall 15% of women in remote areas who had experienced IPV in the previous year did reach out to some sort of service for help (data not shown). This proportion was similar to that among women in accessible areas (12%). Notably, included in these proportions are women who actually made use of a victims’ service, as well as those who contacted a service but did not receive assistance. It is possible that some women in remote areas may have contacted a victims’ service, only to find out that (for example) assistance was not possible due to the geographic distances involved. In remote areas, most (84%) women did not reach out to victims’ services for help; this proportion was similar to that among women in accessible areas (86%, a difference not found to be statistically significant).
For women, remoteness did not appear to be a key reason for not seeking help from victims’ services. Regardless of where women lived, relatively few cited a lack of accessibility of services in their area as a reason for not seeking help. For instance, across Canada,Note less than one percent (0.8%) of women who experienced IPV and did not contact victims’ services said that they did not do so because the distance to reach services was too great; similarly, 0.6% said that there were no services available, and 0.6% said that a wait list for services prevented access (data not shown). Additionally, findings from the 2018 Survey of Residential Facilities for Victims of Abuse (SRFVA) found that fewer available beds were occupied in shelters in rural areas, compared to those in urban areas across Canada (Moreau 2019).
Instead of a lack of accessibility, women in remote communities often said that they did not seek help from victims’ services because they did not want or need help (50%) or because they considered the incident to be too minor (38%; Chart 2). These proportions were similar to those reported by women in accessible areas, and are consistent with other Canada-level studies (Burczycka 2016).
Chart 2 start

Data table for Chart 2
| Reason for not accessing services | Remote areas | Accessible areas | ||||
|---|---|---|---|---|---|---|
| percent of women who did not access services | 95% confidence interval | percent of women who did not access services | 95% confidence interval | |||
| from | to | from | to | |||
| Didn't know services existed | 2 | 1 | 5 | 3 | 2 | 4 |
| Didn't want relationship to end | 5 | 2 | 12 | 8 | 6 | 12 |
| Shame or embarrassment | 8 | 2 | 23 | 10 | 7 | 13 |
| Incident too minor | 38 | 24 | 54 | 39 | 35 | 44 |
| Didn't want or need help | 50 | 35 | 66 | 52 | 47 | 56 |
|
Note: Differences were not found to be statistically significant. Intimate partner violence includes violence committed by a current or former legally married spouse, common-law partner, boyfriend or girlfriend. Percent calculations based on women aged 15 and older in a current intimate relationship or who had contact with a former partner in the 12 months preceding the survey. Remote areas include remote and very remote areas, and accessible areas include accessible and very accessible areas, as defined by the manual classification approach to the Remoteness Index. Source: Statistics Canada, Survey of Safety in Public and Private Spaces and Remoteness Index. |
||||||
Chart 2 end
Data from the GSS provide further insight into the availability of victims’ services in remote areas of Canada―at least, into how this availability is perceived by residents of these areas. In general, relatively large proportions of women in remote communities reported that the services being asked about were indeed available in their areas; for example, 85% said they knew of social workers, psychologists and counselling services available in their area, and 69% said that they knew transition homes were available (Table 4).
For some services, the proportions of women who knew of their availability in their areas was similar among remote areas and accessible areas. This was the case for victim or witness assistance services, for example: 40% of women in remote areas and 37% of women in accessible areas knew that these were available in their area. For many other services, however, women in remote areas more often said that to their knowledge, services were not available in their areas, compared to women in accessible communities. For example, more than three times as many women in remote areas said that they knew there was no sexual assault centre in the area (33%, compared to 9% of women in accessible areas).
Women in remote areas more likely than those in accessible areas to report violence to the police
Amidst the many similar ways in which women in remote areas and those in accessible communities experience violence, a clear and important difference exists with respect to reporting to the police. Generally speaking, a large proportion of violence in Canada is not reported to the police (Cotter 2021), and intimate partner violence is especially under-reported (Conroy 2021b).
SSPPS data show that it was relatively common for violence against women to come to the attention of police in remote areas, whether the woman herself reported the incident or it was brought to police attention another way.Note For instance, 43% of women in remote areas who experienced non-intimate partner violence in the previous year stated that police had in some way become aware of the most serious incident―more than three times the proportion among women in accessible areas (12%; data not shown). When it came to women who experienced intimate partner violence, the proportion of those in remote areas who said that police had become aware was almost three times greater than among women in accessible communities (16% versus 6%).
Several factors may affect reporting to police. The frequency with which a woman experiences IPV may correlate with higher rates of reporting to the police. For instance, in Canada as a whole, it was considerably more common for women who had experienced IPV on a daily, weekly or monthly basis to say that the violence had come to the attention of the police (12%), compared to women who had experienced IPV a few times in the previous year (5%) and those who had experienced one instance of IPV (2%; data not shown).Note As noted above, women in remote areas were more likely than those in accessible areas to have experienced multiple instances of IPV during the preceding year (see Table 3).
Other factors specific to different community types may also influence reporting to police. Remote areas can be characterized by smaller populations where more people know each other, a factor which may encourage reporting in some cases and discourage it in others. A victim’s relationship with police in her community―or lack thereof―may come into play, and women who have more close contact with people they know throughout the day may receive more support and encouragement to report. Additionally, if other forms of victims’ services are not available, women in remote communities may perceive reaching out to the police as one of few ways in which they can access help.
While SSPPS data do not show this level of context in which reporting occurs, they do show that women in remote communities are especially more likely to report violence themselves, compared to women in accessible communities. Among women who experienced non-intimate partner violence in the past year, 36% of those who lived in remote areas stated that they themselves contacted the police to report what happened in the most serious incident (Chart 3). This proportion was almost four times greater than among women in accessible areas, among whom 10% said that they personally contacted the police. This pattern was similar when it came to IPV: here, 14% of women in remote communities who experienced it said that they themselves reported it to the police, compared to 4% of women in accessible areas.
Chart 3 start
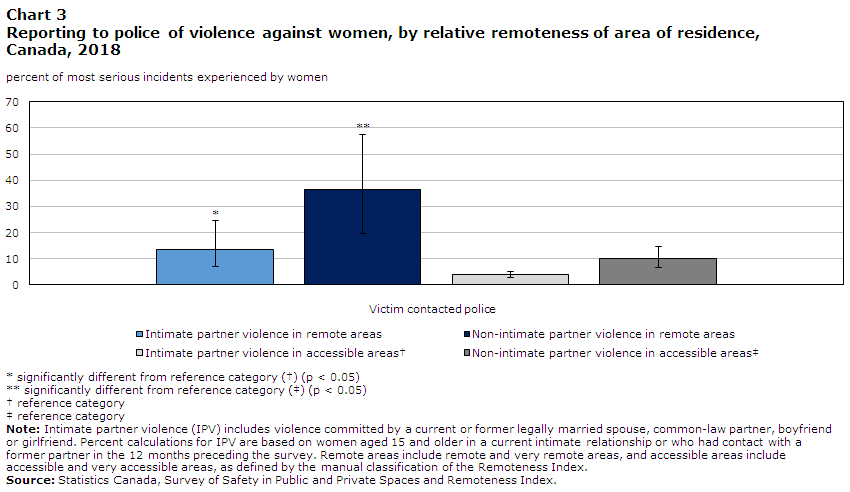
Data table for Chart 3
| Intimate partner violence in remote areas | Non-intimate partner violence in remote areas | Intimate partner violence in accessible areasData table for Chart 3 Note † | Non-intimate partner violence in accessible areasData table for Chart 3 Note ‡ | |||||||||
|---|---|---|---|---|---|---|---|---|---|---|---|---|
| percent of most serious incidents experienced by women | 95% confidence interval | percent of most serious incidents experienced by women | 95% confidence interval | percent of most serious incidents experienced by women | 95% confidence interval | percent of most serious incidents experienced by women | 95% confidence interval | |||||
| from | to | from | to | from | to | from | to | |||||
| Victim contacted police | 14Note * | 7 | 25 | 36Note ** | 20 | 57 | 4 | 3 | 5 | 10 | 7 | 15 |
Source: Statistics Canada, Survey of Safety in Public and Private Spaces and Remoteness Index. |
||||||||||||
Chart 3 end
In other cases, a victim’s friends, family or co-workers may have contacted the police on her behalf, or police may have been alerted by a hospital worker or while responding to another incident.Note
While the reporting of violence against women to the police was substantially more common in remote areas than it was in accessible areas, the opposite was true when it came to violence against men. Just over one in ten (11%) men in remote areas who experienced violence committed by someone other than an intimate partner stated that the most serious incident had been reported to the police, and 4% said that they themselves had reported it (data not shown). These were considerably smaller proportions than among men in accessible communities, among whom 28% of those who had experienced non-intimate partner violence said that it had been reported (with 20% having reported it themselves). Police becoming aware of IPV against men was also less common in remote areas (2%) than in accessible areas (3%). In both remote communities and accessible areas, reporting to police was significantly more common when violence targeted women than men.
Rate of police-reported intimate partner violence over four times higher for women in remote areas
Self-reported data from the SSPPS show that violence against women is as common in remote areas as it is in accessible communities. Self-reported data also show that violence against women which occurs in remote areas more often comes to the attention of police. While it is difficult to estimate the precise impact that this increased reporting has on official crime statistics, rates of violence against women reported by police in remote areas are considerably higher than what police report in accessible communities.Note
According to police-reported data from the 2019 Uniform Crime Reporting Survey (UCR), the rate of IPV against women aged 15 and older living in remote areas was over four times higher than the rate among women in accessible areas (2,002 versus 445 victims per 100,000 women aged 15 and older; data not shown).Note Similarly, the rate of violence committed by someone other than an intimate partner was four times higher for women in remote areas (2,182 versus 574).
Police-reported data show that men in remote areas were also more likely than their counterparts in accessible communities to experience violent crime. Among men, the rate of police-reported IPV was also four times higher for those living in remote areas (535 versus 122 victims per 100,000 men aged 15 and older). The gap between men in remote areas and those in accessible areas persisted when it came to non-intimate partner violence, but was smaller: for non-IPV, the rate among men was three times higher in remote areas (2,442 versus 843 victims per 100,000 men aged 15 and older).
Police-reported violence rates highest in remote areas of the Prairie Provinces
Police-reported data also allow for analysis of violence against women in remote areas of the individual provinces and territories.Note Data from the 2019 UCR show that in each province for which comparisons were possible,Note rates of both intimate partner violence and of non-intimate partner violence were higher for women living in remote areas.
Overall police-reported IPV against women in 2019 was highest in Manitoba and Saskatchewan (Conroy 2021a), and the remote areas of these provinces reported higher rates than remote communities in other provinces (4,571 and 4,017 victims per 100,000 women aged 15 and older, respectively; Table 5). These rates were more than double the average for remote areas in all provinces (1,705) and appeared to drive the overall high rates recorded in all of Manitoba and Saskatchewan; in contrast, the rates of police-reported IPV against women recorded in accessible areas of Manitoba (556) and Saskatchewan (582) were much closer to average for the provinces (445).
Compared to other provinces, rates of IPV against women in remote areas were lower in the Atlantic Provinces and Quebec. As well, while rates in the Atlantic Provinces were higher in remote areas compared to accessible areas, the gaps between rates recorded in the two types of communities were relatively small. Rates in the remote areas of Ontario (2,107), Alberta (1,978) and British Columbia (1,122) were closer to the average for remote areas of all provinces.
The patterns seen with respect to police-reported intimate partner violence against women in the remote areas of the provinces were also present for men in these areas. Notably, in Manitoba, the rate of intimate partner violence against men was 11 times higher in remote areas than in accessible communities (1,262 versus 111 victims per 100,000 men aged 15 and older). In all provinces and territories, rates of police-reported intimate partner violence in remote communities were higher for women than for men. While this appears to contradict self-reported data―which suggest that IPV is as common for men as it is for women in these communities―self-reported data also show that IPV against men in remote areas was considerably less likely to come to the attention of police, compared to violence against women.
Generally speaking, police-reported rates of non-intimate partner violence were distributed in a similar way to IPV rates, with the major exception being that rates were higher among men than among women in most jurisdictions―except for remote areas of Alberta, where the rate was slightly higher among women (1,916 per 100,000, compared to 1,901 among men). As with IPV, rates of police-reported non-intimate partner violence were highest in remote areas of the Saskatchewan and Manitoba, and these provinces also recorded the largest gaps between rates in their remote areas and accessible areas. Rates of non-intimate partner violence in remote areas were generally lowest in the Atlantic region and Quebec, and closer to average in Alberta and British Columbia. In all provinces for which comparisons were possible, rates of non-intimate partner violence were higher in remote areas than in accessible areas.
According to the classifications associated with the Remoteness Index, there are no areas in the territories that are considered accessible.Note Unlike most provinces, rates of non-intimate partner violence in the Northwest Territories and Nunavut were higher among women than men (Chart 4). The difference in rates of intimate partner violence recorded among women and men was also more pronounced than in the provinces: the average rate of intimate partner violence against women in the territories was 7,457 per 100,000 women aged 15 and older, about five times higher than the rate among men (1,519).
Again, it is important to note that self-reported data show that violence comes to the attention of police more often in remote areas. The reasons for this difference remains unknown, but may relate to individuals’ relationships with the police in their communities, proximity to family and close friends who may identify the signs of violence and encourage victims to report, and other related factors.
Chart 4 start
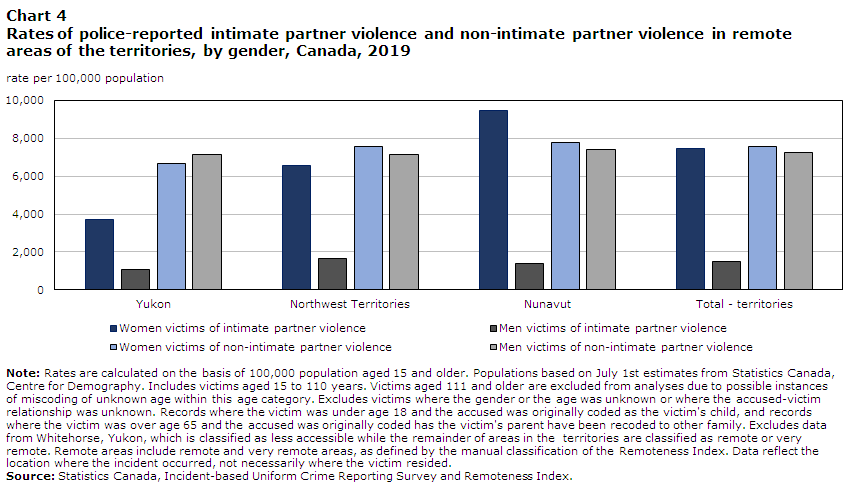
Data table for Chart 4
| Territory | Women victims of intimate partner violence | Men victims of intimate partner violence | Women victims of non-intimate partner violence | Men victims of non-intimate partner violence |
|---|---|---|---|---|
| rate per 100,000 population | ||||
| Yukon | 3,689 | 1,063 | 6,662 | 7,120 |
| Northwest Territories | 6,586 | 1,676 | 7,557 | 7,146 |
| Nunavut | 9,466 | 1,408 | 7,760 | 7,427 |
| Total - territories | 7,457 | 1,519 | 7,560 | 7,251 |
|
Note: Rates are calculated on the basis of 100,000 population aged 15 and older. Populations based on July 1st estimates from Statistics Canada, Centre for Demography. Includes victims aged 15 to 110 years. Victims aged 111 and older are excluded from analyses due to possible instances of miscoding of unknown age within this age category. Excludes victims where the gender or the age was unknown or where the accused-victim relationship was unknown. Records where the victim was under age 18 and the accused was originally coded as the victim's child, and records where the victim was over age 65 and the accused was originally coded has the victim's parent have been recoded to other family. Excludes data from Whitehorse, Yukon, which is classified as less accessible while the remainder of areas in the territories are classified as remote or very remote. Remote areas include remote and very remote areas, as defined by the manual classification of the Remoteness Index. Data reflect the location where the incident occurred, not necessarily where the victim resided. Source: Statistics Canada, Incident-based Uniform Crime Reporting Survey and Remoteness Index. |
||||
Chart 4 end
Women in remote areas more likely to say crime is rising, less likely to have high confidence in the police or criminal courts
Alongside measures of police-reported crime rates, and of reporting of crime to police―all of which are higher in remote areas―are measures of women’s own feelings about safety and crime in their communities. According to self-reported data from the GSS, many women in remote areas said that they believed that crime in their community had increased during the previous five years (41%); this opinion was considerably more common than it was among women in accessible areas (21%; Chart 5). Additionally, women in remote areas were less likely than those in accessible areas to have high confidence in the police (80% versus 91%) or the criminal courts (45% versus 60%). No differences in these perceptions was noted between men in remote areas and men in accessible areas.
Chart 5 start
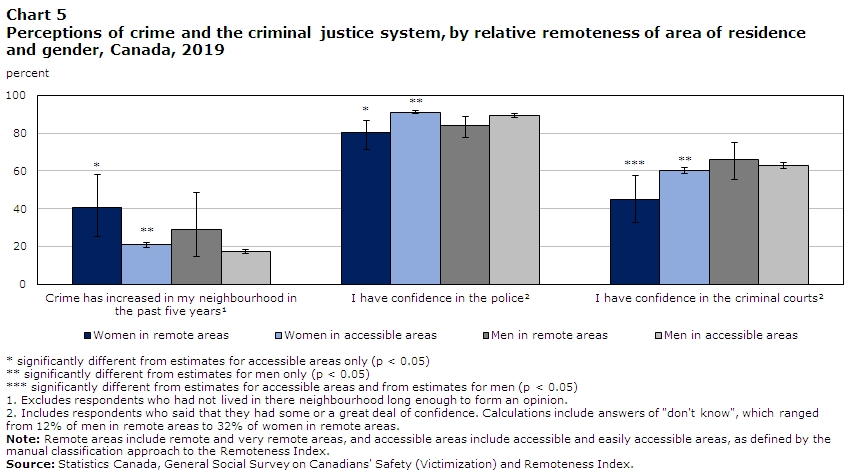
Data table for Chart 5
| Perceptions | Women in remote areas | Women in accessible areas | Men in remote areas | Men in accessible areas | ||||||||
|---|---|---|---|---|---|---|---|---|---|---|---|---|
| percent | 95% confidence interval | percent | 95% confidence interval | percent | 95% confidence interval | percent | 95% confidence interval | |||||
| from | to | from | to | from | to | from | to | |||||
| Crime has increased in my neighbourhood in the past five yearsData table for Chart 5 Note 1 | 41Note * | 25 | 58 | 21Note ** | 20 | 22 | 29 | 15 | 49 | 17 | 16 | 19 |
| I have confidence in the policeData table for Chart 5 Note 2 | 80Note * | 71 | 87 | 91Note ** | 90 | 92 | 84 | 78 | 89 | 89 | 88 | 90 |
| I have confidence in the criminal courtsData table for Chart 5 Note 2 | 45Note *** | 32 | 57 | 60Note ** | 59 | 62 | 66 | 55 | 75 | 63 | 61 | 64 |
Source: Statistics Canada, General Social Survey on Canadians' Safety (Victimization) and Remoteness Index. |
||||||||||||
Chart 5 end
Overall, women and men in remote areas shared similar perceptions about the justice system and crime in their communities. A single exception was with respect to the criminal courts: two-thirds (66%) of men in these communities said that they had either some, or a great deal, of confidence in the criminal courts, compared to less than half (45%) of women. Notably, in accessible areas, women’s confidence in the criminal courts was slightly less favourable than men’s (60% versus 63%).Note
The relative similarity of women’s and men’s perceptions of crime and the justice system in remote areas contrasted to men and women in accessible areas. For instance, in accessible areas, women were slightly more inclined than men to say that crime in their neighbourhoods had increased over the past five years (21% versus 17%), but were slightly more likely to express confidence in police performance (91% versus 89%). However, it should be noted that the lack of differences detected between men and women residents of remote areas may be in part due to the small sample of residents representing those areas in the GSS.
Seven in ten women in remote areas say neighbourhoods have signs of social disorder
In addition to these opinions about crime and the justice system, many women in remote areas talked about some troubled aspects of their communities. More than seven in ten (72%) stated that their neighbourhood was characterized by signs of social disorder―a considerably higher proportion than among women in accessible areas (58%; Chart 6). For example, 52% of women in remote areas stated that people being drunk and rowdy in public was a problem in their neighbourhood, compared to 19% of women in accessible areas. Similarly, women in remote areas more often said that their neighbourhoods had problems with garbage and litter lying around (50%, versus 32% of women in accessible areas), people using or dealing drugs (49% versus 27%), noisy neighbours or loud parties (44% versus 24%), and people being attacked or harassed because of their skin colour, ethnicity or religion (30% versus 10%).
Chart 6 start

Data table for Chart 6
| Signs of social disorder | Women in remote areas | Women in accessible areas | Men in remote areas | Men in accessible areas | ||||||||
|---|---|---|---|---|---|---|---|---|---|---|---|---|
| percent | 95% confidence interval | percent | 95% confidence interval | percent | 95% confidence interval | percent | 95% confidence interval | |||||
| from | to | from | to | from | to | from | to | |||||
| Total - at least one characteristic of neighbourhood disorderData table for Chart 6 Note 1 | 72Note * | 62 | 80 | 58Note ** | 56 | 59 | 68Note * | 58 | 77 | 55 | 53 | 56 |
| Noisy neighbours or loud parties | 44Note * | 30 | 59 | 24 | 22 | 25 | 28 | 20 | 38 | 23 | 22 | 25 |
| Garbage or litter laying around | 50Note * | 37 | 63 | 32 | 30 | 33 | 44Note * | 32 | 57 | 31 | 29 | 33 |
| People attacked because of skin colour, ethnicity or religion | 30Note * | 15 | 50 | 10Note ** | 9 | 11 | 13 | 8 | 19 | 8 | 7 | 9 |
| People using or dealing drugs | 49Note * | 35 | 62 | 27Note ** | 26 | 29 | 32 | 23 | 43 | 24 | 23 | 26 |
| People being drunk or rowdy in public places | 52Note * | 39 | 65 | 19 | 18 | 21 | 39Note * | 28 | 51 | 18 | 17 | 19 |
Source: Statistics Canada, General Social Survey on Canadians' Safety (Victimization) and Remoteness Index. |
||||||||||||
Chart 6 end
Fewer differences in perceptions of neighbourhoods were noted between men living in remote areas and those in accessible areas. Overall, men in remote areas were more likely to have stated that their neighbourhood had at least one characteristic of disorder (68%, versus 55% of men in accessible areas. This difference was based on men in remote areas being more likely to say that their neighbourhood had a problem with garbage laying around (44% versus 31%) and that people being drunk and rowdy in public was a problem (39% and 18%).
Despite negative perceptions about crime and neighbourhood disorder, most women in remote communities feel safe
While some studies have linked negative perceptions of one’s neighbourhood to feelings of personal safety (Cotter 2016), most women (83%) in remote areas felt satisfied or very satisfied with their own safety from crime (Table 4). These women’s feelings of safety were statistically similar to that of men in these areas (87%, data not shown), and were higher than among women in accessible areas (74%). Further, most women in remote areas reported feeling very or reasonably safe when doing things like walking alone at night: most (74%) women in remote areas who walked alone at night felt safe, though 16% (data not shown) reported never walking alone at night to begin with―proportions that were statistically similar to what was reported by women in accessible areas. Similarly, most (71%) women who sometimes spent time alone in their homes at night felt safe doing so, as did most women in accessible areas (76%, a difference not found to be statistically significant).
Notably, an exception to these generally robust feelings of personal safety had to do with use of public transportation. About half (49%) of women in remote communities said that transit was available in their area, and about six in ten (59%, data not shown) of these women said that they sometimes took public transit alone at night. Of those who did, the majority (60%) said that they did not feel safe when doing so. This was not a situation limited to remote areas, however: an equal proportion (60%) of women in accessible areas with access to transit and who used it alone at night said that when they did, they felt unsafe. Further, these findings echo those of other Canadian studies looking at other populations of interest: for instance, among women who were students at post-secondary schools across the provinces, a minority (41%) said that they felt safe using public transportation alone after dark when travelling to and from campus (Burczycka 2020).
One in five women in remote communities experienced online harassment and unwanted sexual behaviours in the previous year
As of 2018, the vast majority of Canadian homes had access to the Internet, including 94% of households in census metropolitan areas or census agglomerations and 90% of households outside of these areas (Statistics Canada 2021b).Note Note According to the 2018 Survey of Safety in Public and Private Spaces, 87% of women in remote communities reported having used the Internet in the previous year (Table 6). This proportion was not statistically different from the proportion recorded among women in accessible communities (90%). As Internet use and social media becomes ever more present in the lives of Canadians, increased attention is being directed at the unwanted distribution of sexual content and other forms of harassment taking place on these platforms, and its relationship to violence which takes place offline (Dunn 2020).
Unwanted sexualized and harassing behaviours which happen online disproportionately target women (Cotter and Savage 2019). Among women in remote communities who used the Internet in the past year, almost one in five (18%) reported having experienced some form of harassing or unwanted sexual behaviour online, compared with 12% of men in these areas (data for men not shown). The rate for women in remote areas was similar to that of women in accessible communities (19%).
Largely, the difference in rates between women and men in remote areas specifically reflected experiences of unwanted sexualized behaviour: 12% of women in remote areas had these experiences online, compared to 8% of men. Unwanted sexualized behaviours online included receiving unwanted sexually explicit media (11% of women in remote communities), being pressured to share intimate images (3%), and someone posting or threatening to post intimate images online (2%).
Online harassment that was not sexual in nature was as common among women in remote communities (11%) as among men in these areas (9%), and among women in accessible areas (12%), as differences were not found to be statistically significant. Just under one in ten (9%) women in remote areas experienced threatening or harassing messages sent to them directly, and 6% experienced threatening or harassing messages that targeted them but were posted publicly or to a group.
In both remote communities and accessible areas, younger women were disproportionately the victims of online harassment and unwanted sexualized behaviours. For instance, while young women aged 15 to 24 made up 14% of women in remote communities who had used the Internet in the previous year, they represented 29% of women targeted with unwanted sexualized behaviours online, 25% of those targeted with other kinds of harassment, and 24% of those who experienced either form of harassing or unwanted sexual behaviour (data not shown). Other studies have shown that young women in particular are consistently overrepresented as targets of unwanted sexualized behaviours and harassment in other, offline, contexts (Cotter and Savage 2019; Burczycka 2020; Burczycka 2021).
Quite often, women in remote areas who experienced online harassment or unwanted sexual behaviour said that a stranger had been responsible (19%; Table 6). Many women also stated that friends or acquaintances (10%) or family members (9%) had been behind what happened. This pattern was fairly consistent across gender and relative remoteness of area of residence.
Negative emotional impacts resulting from online harassment or unwanted sexual behaviour were common for the women in remote areas who experienced it (83%; data not shown). Though overall, this was a similar proportion as men, women were more likely to feel angry (49%), victimized (20%) and fearful (18%). In terms of women’s responses to things that they experienced online, about one in five (19%) women in remote areas said that they had blocked contact from other people. Others restricted their own access in order to protect themselves (14%) and deleted online accounts (4%).
Characteristics of women in remote communities and associated risk factors for victimization
Since the development of the Canadian Index of Remoteness in 2017, it has been used by several studies to look at various aspects of life in remote areas. According to data from the 2016 Census of Population, 4.6% of women and girls in Canada were residents of remote areas (Leclerc 2021).Note Additional data from Census provide more information on the sociodemographic profiles of women in these areas: for instance, the median age of women in remote areas (44.7 years) is higher than the median age for Canada as a whole (41.6), but in very remote areas, their median age is considerably lower (31.0). Other studies have shown that women’s family composition, educational attainment, physical activity levels and mortality vary according to the relative remoteness of their place of residence (Leclerc 2022; Leclerc 2021; Mardare Amini 2022).
Census data also show how the profile of women in remote areas differs from those in accessible areas in terms of Indigenous identity, visible minority identity, and immigrant status (Leclerc 2021). Data from the SSPPS show the ways in which some sociodemographic characteristics may relate to how women in remote areas experience violence.Note
Indigenous women as likely to experience violence in remote areas as in accessible areas
Compared to other areas, remote communities were home to larger proportions of Indigenous women. Data from the 2016 Census show that the majority of Indigenous women and girls (58.2%) live in accessible or easily accessible areas, while 26.7% live in remote or very remote areas (Leclerc 2021).Note However, as the remoteness of communities increases, the proportion of Indigenous women and girls rises considerably: Indigenous women and girls account for 4.9% of women and girls across Canada, and 72.5% of those in very remote areas (Leclerc 2021). Overall, as of the 2016 Census, just over 230,000 Indigenous women and girls lived in remote and very remote areas of Canada (Leclerc 2021).
Intergenerational violence and trauma are pervasive in Indigenous communities, and systemic discrimination and racism have made Indigenous people vulnerable to victimization outside of their communities as well (National Inquiry into Missing and Murdered Indigenous Women and Girls 2019). Indigenous women, girls and gender diverse people have been shown to experience violence at disproportionately high levels (National Inquiry into Missing and Murdered Indigenous Women and Girls 2019). In remote areas, considerable proportions of Indigenous women experienced violence (Table 7a, Table 7b, Table 7c). For instance, just under one in ten (9%) Indigenous women had been victimized by an intimate partner or someone else in the past 12 months (Table 7b). One in ten Métis women experienced violence (10%), as did 6% of First Nations women. Inuit women experienced an especially high prevalence of violence (20%)―echoing findings from the National Inquiry into Missing and Murdered Indigenous Women and Girls (2019), which showed how colonization has engendered particularly high rates of violence among Inuk women. Overall, the prevalence of violence among Indigenous women in remote areas was comparable to those living in accessible communities (8%, a difference not found to be statistically significant).
The prevalence of violence was not found to be statistically different between Indigenous women in remote areas and their non-Indigenous counterparts (9% and 6%), including among women who experienced violence outside of intimate partner relationships (5% and 4%) as well as IPV (14% and 11%; Table 7a, Table 7b, Table 7c). The prevalence of specific kinds of violence were also shown to be similar for Indigenous and non-Indigenous women in these areas, as was the frequency of instances of IPV that women experienced. However, the small sample size on which these findings are based may mask differences in the experiences of these groups: other Canadian studies using both police-reported and self-reported data have consistently found higher rates of victimization among Indigenous women (Allen 2020; Boyce 2016; Heidinger 2022). Moreover, qualitative research has suggested the normalization of gender-based violence against women in many remote Indigenous communities as a pervasive consequence of colonization (Brassard et al. 2015), pointing to potential under-acknowledgement of violence among women in these areas.
Notably, a logistic regression showed that Indigeneity itself did not increase a woman’s odds of experiencing IPV, when other risk factors for victimization were taken into account. This held true for Indigenous women living in remote areas and those in accessible communities. Instead, increased odds of experiencing IPV were associated with factors such as having experienced child abuse―another legacy of colonialism, which is more prevalent among the Indigenous population.
Under a quarter of Indigenous women in remote communities who had experienced IPV in the previous year said that they had reached out to a victims’ service for support (23%; data not shown). This proportion was not statistically different from that reported by non-Indigenous women in these areas. While sample size does not allow for further analysis of Indigenous women’s experiences with victims’ services in remote areas, a 2018 study on residential facilities for Indigenous victims and survivors of abuse does. According to data from the Survey of Residential Facilities for Victims of Abuse, in April 2018 there were 47 short-term shelters serving primarily Indigenous populations in rural areas, with a total of 517 beds; on the day on which data were collected, 68% of the beds available at these shelters were occupied, and 23% of shelters were full (Maxwell 2020).Note Notably, occupancy rates were highest in the territories (118%) and in rural parts of Alberta (104%) and Manitoba (80%); as noted, the remote areas of these provinces and the territories also recorded high rates of police-reported violence against women.
Odds of victimization higher for women with a disability in accessible areas, but not in remote areas
Living with a mental or physical disability has elsewhere been linked to an increased risk of experiencing violence (Burczycka 2018a; Cotter 2018). About one in ten (9%) women with a mental or physical disability who lived in a remote area experienced violence in the past year, a proportion that was very close to the proportion among women with a disability living in accessible areas (10%, a difference not found to be statistically significant; Table 7b).
Notably, in accessible areas, women with a disability were more commonly the victims of violence when compared to women with no disability (10% versus 4%); in remote areas, however, no statistically significant difference was found between women with a disability (9%) and those without (5%) when it came to violent victimization.Note Findings were consistent for both intimate partner and non-intimate partner violence (Table 7a, Table 7c). Additionally, the presence of a disability increased the odds of a woman living in an accessible area becoming a victim of IPV, even when other relevant factors were accounted for (Table 8); this finding was consistent with previous studies conducted at the national level (Burczycka 2018b; Perreault 2015). Among women in remote areas, however, the presence of a disability was not a factor that increased the odds of intimate partner victimization.
Prevalence of violence similar for LGBTQ2+ women in remote communities as for those in accessible areas
Overall, the proportion of women in remote areas who identified as LGBTQ2+ was about half the proportion among those in accessible areas (2% versus 4%; data not shown). Canadian studies have repeatedly shown that LGBTQ2+ women face higher rates of violent victimization than non-LGBTQ2+ women (Jaffray 2021; Simpson 2018).Note Data from the SSPPS show that the prevalence of gender-based violence against LGBTQ2+ women who live in remote communities is similar to that experienced by those in accessible areas. For instance, 12% of LGBTQ2+ women in remote areas indicated that they had experienced some form of violence in the previous 12 months, along with 17% of those in accessible areas (a difference not found to be statistically significant; Table 7b). Violence committed by someone other than an intimate partner was experienced by about one in ten LGBTQ2+ women in remote areas (10%) and in accessible areas (12%; again, not a statistically significant difference; Table 7a).
Violence against LGBTQ2+ women in accessible areas was more common than it was for their non-LGBTQ2+ counterparts, but no statistically significant difference was found between LGBTQ2+ women and non-LGBTQ2+ women in remote areas.Note
Weak economic resiliency more common for women in remote areas
Economic resiliency―the ability to easily withstand unexpected expenses or make ends meet―is intrinsically linked to a woman’s experience of IPV. Preventing a partner from having access to a job, money or financial resources is itself a form of gender-based violence which occurs in intimate partnerships. In other situations, a family for whom expenses are met with difficulty may experience greater levels of stress, which can contribute to violence, while a woman who has less access to financial resources may find it more difficult to secure safe housing away from an abusive partner (Annan 2008). Additionally, women who leave a home shared with an abusive partner may experience financial hardship as they attempt to secure housing and perhaps adjust to life as a single parent.
While the economic aspects of violence against women are already an element of many victims’ service programs, addressing the issue from the perspective of remote communities is important. The inadequate availability of housing in remote areas has received much attention in Canada, and moving to a different community in order to find a place to live can be especially difficult. Other issues, such as access to employment and the generally higher cost of common household goods can also pose particular difficulties for women in remote areas (Daley et al. 2015; Leclerc 2021).
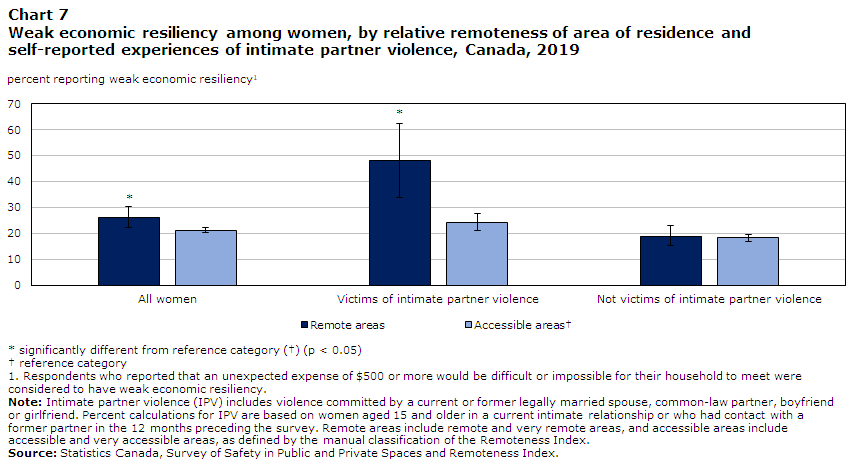
According to the SSPPS, weaker economic resiliency was more common for women in remote communities, compared to women in accessible areas. Overall, 26% of women in remote areas stated that an unexpected expense of $500 or more would be difficult or impossible for their household to meet; this was slightly higher than among women in accessible areas (21%; Chart 7). Among men, as well, weaker economic resiliency was reported by a larger proportion of those in remote areas (20%, versus 16% of men in accessible areas; data not shown). In both types of communities, it was more common for women to report weak economic resiliency, compared to men: 26% versus 20% among residents of remote areas, and 21% versus 16% in accessible areas.
Chart 7 start
Data table for Chart 7
| Remote areas | Accessible areasData table for Chart 7 Note † | |||||
|---|---|---|---|---|---|---|
| percent reporting weak economic resiliencyData table for Chart 7 Note 1 | 95% confidence interval | percent reporting weak economic resiliencyData table for Chart 7 Note 1 | 95% confidence interval | |||
| from | to | from | to | |||
| All women | 26Note * | 22 | 30 | 21 | 20 | 22 |
| Victims of intimate partner violence | 48Note * | 34 | 62 | 24 | 21 | 28 |
| Not victims of intimate partner violence | 19 | 15 | 23 | 18 | 17 | 19 |
Source: Statistics Canada, Survey of Safety in Public and Private Spaces and Remoteness Index. |
||||||
Chart 7 end
Risk of victimization correlated with weak economic resiliency among women in remote areas
While it is important to point out that the direction of this association between weak economic resiliency and IPV among women in remote areas is not known―women may have experienced weak economic resiliency before the onset of violence, after, or both―the proportions of women in remote areas who report both of these experiences is notable. In addition, a multivariate analysis―in which various factors, including a woman’s age, marital status, status as an LGBTQ2+ or Indigenous person, and othersNote are accounted for―provides additional support for this correlation. Among women living in remote communities, weak economic resiliency increased a woman’s odds of having experienced intimate partner violence in the past year. Even when other factors were accounted for, women in remote areas for whom an expense of $500 would be difficult had odds of intimate partner victimization that were over three times higher than those who could easily handle such an expense (Table 8). Notably, this association was absent for women in accessible areas: for these women, weak economic resiliency did not increase the odds of experiencing IPV.
Many women who experienced IPV in remote areas reported weak economic resiliency: almost half (48%) said that they would find it difficult or impossible to manage an unexpected expense of $500 or more (Chart 7). In comparison, this was the case for a smaller proportion (19%) of women in remote areas who had not experienced IPV. Additionally, weak economic resiliency among women in accessible areas who experienced IPV was considerably less common (24%).
In this way, economic vulnerability is a particularly important aspect of IPV for women in remote areas. While economic vulnerability no doubt creates negative impacts for women in more accessible areas as well, the relationship between weak economic resiliency and IPV was particularly strong for women in remote communities.
Experiences of abuse in childhood as common for women in remote areas as in other communities
While certain demographic characteristics are often relevant to the analysis of violence against women, women’s experiences of abuse in childhood consistently figure into these discussions. In other studies, having experienced sexual or physical abuse before age 15 has been found to be among the strongest predictors of victimization in adulthood, for women as well as for men, and even when many other risk factors are accounted for (Burczycka 2018b; Cotter 2021; Perreault 2015).
The SSPPS asked women about physical and sexual abuse that they may have experienced in childhood. For many women, this abuse may have happened decades prior―and during the intervening years, some of these women may have moved from accessible areas where they lived as children to remote communities (or vice-versa). This caveat must be considered when childhood experiences of women currently living in remote areas are reviewed. With this in mind, self-reported data from the SSPPS show that experiences of sexual and/or physical abuse in childhood was as common for women in remote areas as it was for those in accessible areas, with over a quarter of women in both types of communities having been victimized this way at least once (27% and 28%, a difference not found to be statistically significant; data not shown).
Among women in remote areas, 20% experienced physical abuse before age 15, and 13% experienced sexual abuse before age 15. These proportions were similar to those among women in accessible areas. When it came to most forms of physical and sexual child abuse, the number of instances experienced by women was similar whether they lived in remote areas or accessible communities. Two exceptions were noted: women in accessible areas were slightly more likely than those in remote areas to say that as children, they had been pushed, grabbed or shoved by an adult 6 to 10 times (1% versus 0.4%), and that they had been kicked, punched or choked by an adult more than ten times (2% versus 1%; Chart 8).
Chart 8 start

Data table for Chart 8
| Remote areas | Accessible areasData table for Chart 8 Note † | |||||
|---|---|---|---|---|---|---|
| percent of women | 95% confidence interval | percent of women | 95% confidence interval | |||
| from | to | from | to | |||
| Pushed, grabbed or shoved by an adult | ||||||
| Once or twice | 4.9 | 3.5 | 6.9 | 5.7 | 5.2 | 6.4 |
| 3 to 5 times | 3.2 | 1.9 | 5.3 | 2.3 | 2.0 | 2.7 |
| 6 to 10 times | 0.4Note * | 0.2 | 1.1 | 1.1 | 0.9 | 1.3 |
| More than 10 times | 2.8 | 1.9 | 4.3 | 3.3 | 2.9 | 3.7 |
| Kicked, punched or choked by an adult | ||||||
| Once or twice | 1.9 | 1.1 | 3.2 | 2.2 | 1.9 | 2.6 |
| 3 to 5 times | 0.7 | 0.4 | 1.3 | 0.9 | 0.7 | 1.1 |
| 6 to 10 times | 0.4 | 0.1 | 1.3 | 0.4 | 0.3 | 0.5 |
| More than 10 times | 1.1Note * | 0.7 | 1.9 | 1.9 | 1.6 | 2.3 |
Source: Statistics Canada, Survey of Safety in Public and Private Spaces and Remoteness Index. |
||||||
Chart 8 end
Women in remote communities who had been sexually or physically victimized as children were significantly more likely to have experienced IPV in the previous year. This was the case for almost one in five (19%) women in remote areas who were abused as children―more than twice the proportion as among women who had not experienced child abuse (9%; Table 7c). A logistic regression also revealed a significant association between childhood physical and/or sexual abuse and IPV among women in remote areas: with other risk factors commonly associated with victimization―including age, disability, and others―taken into account, abuse in childhood more than doubled the odds of IPV in adulthood among women in remote areas (2.57 times; Table 8). The association between child abuse and IPV was also present for women living in accessible areas, when the same factors were accounted for. Among these women, those with a history of child abuse had almost twice the odds of experiencing IPV later in life (1.92 times).
Women in remote areas who had been victimized as children had the same prevalence of non-intimate partner violence as those who had not experienced child abuse (4% each; Table 7a). In contrast, among women in accessible areas, non-intimate partner violence was more common among those who had experienced child abuse (7%) than it was among those who had not (4%).
Police-reported violence against girls under age 15 considerably higher in remote areas
Childhood physical and sexual abuse often goes unreported to the police. For instance, a small proportion (5%) of women in remote areas who experienced child abuse stated that the situation had been brought to the attention of the police. In accessible areas, this proportion was 7% (a difference not found to be statistically significant; data not shown). Nevertheless, police-reported data on child abuse provide important information on when and where sexual and physical violence against children occurs.
In 2019, police in remote areas reported rates of violence against children aged under 15 that were considerably higher than rates reported by police in accessible areas. In remote areas, police-reported rates of sexual assault and sexual violations against girls were especially high: these offences occurred at a rate of 1,014 victims per 100,000 girls under age 15, a rate over three times higher than in accessible areas (322 per 100,000; Chart 9). The rate of physical assaultNote was four times higher for girls aged 15 and younger in remote areas (874 per 100,000 girls, versus 223 per 100,000 in accessible areas).
For both boys and girls, rates of sexual assault and sexual violations against children, physical assault, and other violence were higher among residents of remote communities.
Chart 9 start

Data table for Chart 9
| Girls in remote areas | Girls in accessible areas | Boys in remote areas | Boys in accessible areas | |
|---|---|---|---|---|
| rate per 100,000 population | ||||
| Sexual violationsData table for Chart 9 Note 1 | 1,014 | 322 | 191 | 72 |
| Physical assault (levels 1, 2 and 3) | 874 | 223 | 948 | 325 |
| Other violence | 324 | 134 | 271 | 140 |
Source: Statistics Canada, Incident-based Uniform Crime Reporting Survey and Remoteness Index. |
||||
Chart 9 end
Impacts of violence, women’s mental health similar for women in remote areas and accessible areas
Violence can result in a range of emotional and psychological impacts on victims. Women in remote areas who experienced physical or sexual violence committed by someone other than an intimate partner often reported being more cautious or aware as a result (68%), and feeling upset, confused or frustrated (65%), fearful (59%) or angry (55%; data not shown). In remote areas, women who experienced IPV also reported feeling upset, confused or frustrated (64%), being more cautious and aware (47%) and angry (43%), and many also felt hurt or disappointed (69%). Additionally, about one in six (18%) women in remote areas who experienced non-intimate partner violence, and 16% of those who experienced IPV, reported enough such symptoms to be consistent with a potential diagnosis of Post-Traumatic Stress Disorder (PTSD).Note Almost all impacts of intimate partner violence and of violence committed by others were as common for women in remote areas and those in accessible areas.
In addition to specific emotional and psychological impacts of intimate partner violence, the SSPPS asked women to rate their overall mental health. Generally, most women in remote areas described their mental health as good to excellent (89%; data not shown); however, women who had experienced IPV were considerably more likely than those who had not to report their mental health as fair or poor. One in five (21%) women in remote communities who had experienced IPV in the past year described their mental health as fair or poor―twice the proportion as among women who had not experienced IPV (10%). These findings were similar to those among women in accessible areas.
In the context of violence against women, access to mental health care and mental health outcomes are particularly relevant, given the well-established impacts of victimization on mental health (Goodman et al. 1993; Resnick et al. 1997). While the prevalence of violence and its mental and psychological impacts were similar regardless of where women lived, many observers have pointed out that access to mental health care is not evenly distributed across Canada, and especially lacking in Indigenous communities (Friesen 2019; National Inquiry into Missing and Murdered Indigenous Women and Girls 2019).
Mardare Amini’s (2022) study of mental and physical health among women in Canada’s remote areas shows that women and girls in very remote areas (specifically) reported the weakest mental health, but were no more likely than those in other areas to have seen or consulted with a mental health professional.Note Mardare Amini cites several other studies to provide context for this finding, and suggests availability of services, their accessibility, financial constraints, and stigma related to confidentiality as barriers that may disproportionately affect women in remote areas who seek mental health support.
Alcohol use leading to harm more common among women in remote areas
Substance use, including the use of alcohol, is intrinsically linked to mental health (American Psychiatric Association 2013). While access to mental health care in remote communities can be limited, access to treatment and support for those living with addiction and substance use in remote areas of Canada can also be difficult (Matsumoto et al. 2017).
The SSPPS included several questions aimed at measuring alcohol use among respondents. The resulting data show that in general, the frequency of alcohol use among women in remote areas appeared similar to that of women in accessible areas. For instance, similar (not statistically different) proportions said that they never drank alcohol or did so less than once per month (51% in remote areas and 46% in accessible areas) or that they drank daily (2% versus 3%). Differences were limited to the proportions who said they drank once a month (11% versus 8%) or two or three times a month (11% versus 14%; data not shown).
Beyond measure of the frequency of alcohol use, however, are other measures which provide important insight. The SSPPS included questions adapted from the 2012 Canadian Community Health Survey on Mental Health―which, while not designed to produce a medical diagnosis of alcohol abuse, are nonetheless useful in estimating the potential prevalence of alcohol abuse in a population.Note A key criterion in these estimates is the degree to which an individual’s use of alcohol negatively impacts their lives. As such, respondents to the 2018 SSPPS were asked if there was ever a time in their lives when their drinking caused arguments or other serious or repeated problems with their family, friends, neighbours, or co-workers.Note
According to the SSPPS, it was more common for women in remote areas to report that their alcohol use had caused these kinds of problems in their lives. Overall, about one in eight (12%) women in these communities said that their drinking had caused arguments or other serious or repeated problems with others; this was double the proportion of women in accessible areas who said that this was the case (6%; Chart 10). Notably, problems related to alcohol use were especially prevalent among women in remote areas who experienced IPV in the previous year, among whom more than one-quarter (26%) reported problems with friends, family members and others that had been caused by their own use of alcohol. In contrast, problems caused by their drinking were reported by one in ten (10%) women in remote areas who had not experienced IPV.
Chart 10 start
Data table for Chart 10
| Remote areas | Accessible areas | |||||
|---|---|---|---|---|---|---|
| percent who reported problems caused by their alcohol use | 95% confidence interval | percent who reported problems caused by their alcohol use | 95% confidence interval | |||
| from | to | from | to | |||
| All women | 12 | 9 | 15 | 6 | 6 | 7 |
| Women who experienced intimate partner violence | 26Note * | 16 | 41 | 14Note * | 11 | 17 |
| Women who did not experience intimate partner violence | 10 | 7 | 13 | 6 | 5 | 6 |
Source: Statistics Canada, Survey of Safety in Public and Private Spaces and Remoteness Index. |
||||||
Chart 10 end
While an association between alcohol use and experiencing IPV exists, its directionality is not known. While for some women, alcohol use may predate IPV, for others it may develop during or after experiences of violence. For some people, using or increasing use of alcohol may present as a way of coping with trauma.
Other patterns of alcohol use have been linked to experiences of IPV among women. Binge drinking―for women, defined as consuming four or more alcoholic beverages in one sitting―has elsewhere been identified as a significant risk factor for a variety of adverse physical, mental and social health effects for women (Wilsnack et al. 2018). Among these, women’s binge drinking has been linked to an increased risk of experiencing violence (Burczycka 2018b; Perreault 2020). Additionally, experiencing intimate partner violence has been associated with women’s binge drinking (Graham 2008; Timko et al. 2008).
Data from the SSPPS show that overall, one in seven (14%) women in remote areas reported binge drinking more than once per month in the year preceding the survey (Chart 11). This proportion rose sharply, however, among women who had experienced IPV: over a third (35%) of women in remote areas who had experienced IPV in the previous year stated that they engaged in binge drinking more than once a month during that time. In contrast, among women who had not experienced IPV, less than half that proportion (15%) reported binge drinking in the previous year. Notably, the association between experiencing IPV and binge drinking remained even when other factors were taken into account: after controlling for other factors commonly associated with IPV, women in remote areas who engaged in binge drinking more than once per month had almost three times the odds of experiencing IPV, compared with women who engaged once per month or less (2.65 times; Table 8).
Chart 11 start
Data table for Chart 11
| Remote areas | Accessible areas | |||||
|---|---|---|---|---|---|---|
| percent who reported binge drinking more than once per month | 95% confidence interval | percent who reported binge drinking more than once per month | 95% confidence interval | |||
| from | to | from | to | |||
| All women | 14 | 11 | 18 | 12 | 11 | 12 |
| Women who experienced intimate partner violence | 35Note * | 22 | 50 | 21Note * | 18 | 25 |
| Women who did not experience intimate partner violence | 15 | 11 | 20 | 12 | 11 | 13 |
Source: Statistics Canada, Survey of Safety in Public and Private Spaces and Remoteness Index. |
||||||
Chart 11 end
In general, these patterns were similar to those reported by women in accessible areas. For instance, women in accessible areas who engaged in binge drinking had almost two times the odds of having experienced IPV (1.76 times). Further, the overall prevalence of binge drinking was similar among women in remote areas (14%) and among those in accessible areas (12%, a difference not found to be statistically significant). Despite these similarities, however, the relative remoteness of a woman’s area of residence may have distinct relationships with alcohol use.
Notably, about one-third of women in both remote areas and accessible areas who experienced IPV in the previous year stated that at least some of the violence had occurred while their abuser was drinking (31% and 28%, a difference not found to be statistically significant; data not shown). Other studies have found strong correlations between alcohol use by partners and women’s experiences of intimate partner violence (Coker et al. 2000).
Summary
While both self-reported intimate partner violence and non-intimate partner violence were as common for women living in remote areas as they were for women in accessible areas, important differences speak to how women respond to these experiences. For instance, women in remote areas were more likely to move out of the home they shared with an abusive partner, despite a documented housing crisis in these areas of Canada, and as likely to stay with family or friends. However, women in these areas also reported weaker economic resiliency, which itself was strongly associated with intimate partner victimization. While it is not known if problems with household finances contributed to IPV or resulted from a woman leaving an abusive home―or both―this correlation signals an important aspect of how women in remote areas experience intimate partner violence.
Self-reported data show that women in remote communities were considerably more likely than their counterparts in accessible areas to report both intimate partner and non-intimate partner violence to the police. While the circumstances for this are not known, these findings provide interesting context for police-reported data. Police-reported data show that women, and men, in remote areas experience rates of both IPV and non-intimate partner violence that are considerably higher than their counterparts in accessible areas. Higher rates of police-reported violence were also experienced by children in remote communities.
While women in remote communities were more likely to reach out to the police when they experienced intimate partner violence, their use of other types of victims’ services was similar to that of women in accessible areas. In both types of communities, women often stated that what they had experienced was not severe enough to make them want to reach out; reasons related to accessibility were cited less often. The impacts of violence on women’s psychological well-being, and women’s self-rated mental health overall, were also similar regardless of the remoteness of where women lived.
Remote areas were home to many First Nations, Métis and Inuit (Indigenous) women. Indigenous women in these areas had a similar prevalence of intimate partner and non-intimate partner violence to their counterparts in accessible areas. When it came to many other populations of interest―visible minority women or immigrant women, for instance―their numbers in remote areas were too small for analysis.
Notably, patterns of alcohol use which cause interpersonal problems, as well as binge drinking, were more prevalent in the lives of women in remote communities. Women in remote communities were considerably more likely to engage in these kinds of alcohol use, compared to women in other areas. These kinds of alcohol use were also significantly correlated with having experienced IPV among women, although it is not known if they predated IPV, or developed during or after abuse.
Detailed data tables
Data sources
Remoteness Index
The geographic classification used in this report is based on the Remoteness Index (RI) value assigned to each Canadian Census Subdivision (CSD). The RI was developed at Statistics Canada in 2017, and classifies each CSD according to the ease with which its residents can access essential goods and services. For more information on the development and methodology of the RI, see Alasia et al. (2017).
The RI assigns a numeric value to each CSD. CSDs with a value of 1.0 are the most remote, with remoteness decreasing as the value decreases towards 0.0. Based on these values, CSDs are grouped into five categories: very remote, remote, less accessible, accessible, and easily accessible. Several methods exist for determining the numerical cut-off points for these categories; the present report uses the “manual classification method”. For more information on this and other methods through which classifications can be applied to the RI, see Subedi et al. (2020). In the present report, following the classification of CSDs according to the manual classification method, the resulting categories were grouped: remote areas include both remote and very remote areas and accessible areas include both accessible and easily accessible areas, while the category less accessible remains as it was following the manual classification method.
Survey of Safety in Public and Private Spaces
In 2018, Statistics Canada conducted the first cycle of the Survey of Safety in Public and Private Spaces (SSPPS). The purpose of the survey is to collect information on Canadians’ experiences in public, at work, online, and in their intimate partner relationships.
The target population for the SSPPS is the Canadian population aged 15 and over, living in the provinces and territories. Canadians residing in institutions are not included. This means that the survey results may not reflect the experiences of intimate partner violence among those living in shelters, hospitals, prisons, other institutions or other collective dwellings. Once a household was contacted, an individual 15 years or older was randomly selected to respond to the survey.
In the provinces, data collection took place from April to December 2018 inclusively. Responses were obtained by self-administered online questionnaire or by interviewer-administered telephone questionnaire. Respondents were able to respond in the official language of their choice. The sample size for the 10 provinces was 43,296 respondents. The response rate in the provinces was 43.1%.
In the territories, data collection took place from July to December 2018 inclusively. Responses were obtained by self-administered online questionnaire or by interviewer-administered in-person questionnaire. Respondents were able to respond in the official language of their choice. The sample size for the 3 territories was 2,597 respondents. The response rate in the territories was 73.2%.
Non-respondents included people who refused to participate, could not be reached, or could not speak English or French. Respondents in the sample were weighted so that their responses represent the non-institutionalized Canadian population aged 15 and older.
General Social Survey on Canadians’ Safety (Victimization)
In 2019, Statistics Canada conducted the General Social Survey (GSS) on Canadians’ Safety (Victimization) for the seventh time. Previous cycles were conducted in 1988, 1993, 1999, 2004, 2009 and 2014. The main objective of the GSS on Victimization is to better understand issues related to the safety and security of Canadians, including perceptions of crime and the justice system, experiences of intimate partner violence, and how safe people feel in their communities. The target population was persons aged 15 and older living in the provinces and territories, except for those living full-time in institutions.
Data collection took place between April 2019 and March 2020. Responses were obtained by computer-assisted telephone interviews (CATI), in-person interviews (in the territories only) and, for the first time, the GSS on Victimization offered a self-administered Internet collection option to survey respondents in the provinces and in the territorial capitals. Respondents were able to respond in the official language of their choice.
The sample size for the GSS on Victimization was 22,412 respondents, with a response rate of 37.6%. Respondents in the sample were weighted so that their responses represent the non-institutionalized Canadian population aged 15 and older.
Uniform Crime Reporting Survey
The Incident-based Uniform Crime Reporting Survey (UCR) collects detailed information on criminal incidents that have come to the attention of, and have been substantiated by, police services in Canada. Information includes characteristics of victims, accused persons and incidents. In 2019, data from police services covered 99% of the population of Canada. Some victims experience violence over a period of time, sometimes years, all of which may be considered by the police to be part of one continuous incident.
In general, for police-reported incidents that involve violations against the person, a victim record is collected for each victim involved in the incident. If an individual is a victim in multiple incidents in the same reference year, that individual will be counted as one victim for each separate incident. Some victims experience violence over a period of time, sometimes years, all of which may be considered by the police to be part of one continuous incident and are counted as a single victim.
Victim age is calculated based on the end date of an incident, as reported by the police. Victims for whom age and gender are unknown, victims aged over 110 years, and victims aged 0 years with an invalid date of birth (province of Quebec only) are excluded, due to possible miscoding.
Intimate partner violence includes violent Criminal Code violations committed by a current or former spouse, common-law partner, girlfriend, boyfriend or other intimate partner (a person with whom the victim shared a sexual attraction or relationship, but to whom no other relationship categories apply).
Data limitations
As with any household survey, there are some data limitations. The results are based on a sample and are therefore subject to sampling errors. Somewhat different results might have been obtained if the entire population had been surveyed.
For the quality of estimates from the SSPPS and GSS on Victimization, the lower and upper bounds of the confidence intervals are presented. Confidence intervals should be interpreted as follows: If the survey were repeated many times, then 95% of the time (or 19 times out of 20), the confidence interval would cover the true population value.
References
Alasia, Alessandro, Frédéric Bédard, Julie Bélanger, Eric Guimond and Christopher Penney. 2017. “Measuring remoteness and accessibility - A set of indices for Canadian communities.” Reports on Special Business Projects. Statistics Canada Catalogue no. 18-001-X.
Allen, Mary. 2014. “Victim services in Canada, 2011/2012.” Juristat. Statistics Canada catalogue no. 85-002-X.
Allen, Mary. 2020. “Crime reported by police serving areas where the majority of the population is Indigenous, 2018.” Juristat. Statistics Canada catalogue no. 85-002-X.
Allen, Mary and Samuel Perreault. 2015. “Police-reported crime in Canada’s Provincial North and Territories, 2013.” Juristat. Statistics Canada catalogue no. 85-002-X.
American Psychiatric Association. 2013. Diagnostic and Statistical Manual of Mental Disorders. 5th ed. Arlington, VA: American Psychiatric Publishing.
Annan, Sandra. 2008. “Chapter 3: Intimate partner violence in rural environments.” Annual Review of Nursing Research. Vol. 26.
Boyce, Jillian. 2016. “Victimization of Aboriginal people in Canada, 2014.” Juristat. Statistics Canada Catalogue no. 85-002-X.
Brassard, Renée, Lyse Montminy, Anne-Sophie Bergeron and Itzel A. Sosa-Sanchez. 2015. “Application of intersectional analysis to data on domestic violence against Aboriginal women living in remote communities in the province of Quebec.” Aboriginal Policy Studies, Vol. 4, no. 1.
Burczycka, Marta. 2016. “Trends in self-reported spousal violence in Canada, 2014.” In Family violence in Canada: A statistical profile, 2014. Juristat. Statistics Canada Catalogue no. 85-002-X
Burczycka, Marta. 2018a. “Violent victimization of Canadians with mental health-related disabilities, 2014.” Juristat. Statistics Canada Catalogue no. 85-002-X.
Burczycka, Marta. 2018b. “Section 1: Stalking in Canada, 2014.” In Family violence in Canada: A statistical profile, 2016, Juristat. Statistics Canada Catalogue no. 85-002-X.Burczycka, Marta. 2020. “Students’ experiences of unwanted sexualized behaviours and sexual assault at postsecondary schools in the Canadian provinces, 2019.” Juristat. Statistics Canada Catalogue no. 85-002-X.
Burczycka, Marta. 2020. « Students’ experiences of unwanted sexualized behaviours and sexual assault at postsecondary schools in the Canadian provinces, 2019.” Juristat. Statistics Canada Catalogue no. 85-002-X.
Burczycka, Marta. 2021. “Workers' experiences of inappropriate sexualized behaviours, sexual assault and gender-based discrimination in the Canadian provinces, 2020.” Juristat. Statistics Canada Catalogue no. 85-002-X.
Canadian Radio-television and Telecommunications Commission. 2020. Communications Monitoring Report, 2019. Canadian Radio-television and Telecommunications Commission Catalogue no. BC9-9E-PDF.
Coker, Ann L., Paige Hall Smith, Robert E. McKeown, and Melissa J. King. 2000. "Frequency and correlates of intimate partner violence by type: physical, sexual, and psychological battering." American Journal of Public Health. Vol. 90, no. 4.
Conroy, Shana. 2021a. “Family violence in Canada: A statistical profile, 2019.” Juristat. Statistics Canada Catalogue no. 85-002-X.
Conroy, Shana. 2021b. “Spousal violence in Canada, 2019.” Juristat. Statistics Canada Catalogue no. 85-002-X. Juristat. Statistics Canada Catalogue no. 85-002-X.
Cotter, Adam. 2016. “Canadians’ perceptions of neighbourhood disorder, 2014.” Spotlight on Canadians: Results from the General Social Survey. Statistics Canada Catalogue no. 89-652-X.
Cotter, Adam. 2018. “Violent victimization of women with disabilities, 2014.” Juristat. Statistics Canada Catalogue no. 85-002-X.
Cotter, Adam. 2021. “Criminal victimization in Canada, 2019.” Juristat. Statistics Canada Catalogue no. 85-002-X.
Cotter, Adam and Laura Savage. 2019. “Gender-based violence and unwanted sexual behaviour in Canada, 2018: Initial findings from the Survey of Safety in Public and Private Spaces.” Juristat. Statistics Canada Catalogue no. 85-002-X.
Daley, Angela, Peter Burton, and Shelley Phipps. 2015. "Measuring poverty and inequality in northern Canada." Journal of Children and Poverty. Vol. 21, no. 2.
Dunn, Suzie. 2020. “Technology-Facilitated Gender-Based Violence: An Overview.” Supporting a Safer Internet Paper no. 1.
Friesen, Erik. 2019. “The landscape of mental health services in rural Canada.” University of Toronto Medical Journal. Vol. 96, no. 2.
Goodman, Lisa A., Mary P. Koss, and Nancy Felipe Russo. 1993. "Violence against women: Physical and mental health effects. Part I: Research findings." Applied and Preventive Psychology. Vol. 2, no. 2.
Graham, Kathryn Marie (ed). 2008. Unhappy Hours: Alcohol and Partner Aggression in the Americas. Washington, DC: Pan American Health Organization.
Heidinger, Loanna. 2022. “Violent victimization and perceptions of safety: Experiences of First Nations, Métis and Inuit women in Canada.” Juristat. Statistics Canada Catalogue no. 85-002-X.
House of Commons, 42nd Parliament, 1st Session. 2019. “Surviving abuse and building resilience: A study of Canada’s systems of shelters and transition houses serving women and children affected by violence.” Standing Committee on the Status of Women.
Jaffray, Brianna. 2021. “Intimate partner violence: Experiences of sexual minority women in Canada, 2018.” Juristat. Statistics Canada Catalogue no. 85-002-X.
Leclerc, Karine. 2021. Portrait of Women by the Relative Remoteness of their Communities, Series 1: Sociodemographic Profile. Statistics Canada Catalogue no. 45-20-0002.
Leclerc, Karine. 2022. Portrait of Women by the Relative Remoteness of their Communities, Series 2: Educational Attainment. Statistics Canada Catalogue no. 45-20-0002.
Mardare Amini, Mandana. 2022. Statistical Portrait of Women by the Relative Remoteness of their Communities – Series 3: Health and Well-being. Statistics Canada Catalogue no. 45-20-0002.
Matsumoto, Cai-lei, Terry O’Driscoll, Jennifer Lawrance, Andre Jakubow, Sharen Madden, and Len Kelly. 2017. "A 5 year retrospective study of emergency department use in Northwest Ontario: a measure of mental health and addictions needs." Canadian Journal of Emergency Medicine. Vol. 19, no. 5.
Maxwell, Ashely. 2020. “Shelters for victims of abuse with ties to Indigenous communities or organizations in Canada, 2017/2018.” Juristat. Statistics Canada Catalogue no. 85-002-X.
Messing, Jill Theresa and Jonel Thaller. 2015. "Intimate partner violence risk assessment: A primer for social workers." The British Journal of Social Work. Vol. 45, no. 6.
Moffitt, Pertice, Heather Fikowski, Marshirette Mauricio, and Anne Mackenzie. 2013. "Intimate partner violence in the Canadian territorial north: perspectives from a literature review and a media watch." International Journal of Circumpolar Health. Vol. 72, no. 1.
Moreau, Greg. 2019. “Canadian residential facilities for victims of abuse, 2017/2018.” Juristat. Statistics Canada Catalogue no. 85-002-X. Juristat. Statistics Canada Catalogue no. 85-002-X.
National Inquiry into Missing and Murdered Indigenous Women and Girls. 2019. Reclaiming Power and Place: The Final Report of the National Inquiry into Missing and Murdered Indigenous Women and Girls.
Pearson, Caryn, Teresa Janz and Jennifer Ali. 2013. “Mental and substance use disorders in Canada.” Health at a Glance. Statistics Canada Catalogue no. 82-624-X.
Perreault, Samuel. 2015. “Criminal victimization in Canada, 2014.” Juristat. Statistics Canada Catalogue no. 85-002-X.
Perreault, Samuel. 2019. “Police-reported crime in rural and urban areas in the Canadian provinces, 2017.” Juristat. Statistics Canada Catalogue no. 85-002-X.
Perreault, Samuel. 2020. “Gender-based violence: Sexual and physical assault in Canada’s territories, 2018.” Juristat. Statistics Canada Catalogue no. 85-002-X.
Resnick, Heidi S., Ron Acierno, and Dean G. Kilpatrick. 1997. "Health impact of interpersonal violence 2: Medical and mental health outcomes." Behavioral Medicine. Vol. 23, no. 2.
Rotenberg, Cristine. 2019. “Police-reported violent crimes against young women and girls in Canada’s Provincial North and Territories, 2017.” Juristat. Statistics Canada Catalogue no. 85-002-X.
Schiff, Jeannette Waegemakers, Rebecca Schiff, Alina Turner, and Karine Bernard. 2015. "Rural homelessness in Canada: Directions for planning and research." Journal of Rural and Community Development. Vol. 10, no. 4.
Simpson, Laura. 2018. “Violent victimization of lesbians, gays and bisexuals in Canada, 2014.” Juristat. Statistics Canada Catalogue no. 85-002-X.
Statistics Canada. 2016a. Population Centre and Rural Area Classification 2016.
Statistics Canada. 2016b. “Census metropolitan influenced zone (MIZ).” Dictionary, Census of Population, 2016.
Statistics Canada. 2021a. Custom tabulation: Data from 2016 Census of Population and Remoteness Index.
Statistics Canada. 2021b. Table 22-10-0134-01: Household Internet access by geography. DOI: https://doi.org/10.25318/2210013401-eng
Subedi, Rajendra, Shirin Roshanafshar and T. Lawson Greenberg. 2020. “Developing meaningful categories for distinguishing levels of remoteness in Canada.” Analytical studies: Methods and references. Statistics Canada catalogue no. 11-633-X.
Timko, Christine, Anne Sutkowi, Joanne Pavao, and Rachel Kimerling. 2008. "Women's childhood and adult adverse experiences, mental health, and binge drinking: The California Women's Health Survey." Substance Abuse Treatment, Prevention, and Policy. Vol. 3, no. 1.
Wilsnack, Richard W., Sharon C. Wilsnack, Gerhard Gmel, and Lori Wolfgang Kantor. 2018. "Gender differences in binge drinking: Prevalence, predictors, and consequences."Alcohol Research: Current Reviews.
World Health Organization. 2021. Violence against women prevalence estimates, 2018. ISBN 978-92-4-002225-6.
- Date modified: