
Homicide in Canada, 2020
by Amelia Armstrong and Brianna Jaffray, Canadian Centre for Justice and Community Safety Statistics
Highlights
- In the wake of the COVID-19 pandemic, physical distancing and stay-at-home orders, overall police-reported crime has decreased in 2020. In contrast, police reported 743 homicides in 2020, an increase of 56 homicides over the previous year, and the highest number since 1991. This represents a 7% increase in the homicide rate from 1.83 homicides per 100,000 population in 2019 to 1.95 in 2020, which is the highest rate since 2005.
- The increase in the national number of homicides was the result of more victims in Alberta (+39) and Nova Scotia (+29). The Nova Scotia attacks in April 2020 had a significant impact on the number of homicides in the province, accounting for 22 homicide victims.
- Toronto, Canada’s most populous census metropolitan area (CMA), had the highest number of homicides of all CMAs in 2020 with 105 victims, which was a decrease of 25 victims from 2019. Toronto had a homicide rate of 1.62 victims per 100,000 population in 2020, below the national rate of 1.95 and a 20% decrease from the previous year’s rate (2.03).
- For the fifth consecutive year, Thunder Bay CMA reported the highest homicide rate in Canada, with 6.35 homicide victims per 100,000 population.
- As a result of increases in firearm-related homicides in Nova Scotia (+22) and Alberta (+21), the national rate for firearm-related homicide increased 5% in 2020, which follows the general trend of increases seen in the rate of firearm-related homicides since 2013. On the other hand, the rate of gang-related homicides decreased 10% from 2019 to 0.39 victims per 100,000 population, the lowest rate since 2016.
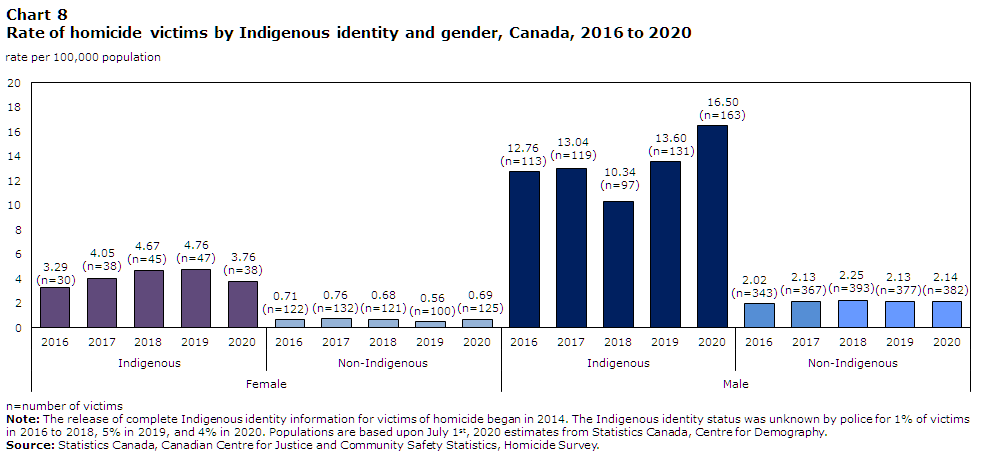
- In 2020 there were 201 Indigenous victims of homicide reported by police. Of these, 163 were men (81%) and 38 were women (19%). The number of Indigenous men who were victims increased (+32) to its highest count since 2014, when complete data on Indigenous identity first became available. In 2020, there were 9 fewer Indigenous women victims of homicide than in 2019, marking the first decrease in 4 years.
- The rate of homicide for Indigenous peoples in 2020 was almost seven times higher than the rate for non-Indigenous people (10.05 per 100,000 population for Indigenous peoples, compared with 1.41 for non-Indigenous people). The highest homicide rates were among Indigenous men, followed by Indigenous women, non-Indigenous men and the lowest homicide rates were among non-Indigenous women.
- While the number of spousal homicides decreased by 9 in 2020, Canada saw more homicides committed by other family members (+11), intimate partners (+7), acquaintances (+14), and strangers (+24). Homicides committed by those with a criminal relationship to the victim saw no changes between 2019 and 2020.
In Canada, homicides represent a fraction of the total number of police-reported violent Criminal Code offences each year.Note In 2020, 0.2% of violent crimes were considered a homicide (Moreau 2021)—that is, first degree murder, second degree murder, infanticide or manslaughter. While homicide occurs relatively infrequently in Canada, homicide rates are considered a benchmark for measuring levels of violent activity both in Canada and internationally (Ouimet and Montmagny-Grenier 2014).
Unlike other crimes, the definition of homicide tends to be fairly consistent across nations. It is also not subject to frequent change or differences in reporting behaviour when compared with other crimes and there is more international consensus on the nature and meaning of homicide than any other criminal offence. Thus, homicide is important to examine, not only because of its severity, but also because it is considered as a comparable and reliable barometer of violence in society. Further, homicide rates may influence perceptions of safety within communities (Romer et al. 2003).
Though homicide is relatively rare in Canada, rates in recent years have been higher compared to a number of other countries. According to the most recent international homicide data compiled by the United Nations Office on Drugs and Crime (UNODC 2019a), Canada’s 2018 homicide rate of 1.8 per 100,000 population was higher than the rates recorded in other G20 countries like Japan (0.3), China (0.5), Australia (0.9), and France (1.2), while it was lower than the United States (5.0), Canada’s closest geographical neighbour. The highest homicide rates among G20 countries in 2018 were in Brazil (27.4), Mexico (29.1) and South Africa (36.5), which far surpassed the rate in Canada in 2018.
Using data from Statistics Canada's Homicide Survey, this Juristat article first provides an overview of the context surrounding homicides in 2020, given the impact of the COVID-19 pandemic. This is followed by an analysis of changes in homicides in Canada over time and the characteristics of homicides committed in 2020. It presents information on the age and gender of homicide victims, the methods used to commit homicides (including the use of firearms), whether the homicide was determined to be gang-related, the relationship of the accused to the victim, as well as other characteristics of the accused. In addition, information is presented on homicide victims and accused who were identified as First Nations, Métis or Inuit.Note
The COVID-19 pandemic in relation to homicides in 2020
The COVID-19 pandemic has had profound impacts on Canadian society since it began in March 2020. Many cities enacted temporary public health measures to reduce the spread of the virus and prevent the health care systems from being overburdened, encouraging Canadians to stay home and respect the concept of “physical distancing”. As a result, especially in the first few months of the pandemic, many Canadians spent more time at home, and many businesses closed temporarily or adapted to the changing environment by offering new services. Among countless other impacts, these marked societal and economic changes have contributed to a shift in crime patterns across Canada (Moreau 2021).
There is no single determining factor that influences whether or not a homicide occurs, rather, there are a number of complex economic, societal and situational influences. Due to the complexity of this type of event, it can be difficult to determine a single motivating factor. However, in Canada, where spousal, intimate partner and family-related homicide account for over one-third of homicides each year, increased time spent in the household due to lockdowns and stay-at-home orders could lead to increased tension and strain on relationships or households already prone to violence. In addition, in a recent crowdsource survey, many respondents indicated that they had changed their alcohol and cannabis consumption habits during the pandemic, often as a result of increased stress, boredom or loneliness (Statistics Canada 2021), and alcohol and illicit drug use is a known risk factor for homicide (UNODC 2019b; Rivara 1997).
In 2020, the national crime rate decreased 10% from the previous year, and the Crime Severity Index (CSI), which measures the volume and severity of police-reported crime in Canada, decreased 8%. Both the violent and non-violent CSIs also decreased. In contrast, homicides, which have a significant influence on the overall and violent CSIs due to the severity of this crime, increased in 2020. Information on the broader social and economic impacts of the COVID-19 pandemic can be found on the “Statistics Canada’s COVID-19 hub.”
National homicide rate increases for second consecutive year; highest rate since 2005
While overall crime decreased in 2020, police reported 743 homicides, the highest number since 1991 and an increase of 56 homicides over the previous year (687 homicides in 2019) (Table 1a).Note This represented a 7% increaseNote in the homicide rate, which went from 1.83 homicides per 100,000 population in 2019 to 1.95 per 100,000 population in 2020, and was the highest national homicide rate since 2005 (Table 1b). This was the second consecutive year of increases to both the number and rate of homicides at the national level. For the fifth year in a row—since 2016—the national homicide rate was higher than the average of the previous decade (1.68 per 100,000 population for 2010 to 2019).
Despite annual fluctuations and two consecutive years of increases, the homicide rate has generally been on a downward trend in Canada since it last peaked in 1991 at 2.69 homicides per 100,000 population (Chart 1).
Chart 1 start

Data table for Chart 1
| Year | Homicide | Attempted homicide |
|---|---|---|
| rate per 100,000 population | ||
| 1971 | 1.9 | 1.5 |
| 1972 | 2.2 | 1.9 |
| 1973 | 2.1 | 2.1 |
| 1974 | 2.6 | 2.3 |
| 1975 | 3.0 | 2.8 |
| 1976 | 2.8 | 3.0 |
| 1977 | 3.0 | 2.9 |
| 1978 | 2.8 | 3.1 |
| 1979 | 2.6 | 3.1 |
| 1980 | 2.4 | 3.2 |
| 1981 | 2.6 | 3.6 |
| 1982 | 2.7 | 3.8 |
| 1983 | 2.7 | 3.5 |
| 1984 | 2.6 | 3.6 |
| 1985 | 2.7 | 3.3 |
| 1986 | 2.2 | 3.4 |
| 1987 | 2.4 | 3.5 |
| 1988 | 2.1 | 3.1 |
| 1989 | 2.4 | 3.0 |
| 1990 | 2.4 | 3.3 |
| 1991 | 2.7 | 3.7 |
| 1992 | 2.6 | 3.7 |
| 1993 | 2.2 | 3.4 |
| 1994 | 2.1 | 3.2 |
| 1995 | 2.0 | 3.2 |
| 1996 | 2.1 | 3.0 |
| 1997 | 2.0 | 2.9 |
| 1998 | 1.9 | 2.5 |
| 1999 | 1.8 | 2.3 |
| 2000 | 1.8 | 2.5 |
| 2001 | 1.8 | 2.3 |
| 2002 | 1.9 | 2.2 |
| 2003 | 1.7 | 2.2 |
| 2004 | 2.0 | 2.1 |
| 2005 | 2.1 | 2.5 |
| 2006 | 1.9 | 2.6 |
| 2007 | 1.8 | 2.4 |
| 2008 | 1.8 | 2.2 |
| 2009 | 1.8 | 2.4 |
| 2010 | 1.6 | 2.0 |
| 2011 | 1.8 | 1.9 |
| 2012 | 1.6 | 1.9 |
| 2013 | 1.5 | 1.8 |
| 2014 | 1.5 | 1.8 |
| 2015 | 1.7 | 2.2 |
| 2016 | 1.7 | 2.2 |
| 2017 | 1.8 | 2.2 |
| 2018 | 1.8 | 2.2 |
| 2019 | 1.8 | 2.3 |
| 2020 | 2.0 | 2.3 |
|
Note: Additional data are available on Statistics Canada's data table 35-10-0177-01. Populations are based upon July 1st, 2020 estimates from Statistics Canada, Centre for Demography. Excludes 329 victims killed in the Air India incident that occurred in 1985. Source: Statistics Canada, Canadian Centre for Justice and Community Safety Statistics, Homicide Survey and the Uniform Crime Reporting Survey. |
||
Chart 1 end
The increase in the national number of homicides in 2020 was driven primarily by large increases in Alberta (+39) and Nova Scotia (+29) (Table 1a).
In Alberta, there were 139 homicides in 2020, the highest number since data collection began in 1961. The homicide rate of 3.14 per 100,000 was the highest recorded since 2015 (3.21) (Table 1b), despite a decrease in the overall and violent CSI in the province (Moreau 2021). This year-over-year increase can be largely attributed to increases in the number of homicides in the census metropolitan areas (CMAs)Note of Calgary (+15) and Edmonton (+15) (Table 2).
In Nova Scotia, there were 35 homicides in 2020, which was the highest number since homicide data became available in 1961.Note In addition, Nova Scotia’s homicide rate was 3.57 per 100,000 population. The vast majority of the increase was due to an attack in April 2020 when, over the course of two days, an individual committed multiple shootings and set fires at multiple locations in Nova Scotia, killing 22 people and injuring 3 others (Slaughter and Bogart 2020). In addition, there were 4 more homicides that occurred in the CMA of Halifax.
Quebec (+10), British Columbia (+8), Saskatchewan (+5) and Northwest Territories (+4) also recorded increases in the number of homicides from 2019. These increases were only partially offset by a decline in homicides in the remaining provinces and territories, with Ontario (-19) and Manitoba (-10) recording the largest year-over-year decreases (Table 1a).
National rate and number of attempted murders decreases in 2020
The rate of attempted murder in Canada has consistently been higher than the rate of homicide since the late 1970s. Like the homicide rate, it has generally been declining, despite increases in both the number of homicides and attempted murders in recent years. In 2020, the national attempted homicide rate decreased slightly to 2.27 attempted homicides per 100,000 population from 2.33 in 2019, a decrease of 2.3%.
Nationally, Canada reported 11 fewer attempted murders in 2020 (864) than in 2019 (875). Six provinces and territories reported an increase in attempted murder in 2020, with Quebec (+46) seeing the largest year-over-year increase. News reports have identified an increase in firearm-related crime in Quebec, specifically in the Montréal CMA (MacKenzie 2021). This is supported by police services in the Montréal CMA, who reported 30 more attempted murders overall in 2020 than in 2019.
In contrast, Ontario and Saskatchewan saw the largest year-over-year decreases, each with 25 fewer attempted murders in 2020 than in 2019. Prince Edward Island was the only province or territory to report no attempted murders in 2020.
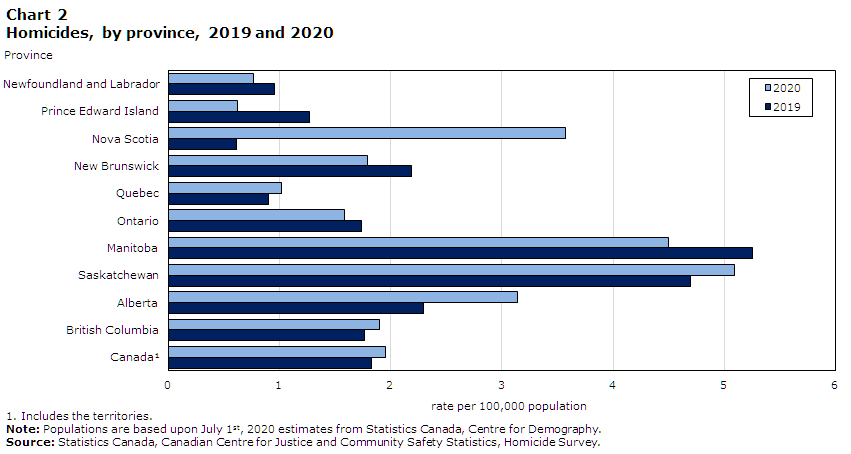
Provincial homicide rates remain highest in Saskatchewan and Manitoba
Similar to the overall crime rate, homicide rates have been historically higher in Canada’s western provinces. In 2020, Saskatchewan recorded the highest provincial homicide rate with 5.09 homicides per 100,000 population, up from 4.69 in 2019 and the highest since provincial homicide rates became available in 1961 (Chart 2, Table 1b). In 2019, Saskatchewan had the second highest homicide rate, behind Manitoba.
Chart 2 start
Data table for Chart 2
| Province | 2020 | 2019 |
|---|---|---|
| rate per 100,000 population | ||
| Newfoundland and Labrador | 0.77 | 0.96 |
| Prince Edward Island | 0.63 | 1.27 |
| Nova Scotia | 3.57 | 0.62 |
| New Brunswick | 1.79 | 2.19 |
| Quebec | 1.01 | 0.91 |
| Ontario | 1.59 | 1.74 |
| Manitoba | 4.50 | 5.26 |
| Saskatchewan | 5.09 | 4.69 |
| Alberta | 3.14 | 2.29 |
| British Columbia | 1.90 | 1.77 |
| CanadaNote 1 | 1.95 | 1.83 |
Source: Statistics Canada, Canadian Centre for Justice and Community Safety Statistics, Homicide Survey. |
||
Chart 2 end
Despite a decrease in 2020, Manitoba recorded the second highest homicide rate, at 4.50 homicides per 100,000 population, down from 5.26 in 2019. Manitoba was followed by Nova Scotia, which saw a substantial increase in their homicide rate to 3.57 per 100,000 population. As noted, this significant increase in the number of homicides and the high homicide rate can be attributed almost entirely to the Nova Scotia attacks in April 2020.
Prince Edward Island had the lowest homicide rate where at least 1 homicide occurred, at 0.63 homicides per 100,000 population, while Yukon was the only province or territory to report no homicides in 2020.
The Northwest Territories was the only territory to report an increase (+4) in homicides in 2020, with Yukon (-1) and Nunavut (-4) both reporting decreases (Table 1a).Note
Decrease in homicides in northern Canada
The number of homicides in Canada’s north,Note which includes both the provincial north and the three territories, decreased by 7 victims in 2020 (108 in 2019 to 101 in 2020). Meanwhile, the overall increase in homicides in Canada could generally be attributed to a higher number of homicides in southern Canada,Note which saw an increase of 63 homicide victims in 2020.
The majority of this increase in southern Canada came from increases in Alberta, who reported a significant rise in homicides in both Edmonton and Calgary CMAs, and Nova Scotia, who experienced an attack resulting in 22 homicide victims. In Edmonton and Calgary CMAs, these increases came largely from an increase in firearm-related homicides. Edmonton CMA saw a 97% increase in the rate of firearm-related homicidesNote in 2020 (1.09 victims per 100,000 population in 2020) compared with 2019 (0.55), while Calgary saw a 48% increase (1.17 victims per 100,000 in 2020, compared with 0.79 in 2019).
In 2020, the homicide rate for the northern regions of Canada was 2.5 times higher than the homicide rate for the southern regions (4.43 victims per 100,000 population compared with 1.80) (Chart 3).
Chart 3 start

Data table for Chart 3
| Province or territory | Southern regions | Northern regions |
|---|---|---|
| rate per 100,000 population | ||
| Newfoundland and Labrador | 0.61 | 3.61 |
| Prince Edward Island | 0.63 | Note ...: not applicable |
| Nova Scotia | 3.57 | Note ...: not applicable |
| New Brunswick | 1.79 | Note ...: not applicable |
| Quebec | 0.98 | 1.68 |
| Ontario | 1.48 | 3.44 |
| Manitoba | 3.92 | 11.77 |
| Saskatchewan | 4.70 | 17.71 |
| Alberta | 2.83 | 6.07 |
| British Columbia | 1.79 | 3.48 |
| Yukon | Note ...: not applicable | 0.00 |
| Northwest Territories | Note ...: not applicable | 13.29 |
| Nunavut | Note ...: not applicable | 7.62 |
| Canada | 1.80 | 4.43 |
|
... not applicable Note: Populations are based upon July 1st, 2020 estimates from Statistics Canada, Centre for Demography. Source: Statistics Canada, Canadian Centre for Justice and Community Safety Statistics, Homicide Survey. |
||
Chart 3 end
Number of homicides increase in more than half of census metropolitan areas
In 2020, the number of homicides increased in 20 of Canada’s 36 CMAs,Note decreased in 12 and remained unchanged in 4. The largest increases were reported in Calgary and Edmonton (both +15), while the largest decline was reported in Toronto (-25) (Table 2). Toronto, Canada’s most populous CMA, had the largest number of homicides of all CMAs, reporting 105 victims of homicide. This was the second consecutive year (130 victims in 2019) that the number of homicides decreased in Toronto after reaching a peak of 145 victims in 2018, which was the largest number of victims reported since collection of homicide data by CMA began in 1981.
The increase in homicides reported in Calgary in 2020 may be attributed to increases in the number of firearm (+6) and gang-related homicides (+3).Note There was also a substantial increase in the number of victims killed by an acquaintance (+11).
In the CMA of Edmonton, there was also a higher number of homicides involving a firearm (+8) and more gang-related homicides (+3). Similar to the Calgary CMA, Edmonton saw an increase (+4) in the number of homicides committed by an acquaintance.
In 2020, Toronto reported decreases in both the number of homicides involving a firearm (-14) and the number of gang-related homicides (-11) from the previous year.
Thunder Bay census metropolitan area reports highest homicide rate for fifth consecutive year
With 8 homicides in 2020, Thunder Bay recorded the highest homicide rate among all CMAs for the fifth consecutive year (6.35 homicides per 100,000 population)—an increase of 14% from 2019 (5.57) (Table 2). In contrast, the CMA of Toronto, which had the highest number of homicides in Canada, had a homicide rate of 1.62 per 100,000 population—lower than the national rate of 1.95 per 100,000 population and a 20% decrease from the previous year.
Barrie and Saguenay were the only two CMAs to report no homicides in 2020. Among CMAs with at least 1 homicide, the lowest rates were in Sherbrooke (0.48 victims per 100,000 population), Saint John (0.76), Québec (0.85) and Ottawa (0.90).
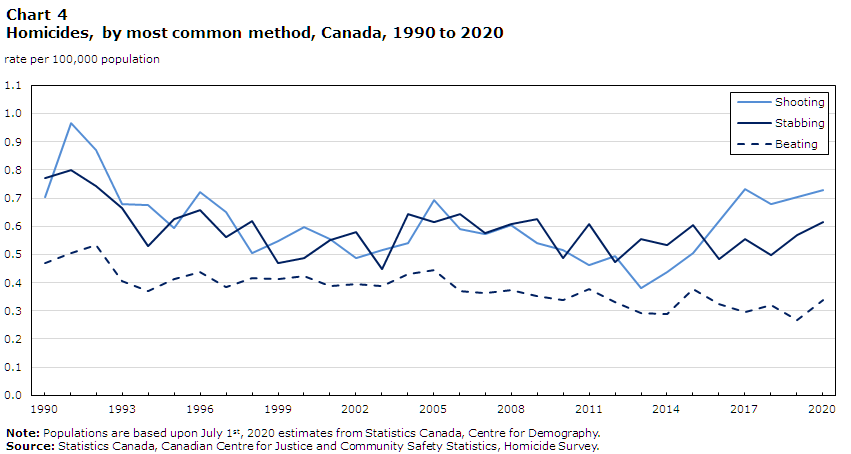
More than one in three homicides in Canada are firearm-related
Historically, shooting and stabbing have been the most common methods used to commit homicide in Canada. However, in the past five years shooting has become more common (Chart 4), accounting for 37% to 41% of all homicides where the method used to commit the homicide was known. Throughout this period, stabbings have accounted for 29% to 33%, with 2020 reporting the highest proportion. Homicides resulting from beatings rose from 15%Note in 2019 to 18%Note in 2020. On the other hand, homicides via drug overdose and smoke inhalation or burns were the only specified methods that showed a meaningful decrease from 2019 to 2020 (3% to 2% and 2% to 1%, respectively).
Chart 4 start
Data table for Chart 4
| Year | Shooting | Stabbing | Beating |
|---|---|---|---|
| rate per 100,000 population | |||
| 1990 | 0.70 | 0.77 | 0.47 |
| 1991 | 0.97 | 0.80 | 0.51 |
| 1992 | 0.87 | 0.74 | 0.53 |
| 1993 | 0.68 | 0.67 | 0.40 |
| 1994 | 0.68 | 0.53 | 0.37 |
| 1995 | 0.59 | 0.62 | 0.41 |
| 1996 | 0.72 | 0.66 | 0.44 |
| 1997 | 0.65 | 0.56 | 0.38 |
| 1998 | 0.50 | 0.62 | 0.41 |
| 1999 | 0.55 | 0.47 | 0.41 |
| 2000 | 0.60 | 0.49 | 0.42 |
| 2001 | 0.55 | 0.55 | 0.39 |
| 2002 | 0.49 | 0.58 | 0.40 |
| 2003 | 0.52 | 0.45 | 0.39 |
| 2004 | 0.54 | 0.64 | 0.43 |
| 2005 | 0.69 | 0.61 | 0.44 |
| 2006 | 0.59 | 0.64 | 0.37 |
| 2007 | 0.57 | 0.57 | 0.36 |
| 2008 | 0.60 | 0.61 | 0.37 |
| 2009 | 0.54 | 0.62 | 0.35 |
| 2010 | 0.51 | 0.49 | 0.34 |
| 2011 | 0.46 | 0.61 | 0.38 |
| 2012 | 0.49 | 0.47 | 0.33 |
| 2013 | 0.38 | 0.56 | 0.29 |
| 2014 | 0.44 | 0.53 | 0.29 |
| 2015 | 0.50 | 0.60 | 0.38 |
| 2016 | 0.62 | 0.48 | 0.32 |
| 2017 | 0.73 | 0.56 | 0.30 |
| 2018 | 0.68 | 0.50 | 0.32 |
| 2019 | 0.70 | 0.57 | 0.27 |
| 2020 | 0.73 | 0.62 | 0.34 |
|
Note: Populations are based upon July 1st, 2020 estimates from Statistics Canada, Centre for Demography. Source: Statistics Canada, Canadian Centre for Justice and Community Safety Statistics, Homicide Survey |
|||
Chart 4 end
Nationally, firearm-related homicides account for about one in five firearm-related fatalities. According to the 2019 vital statistics death database (the latest year for which figures are available), there were a total of 708 deaths in Canada from firearm-related injuries compared to 680 in 2018. Among these, 75% were suicides, 23% were homicides and 2% were classified as accidental (Statistics Canada 2020a).
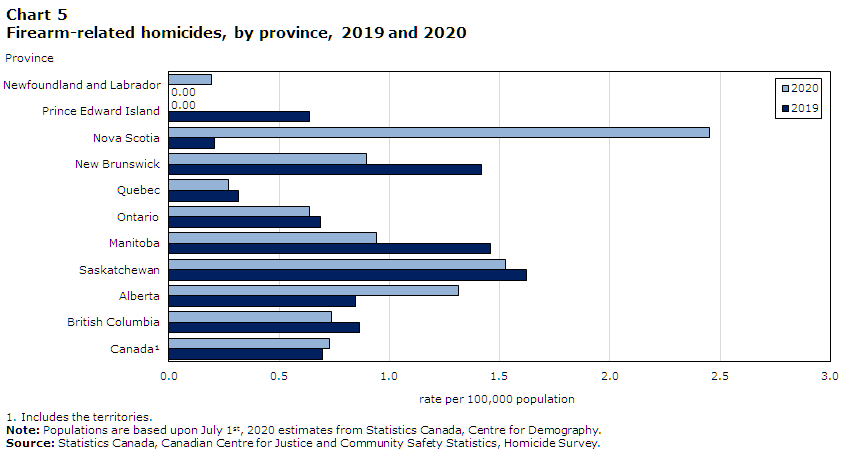
In 2020, there were 277 homicides caused by a firearm (firearm-related), 15 more than in 2019 (Table 3a).Note The firearm-related homicide rate (0.73 per 100,000 population) increased slightly from the previous year (0.70 per 100,000 population) (Chart 5). The rate of firearm-related homicides have been generally increasing over the last eight years, seeing a 91% increase from 2013 to 2020. However in 2020, 39% of firearm-related homicides were related to gang activity, the lowest proportion since 2015. Overall, in 2020, gang-related homicides committed with a firearm represented 14% of all homicides, compared to 20% the year before and 19% in 2018.
Chart 5 start
Data table for Chart 5
| Province | 2020 | 2019 |
|---|---|---|
| rate per 100,000 population | ||
| Newfoundland and Labrador | 0.19 | 0.00 |
| Prince Edward Island | 0.00 | 0.64 |
| Nova Scotia | 2.45 | 0.21 |
| New Brunswick | 0.90 | 1.42 |
| Quebec | 0.27 | 0.32 |
| Ontario | 0.64 | 0.69 |
| Manitoba | 0.94 | 1.46 |
| Saskatchewan | 1.53 | 1.62 |
| Alberta | 1.31 | 0.85 |
| British Columbia | 0.74 | 0.86 |
| CanadaNote 1 | 0.73 | 0.70 |
Source: Statistics Canada, Canadian Centre for Justice and Community Safety Statistics, Homicide Survey. |
||
Chart 5 end
The rise in total firearm-related homicides in Canada is a result of the increases in Nova Scotia (+22), and Alberta (+21). Nova Scotia’s increase was due to the 22 homicides that occurred during the Nova Scotia attacks, while increases in Alberta can mostly be attributed to more incidents occurring the CMAs.
In contrast, almost every other province saw decreases in the number of firearm-related homicides, with CMAs accounting for the overall majority of this decrease. The CMAs of Toronto (-14) and Montréal (-11) saw the largest decreases in firearm-related homicides in Canada (Table 3b).
The largest increases in firearm-related homicides among the CMAs occurred in Edmonton (+8 victims) and Calgary (+6 victims), while 13 of the 36 CMAs recorded fewer firearm-related homicides than in 2019 (Table 3b). Edmonton’s increase in firearm-related homicides resulted in a 97% increase in the rate from 0.55 per 100,000 population in 2019 to 1.09 in 2020. Among the CMAs, the highest rate of firearm-related homicides in 2020 was in Regina (1.89 per 100,000 population), followed by Saskatoon (1.76 per 100,000 population).
The CMA of Toronto, on the other hand, saw a 22% decrease in the rate of firearm-related homicides from 1.03 per 100,000 population to 0.80. However, both the CMA of Edmonton and Toronto’s rates were still slightly higher than their 10-year average (1.08 per 100,000 and 0.76 per 100,000, respectively).
Nunavut reported one firearm-related homicide in 2020, the sole territory to do so, while Prince Edward Island, Yukon, and the Northwest Territories reported none.
Handguns remain the most widely used firearm in homicides
The type of firearm used to commit homicide in Canada has changed over the past 30 years. Prior to the 1990s, rifles or shotguns were used far more frequently than handguns. However, a shift towards the use of handguns in homicides in Canada has been observed since the early 1990s (Table 4, Chart 6).
Chart 6 start

Data table for Chart 6
| Year | Rifle/shotgun | Handgun |
|---|---|---|
| percent | ||
| 1980 | 63 | 32 |
| 1981 | 63 | 30 |
| 1982 | 62 | 36 |
| 1983 | 58 | 35 |
| 1984 | 63 | 29 |
| 1985 | 63 | 33 |
| 1986 | 66 | 22 |
| 1987 | 57 | 29 |
| 1988 | 60 | 28 |
| 1989 | 62 | 25 |
| 1990 | 51 | 35 |
| 1991 | 47 | 50 |
| 1992 | 43 | 52 |
| 1993 | 47 | 47 |
| 1994 | 47 | 46 |
| 1995 | 44 | 55 |
| 1996 | 46 | 50 |
| 1997 | 45 | 52 |
| 1998 | 43 | 47 |
| 1999 | 39 | 54 |
| 2000 | 37 | 59 |
| 2001 | 31 | 65 |
| 2002 | 30 | 65 |
| 2003 | 28 | 68 |
| 2004 | 30 | 65 |
| 2005 | 31 | 58 |
| 2006 | 33 | 58 |
| 2007 | 27 | 66 |
| 2008 | 26 | 64 |
| 2009 | 26 | 62 |
| 2010 | 29 | 59 |
| 2011 | 29 | 60 |
| 2012 | 28 | 62 |
| 2013 | 28 | 67 |
| 2014 | 26 | 66 |
| 2015 | 34 | 57 |
| 2016 | 28 | 58 |
| 2017 | 33 | 55 |
| 2018 | 30 | 57 |
| 2019 | 33 | 50 |
| 2020 | 30 | 49 |
| Source: Statistics Canada, Canadian Centre for Justice and Community Safety Statistics, Homicide Survey. | ||
Chart 6 end
Handguns continued to be the most used firearm in homicides in 2020 with 49% of all firearm-related homicides being committed with a handgun. The proportion of handguns used in firearm-related homicides was higher than other types of firearms in all provinces except Saskatchewan and Alberta where a rifle or shotgun was used in 83% and 45%, respectively, of firearm-related homicides. This was also the case in Nova Scotia, where the type of firearm was unknown for two-thirds of firearm-related homicides in 2020.
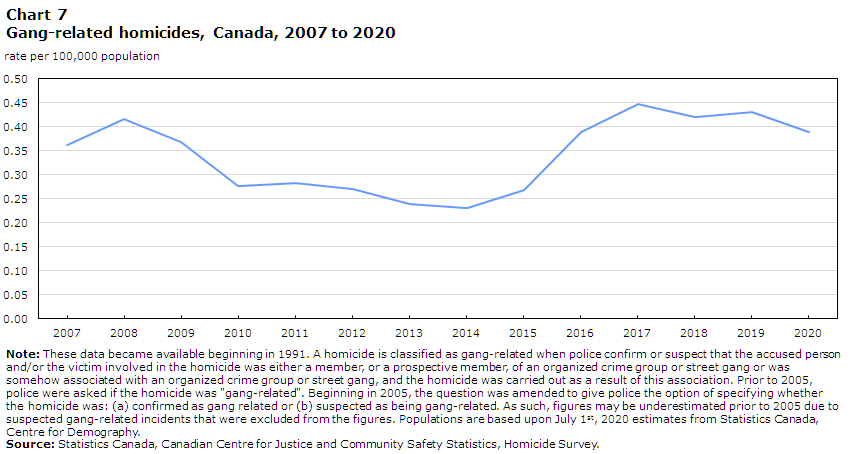
Gang-related homicides decline in 2020
There were 148 gang-related homicides in 2020, 14 fewer than in 2019.Note After three years of gang-related homicides accounting for about one-quarter, this proportion decreased to 20% in 2020. As such, the rate of gang-related homicides in 2020 (0.39 per 100,000 population) decreased 10% from the previous year. This marks the lowest rate since 2016 (Chart 7).
Chart 7 start
Data table for Chart 7
| Year | Gang-related homicides |
|---|---|
| rate per 100,000 population | |
| 2007 | 0.36 |
| 2008 | 0.42 |
| 2009 | 0.37 |
| 2010 | 0.28 |
| 2011 | 0.28 |
| 2012 | 0.27 |
| 2013 | 0.24 |
| 2014 | 0.23 |
| 2015 | 0.27 |
| 2016 | 0.39 |
| 2017 | 0.45 |
| 2018 | 0.42 |
| 2019 | 0.43 |
| 2020 | 0.39 |
|
Note: These data became available beginning in 1991. A homicide is classified as gang-related when police confirm or suspect that the accused person and/or the victim involved in the homicide was either a member, or a prospective member, of an organized crime group or street gang or was somehow associated with an organized crime group or street gang, and the homicide was carried out as a result of this association. Prior to 2005, police were asked if the homicide was "gang-related". Beginning in 2005, the question was amended to give police the option of specifying whether the homicide was: (a) confirmed as gang related or (b) suspected as being gang-related. As such, figures may be underestimated prior to 2005 due to suspected gang-related incidents that were excluded from the figures. Populations are based upon July 1st, 2020 estimates from Statistics Canada, Centre for Demography. Source: Statistics Canada, Canadian Centre for Justice and Community Safety Statistics, Homicide Survey. |
|
Chart 7 end
While gang-related homicides declined or remained the same in 7 provinces, the largest decreases were reported in Ontario (-8 homicides), Quebec (-6), and Manitoba (-6) (Table 5a). In Ontario, some of the decrease was attributable to fewer gang-related homicides in the CMA of Toronto (Table 5b). The decline in Quebec was predominantly in Montreal (-12), while Manitoba’s decrease can be attributed to Winnipeg (-4).
The number of gang-related homicides in the province of Quebec continued to decline for the second consecutive year, from 21 victims in 2019 to 15 in 2020. Ontario saw a decrease in 2020 after gang-related homicides had steadily increased over the previous 4 years.
Firearms are often involved in gang-related homicides. However, nation-wide, the proportion of these homicides declined to its lowest level since 2013, from 83% of all gang-related homicides in 2019 to 72% in 2020. The total number of gang-related homicides committed with a firearm also decreased by 20% from 2019 to 2020 at the national level.
In 2020, 84% of gang-related homicides occurred in an urban area while 16% occurred in a rural area. In comparison, 77% of non-gang related homicides happened in an urban area and 23% in a rural area. At 20 gang-related homicides, Saskatchewan had the highest percentage of gang-related homicides in a rural area (40%), Quebec, with 15 gang-related homicides, was second with 27%.
Nationally, almost 8 out of every 10 (79%) gang-related homicides were committed with a firearmNote and, of these, 63% were committed with a handgun.
Homicides involving multiple victims are relatively rare
Over the last 10 years (2011-2020), there have been 265 incidents involving more than one victim of homicide. In all, these multiple-victim incidents resulted in 602 victims. Multiple-victim incidents accounted for 5% of all homicide incidents and represented 10% of all victims in that period.
Most multi-victim incidents in the past decade were committed with a firearm—in fact, 55%Note of all multiple victim homicides were committed with a firearm, compared with 33%Note of single victim homicides. This is reflected in the major homicide events that have occurred in Canada in the last few years, including the Nova Scotia shootings in 2020,Note the shooting in Toronto on Danforth Avenue in 2018, and the mass shooting at the Islamic Cultural Centre of Québec in 2017.
Multiple and single-victim homicides also differ when it comes to the relationship of the accused to the victim. Victims of multi-victim homicides were most likely to be killed by a spouse or family member (46%), while victims of single-victim homicides were more often killed by an acquaintance (38%). About a third of multi-victim homicides were committed by acquaintances (29%). Both multiple and single-victim homicides were equally likely to involve a stranger (17% and 16%, respectively). Multiple and single-victim homicides also had similar solve rates, 79% of multi-victim homicides and 76% of single-victim homicides were solved in the last 10 years.
Start of text box 1
Text box 1
A look at solve rates from the Homicide Survey
A homicide incident is considered solved (or ‘cleared’Note ) when police either report laying or recommending a charge of homicide against at least one accused person or they report clearing a homicide by other means (e.g., the suicide of the accused person).Note Where there are multiple victims involved in a single homicide incident, the solved status of the incident applies to each victim. In incidents where there are multiple accused persons involved, a homicide is considered solved on the date when the first accused person in the case is identified by police.
Homicides may be solved months or years after they occur. The Homicide Survey collects updates for previously reported homicides to revise the solved status and to allow for the collection of additional details gathered throughout homicide investigations, if applicable. In all cases, the number of solved homicides are always reported according to the year in which they were reported by the police to the Homicide Survey (which also corresponds to the year in which the incident was deemed a homicide by the police and began being investigated as such). For instance, as of December 31, 2020, 517 of the 743 homicides that occurred in 2020 had been solved, resulting in a solve rate of 70% which is slightly lower than the rates at the end of 2018 and 2019 and lower than the average over the previous 10 years—2011 to 2020 (76%). During the 2021 data collection cycle, some of the outstanding unsolved homicides may become solved, which would then increase the solve rate for homicides reported in 2020 or any other year prior.
Over the last decade, nearly seven in ten (68%) homicides were solved within one week of the incident, while a further 26% were solved between 8 and 364 days. From 2011 to 2020, only 6% of solved homicides took one year or more to clear. Of these homicides, the median solve time was 2 days.Note
More specifically, from 2011 to 2020, 72% of homicides involving an Indigenous victim were solved within a week, which is higher than the 66% of homicides involving non-Indigenous victims. Gang-related homicides took longer to solve than non-gang-related homicides, with a median solve time of 10.5 days for gang-related homicides compared to 1 day for non-gang-related homicides, which confirms previous findings of gang-related homicides tending to be more difficult to solve (Cotter 2014; Trussler 2010).
End of text box 1
Solve rates higher for homicides involving Indigenous victims
By the end of 2020, police services had solved 79% of the 2019 homicides involving an Indigenous victim compared to 69% for non-Indigenous victims. However, this is largely reflective of solve rates involving men victims, as 81% of homicides involving Indigenous men were solved compared to 63% of homicides involving non-Indigenous men. In contrast, the solve rate for homicides with women victims was higher for non-Indigenous women: 91% compared to 77% of homicides involving Indigenous women. The relatively low solve rate for non-Indigenous men may be related to the fact that 65% of these unsolved homicides were gang-related. In contrast, 20% of the unsolved homicides involving victims who were Indigenous men were gang-related.
Rate of homicide for Indigenous peoples almost seven times higher than for non-Indigenous people
A history of colonization, including residential schools, work camps and forced relocation is identified as having profoundly impacted First Nations, Métis, and Inuit (Indigenous) communities and families (Bombay et al. 2014; Bombay et al. 2011; Bombay et al. 2009; MMIWG 2019; The Truth and Reconciliation Commission of Canada 2015). Indigenous peoples often experience social and institutional marginalization, discrimination, and various forms of trauma and violence—including intergenerational trauma and gender-based violence. As a result, many Indigenous peoples experience challenging social and economic circumstances (Arriagada et al. 2020; MMIWG 2019; Statistics Canada 2020b; The Truth and Reconciliation Commission of Canada 2015). These factors play a significant role in the overrepresentation of Indigenous people in the criminal justice system and as victims of crime (Ontario Human Rights Commission 2003; House of Commons 2018).
Indigenous peoples accounted for 5% of Canada's population in 2020, but 28% of all homicide victims. Of the 201 Indigenous victims of homicide reported by police in 2020, 163 were men (81%) and 38 were women (19%) (Table 6). The number of victims who were Indigenous men increased (+32) to its highest count since 2014 when complete data on Indigenous identity first became available. In 2020, there were 9 fewer Indigenous women who were victims of homicide than in 2019, marking the first decrease in 4 years.Note
Similar to 2019, the rate of homicide for Indigenous peoples in 2020 was seven times higher than the rate for non-Indigenous people (10.05 per 100,000 population for Indigenous peoples, compared with 1.41 for non-Indigenous people) (Chart 8, Table 6).Note The highest homicide rates were among Indigenous men, followed by Indigenous women, non-Indigenous men and the lowest homicide rates were among non-Indigenous women (Chart 8).
Chart 8 start
Data table for Chart 8
| Gender | Indigenous identity | Year | rate per 100,000 population |
number of victims |
|---|---|---|---|---|
| Female | Indigenous | 2016 | 3.29 | 30 |
| 2017 | 4.05 | 38 | ||
| 2018 | 4.67 | 45 | ||
| 2019 | 4.76 | 47 | ||
| 2020 | 3.76 | 38 | ||
| Non-Indigenous | 2016 | 0.71 | 122 | |
| 2017 | 0.76 | 132 | ||
| 2018 | 0.68 | 121 | ||
| 2019 | 0.56 | 100 | ||
| 2020 | 0.69 | 125 | ||
| Male | Indigenous | 2016 | 12.76 | 113 |
| 2017 | 13.04 | 119 | ||
| 2018 | 10.34 | 97 | ||
| 2019 | 13.60 | 131 | ||
| 2020 | 16.50 | 163 | ||
| Non-Indigenous | 2016 | 2.02 | 343 | |
| 2017 | 2.13 | 367 | ||
| 2018 | 2.25 | 393 | ||
| 2019 | 2.13 | 377 | ||
| 2020 | 2.14 | 382 | ||
|
n=number of victims Note: The release of complete Indigenous identity information for victims of homicide began in 2014. The Indigenous identity status was unknown by police for 1% of victims in 2016 to 2018, 5% in 2019, and 4% in 2020. Populations are based upon July 1st, 2020 estimates from Statistics Canada, Centre for Demography. Source: Statistics Canada, Canadian Centre for Justice and Community Safety Statistics, Homicide Survey. |
||||
Chart 8 end
The rate of homicide for Indigenous people in 2020 grew 10% from the rate in 2019 (9.17), and remained above the average rate 2014 to 2019 (8.17). This was also true for victims who were Indigenous men (16.50 per 100,000 Indigenous men in 2020; 13.60 in 2019; and 12.20 for the average between 2014 and 2019) but not for Indigenous women (3.76 per 100,000 Indigenous women in 2020; 4.76 in 2019; and 4.23 for the average between 2014 and 2019).
Among the provinces, the rate of Indigenous homicide victims was highest in Saskatchewan in 2020 (22.74 per 100,000 Indigenous population), followed by Alberta (18.29) and Manitoba (15.32) (Table 6). Overall, 59% of homicides of Indigenous victims (118 victims) occurred in rural areas outside of a CMA, and 41% occurred in a CMA (83 victims). This aligns with the proportion of the Indigenous population who live outside of a CMA—in 2020, 59% of Indigenous people in Canada lived outside of a CMA.Note
Among the homicides that occurred in a CMA, the number of Indigenous victims was greatest in Winnipeg (21 victims), followed by Edmonton (17 victims), and Saskatoon (13 victims).
Indigenous victims much younger than non-Indigenous victims
In 2020, the average age of victims was 37—slightly lower than in 2019. Over the last decade, as the average age of the population in general has increased, the average age of victims has only increased slightly from an average age of 36 in 2011 to 38 in 2019 (Statistics Canada 2020c). In fact, the average age for both men and women victims have remained fairly consistent over the last decade, although women victims have generally had a higher average age over the past 10 years than men.
Indigenous victims were generally younger than non-Indigenous victims in 2020, reflecting the fact that the Indigenous population is, on average, younger than the non-Indigenous population. While the average age for Indigenous victims was 31 years, non-Indigenous victims were, on average, 39 years of age. Even greater age differences were seen among Indigenous victims who were women. The average age for Indigenous women victims was much younger at 29 compared to 43 for non-Indigenous women. However, among men, the average age for Indigenous victims was 32 years and 38 years for non-Indigenous victims, similar to the overall age.
Victims reported as missing prior to the incident being identified as a homicide
In 2020, 40 victims of homicide were identified as missing at the time the homicide became known to police; of these, 43% (17 victims) were Indigenous. The proportion of victims reported as missing prior to the incident being identified as a homicide was higher for Indigenous victims (8%) than non-Indigenous victims (5%). This was also true for both men and women victims. Eight percent of Indigenous men victims were reported as missing before being identified as homicide victims as was the case for 4% of non-Indigenous men victims. For women, 11% of Indigenous victims were initially reported as missing compared to 7% of non-Indigenous. Missing Indigenous men victims had the highest rate per 100,000 population of victims missing at the time of the homicide in 2020 (1.32 per 100,000), followed by missing Indigenous women victims (0.40 per 100,000), victims who were non-Indigenous men (0.08 per 100,000), and victims who were non-Indigenous women (0.05 per 100,000).
Rate of Indigenous peoples accused of homicide higher than non-Indigenous accused persons
Police identified 621 accused in relation to homicides reported for 2020. The vast majority of them (93%) were cleared by charge or charges were recommended. The remaining 7% were cleared otherwise,Note most often due to the death of the accused.
In 2020, 37% of persons accused of homicide were reported by police as Indigenous, a proportion which remained unchanged from 2019 (37%). The rate of Indigenous persons accused of homicide in 2020 was nearly 11 times higher compared to non-Indigenous accused persons, a difference that has been similar in previous years (Table 6).
In 2020, the rate of Indigenous men accused of homicide (18.53 per 100,000 Indigenous men) was ten times higher than that of non-Indigenous men (1.84 per 100,000 non-Indigenous men) and over five times higher than the rate of Indigenous women accused (3.46 per 100,000 Indigenous women).
Indigenous accused peoples were younger than non-Indigenous accused in 2020. The average age for Indigenous accused persons was 27 years old compared to 34 years old for non-Indigenous persons. Statistics Canada began collecting complete data for Indigenous and non-Indigenous people in 2014. From 2014 to 2019, the average age of accused persons was 28 for Indigenous accused and 33 for non-Indigenous, meaning that the 2020 average age for both Indigenous and non-Indigenous accused was in line with the average age of the previous 6 years.
As noted since the collection of data on Indigenous identity began, Indigenous accused were as likely as non-Indigenous accused to be involved in a gang-related homicide in 2020 (15% of Indigenous accused and 15% of non-Indigenous accused).
One in four victims were reported as a visible minority
In 2019, the Homicide Survey was revised to collect, for the first time, information on whether victims and accused persons were members of population groups designated as visible minorities.
Of the 719 homicide victims for whom police reported a visible minority identity in 2020, police reported 25%, or 179 victims, as visible minorities (50% of whom were identified as Black). In 2020, victims identified as a visible minority tended to be men (89%), while 72% of non-visible minority victims were men. Visible minority victims also tended to be younger, with an average age of 32 in 2020 versus 39 for non-visible minority victims.
In 2020, homicides involving a victim who was identified as a visible minority were less likely to be solved than those involving non-visible minorities (55% versus 74%). For the solved homicides, victims who were visible minorities were most commonly killed by a stranger (34%), followed by an acquaintance (26%).Note However, almost two-thirds of victims who were identified as both women and visible minorities were killed by a spouse or family member.
Almost half of victims of homicide identified as visible minorities were reported in Ontario (88 or 49%), largely in the CMA of Toronto (66). The province of Ontario has the largest visible minority population, with 51% of people residing in the Toronto CMA designated as visible minorities, although they accounted for 69% of homicide victims there.
Similar to the proportion of victims reported as a visible minority, police reported 25% of accused persons as visible minority identity in 2020. Again, these accused were largely reported in Ontario (93 identified accused or 63%). Of the accused identified as a visible minority almost all of them were men (95%).
Start of text box 2
Text box 2
Police-reported hate motivated homicides during the COVID-19 pandemic
During the pandemic, various issues related to safety and discrimination were exposed and exacerbated in Canada, including hate crime. According to a crowdsourcing initiativeNote conducted by Statistics Canada, in the early months of the pandemic, the proportion of participants designated as visible minorities who perceived an increase in race-based harassment or attacks was three times larger than the proportion among the rest of the population (18% versus 6%) (Statistics Canada 2020d). This difference was most pronounced among Chinese (30%), Korean (27%), and Southeast Asian (19%) participants.
Hate crimes target the integral and visible parts of a person's identity and may disproportionately affect the wider community. A hate crime incident may be carried out against a person or property and may target a person’s race, colour, national or ethnic origin, religion, sexual orientation, gender identity or expression, language, sex, age, mental or physical disability, or any other similar factor. In addition, four specific offences are listed as hate propaganda or hate crimes in the Criminal Code of Canada: advocating genocide, public incitement of hatred, willful promotion of hatred and mischief motivated by hate in relation to property used by an identifiable group. Police data on hate crimes reflect only those incidents that come to the attention of police and that are subsequently classified as hate crimes.
Homicides that are hate-motivated are very rare in Canada, and make up a small proportion of the total police-reported hate crimes. In 2020, police reported 4 incidents that resulted in 6 homicide victims that were hate-motivated. This represents 0.15% of the total 2,669 hate crime incidents reported by police in 2020. The total number of police-reported hate crimes increased by 37% in 2020. Similarly, hate-motivated homicides went from 2 incidents in 2019 to 4 in 2020 (Moreau 2021). The number of homicide victims (6) in 2020 is the highest count since 2017 where 7 victims of hate-motivated homicides were reported.
Although much of the rise in total police-reported hate crimes targeted race or ethnicity, there were no homicides reported in 2020 that were motivated by hate of a race or ethnicity. Instead, the majority of the hate-motivated homicides targeted sex (67%), followed by religion (17%), and sexual orientation (17%). Since the yearly numbers of hate-related homicides are so low, they do not necessarily follow the same trends as total hate crime incidents and the motivating factors can fluctuate greatly from year to year.
In 2020, hate-motivated homicides occurred in 2 of the 13 provinces and territories, Ontario (3) and British Columbia (3). These hate-motivated homicides occurred in CMAs, namely Vancouver (3), Toronto (2), and Thunder Bay (1).
For more information on police-reported hate crime, refer to Statistics Canada data table 35-10-0066-01. A detailed analytical Juristat on police-reported hate crime in Canada for the year 2020 will be released in early 2022.
End of text box 2
Most victims knew their killer
Consistent with previous years, approximately 4 out of 5 victims of solved homicides in 2020 knew their killer. Over one-third (38%) of all homicide victims were killed by an acquaintance (i.e., non-family), and another third (31%) were killed by a family member (including 10% killed by a spouse and 20% killed by another family member), while 18% were killed by a stranger, 8% were killed by someone with whom they had a criminal relationship (e.g., drug dealers and their clients), and 5% were killed by someone with whom they had a current or former intimate relationship (Table 7).
With the exception of spousal homicides, the number of homicides for other principal types of relationships all increased or remained the same. While the number of spousal homicides decreased by 9 in 2020, Canada saw more homicides committed by other family members (+11), intimate partners (+7), acquaintances (+14), and strangers (+24). Homicides committed by those with a criminal relationship to the victim saw no changes between 2019 and 2020 (Table 7).
In 2020, the proportion of Indigenous victims killed by someone they knew (85%) was higher than non-Indigenous victims (71%) (Table 8).
According to police-reported crime statistics, women accounted for about 8 in 10 victims of intimate partner violence in 2020. The same is true with respect to homicide. In 2020, 73% of homicide victims killed by a current or previous spouse or an intimate partner were women (Table 9).Note
Start of text box 3
Text box 3
Spousal homicide amidst the COVID-19 pandemic
Since the beginning of the pandemic, many organizations have identified concerns regarding intimate partner and family violence due to stay-at-home orders and lockdown measures put in place to address COVID-19 (WAGE 2021; United Nations 2020; Vaeza 2020). During this time, many daycares and schools were closed, and parents were encouraged to work from home, resulting in families spending much more time together in their households than usual during an exceptionally stressful period. In addition, previously identified risk factors for family violence such as social isolation, reduced income and job loss were amplified amidst the pandemic, potentially leading to increased tension in the home. In fact, a representative web panel survey conducted by Statistics Canada in March 2020 found that 8% of Canadians were concerned about violence in the home during the pandemic (Statistics Canada 2020e).
According to a special study on selected police-reported crime and calls for service during the COVID-19 pandemic, during this period (March to December 2020), Canadian police services recorded a 7% increase in calls for service for domestic disturbances,Note however, the overall rate of police-reported family violenceNote remained unchanged from 2019 (Moreau 2021). Similarly, when specifically examining spousal homicides in 2020,Note at the national-level, there were 9 fewer victims than in 2019 (58 compared with 49).Note The majority of this decline was among women victims, which decreased from 45 in 2019 to 36 in 2020. This was also the case in most regions of Canada; Ontario, Saskatchewan, Alberta, and Quebec all reported decreases in the number of spousal homicides over what was seen in 2019, while British Columbia, the Atlantic regionNote and Manitoba experienced slight increases (+1, +1 and +2, respectively), and the territories were unchanged.Note
In 2020, one in ten (10%) of homicides in Canada were committed by a current or former spouse or common-law partner, and of those, more than half were motivated by an argument or quarrel (31%) or frustration, despair, or anger (29%). A further 13% of spousal homicides were motivated by jealousy or envy.Note Overall, these were consistent with the most common motives of spousal homicide from previous years.
When comparing spousal homicide at the geographical level, differences emerged between southern and northern Canada. Notably, victims in the North were more likely to be killed by a spouse (15% of all homicides) than those in the South (9%).Note Note The motivations behind these spousal homicides varied slightly between the two areas. In northern Canada, the most common motive was an argument or quarrel (45%), which represented a larger proportion of spousal homicides than at the national level (31%), followed by frustration, anger or despair (27%). This was reversed in the South, where the most common motive was frustration, anger or despair (29%), followed by an argument or quarrel (26%).
Markedly, the proportion of northern homicides in 2020 with a motive of “frustration, anger or despair” increased by 75% year-over-year. This could, at least in part, be attributed to the global COVID-19 pandemic, where stay-at-home orders encouraged Canadians to isolate from others outside of their household in order to minimize the spread of the virus. Much of northern Canada is rural, where isolation may have already been a reality and “physical distancing” guidance, combined with uncertainty and anxiety of the pandemic, could have amplified these feelings of frustration, anger and despair.
End of text box 3
A criminal history is common for both persons accused of homicide and victims
The Homicide Survey first began collecting information on the criminal history of victims and accused persons in 1997, including the most serious conviction a person might have. With the redesign of the Homicide Survey in 2019, police are now asked to report any previous convictions, allowing for a more robust and complete picture of the criminal history of victims and those accused of homicide.
In 2020, just under two-thirds (62%)Note of adults 18 years and older accused of homicide had a criminal record in Canada, whereas just under half (47%) of accused persons 12 to 17 years old had a youth record. Having a criminal record was more common among accused men—both adults and youth—than women (64% of adult men compared to 49% of adult women, and 49% of youths who were boys compared to 25% youths who were girls).
Just over half (54%)Note of adult homicide victims had a Canadian criminal record. Of the 32 youth victims aged 12 to 17 years, 22% had a youth record. Similar to the accused, having a previous criminal conviction was more common among men in all age categories than women victims (62% of adult men compared to 27% of adult women, and 27% of youths who were boys compared to 10% of youths who were girls).
Youth account for less than one in every ten persons accused of homicide
In 2020, 45 youth aged 12 to 17 years were accused of homicide, accounting for 7% of all accused. This proportion was the same as the previous year (7%) as well as the previous 10-year average (7%).Note
Youth accused of homicide in 2020 were more likely than adults to be involved in a gang-related incident (24% of youth and 14% of adult accused). These proportions were slightly higher than the 10-year average for youth (22%), but similar for adult accused (15%). This is in line with the average of the previous 10-years (2010-2019) where youths were 1.5 times more likely than an adult to be involved in a gang-related incident.
The majority of youth and adult accused were men or boys in 2020, with increases being seen in the number of boys (youth) and men (adult) from 2019. The number of adult women accused also increased in 2020, while youths who were girls remained the same. The rates per 100,000 population were higher in boys (youth) than men (adult) (3.30 per 100,000 and 3.23 per 100,000, respectively). Conversely, rates were higher for adult women at 0.49 per 100,000 than girls (youth) (0.33 per 100,000).
One in five accused persons suspected of having a mental or developmental disorder
Police suspected the presence of a mental or developmental disorderNote in 20%Note of persons accused of homicide in 2020. This proportion is slightly higher than the previous 10-year average (17%).Note Police suspected the presence of a mental disorder in women accused more frequently (25% of women accused)Note than when the accused was a man (20% of men accused).Note Over half (56%) of the solved homicides committed by someone with suspected mental or developmental disorder were committed against a spouse or family member. Moreover, homicides by someone with a suspected disorder were committed most often by persons aged 18 to 29 years (34%), followed by 30 to 39 years (27%). Accused persons suspected to have a mental or developmental disorder most often used a knife or other piercing or cutting instrument (40%) followed by a firearm (24%).Note
Summary
Despite decreases in the national Crime Severity Index and Violent Crime Severity Index in 2020, the national homicide rate increased for the second year in a row. The 743 reported homicides in Canada were the most since 1991, while the homicide rate in 2020 was the highest since 2005.
For the most part, the increase in the number of homicides was largely the result of a greater number of homicides in Alberta (+39) and Nova Scotia (+29). The Nova Scotia attacks in April 2020 had a significant impact on the homicide number and rate for Nova Scotia, accounting for 22 of the 35 homicide victims in that province. It also accounted for a large proportion of the 22 additional firearms-related homicides that occurred in Nova Scotia in 2020 and contributed to the overall increase (+15) in firearm-related homicides at the national level.
Alberta was the other main contributor to the overall increase, with an additional 39 homicides in 2020. The increase in homicides in these two provinces was partially offset by decreases in Ontario (-19) and Manitoba (-10). Among CMAs, Edmonton and Calgary (each +15 homicides) had the largest increase, while a notable decrease in the Toronto CMA (-25) was recorded.
Overall, the national rate of firearm-related homicides went up in 2020, with an increase of 5% over the 2019 rate, continuing the general trend of increases in the rate of firearm-related homicides since 2013. In contrast, the rate of gang-related homicides decreased 10% in 2020, marking the lowest rate since 2016.
As in previous years, Indigenous peoples were over-represented as both victims and persons accused of homicide. While the number of women Indigenous victims declined in 2020, there was an increase in the number of male Indigenous victims. Also consistent with previous years, the majority of victims of solved homicides knew their killer—homicides by family members, intimate partners and acquaintances increased in 2020, while the number of spousal homicides decreased.
Detailed data tables
Table 1A Number of homicides, by province and territory, 1990 to 2020
Table 1B Rate of homicides, by province and territory, 1990 to 2020
Table 2 Homicides, by census metropolitan area, 2019 and 2020
Table 3A Homicides, by firearm-related status and province or territory, 2019 and 2020
Table 3B Firearm-related homicides, by census metropolitan area, 2019 and 2020
Table 4 Firearm-related homicides, by type of firearm, Canada, 2000 to 2020
Table 5A Homicides by gang-related status and province or territory, 2019 and 2020
Table 5B Gang-related homicides, by census metropolitan area, 2019 and 2020
Table 7 Homicides, by closest accused to victim relationship, Canada, 2019 and 2020
Table 8 Homicides, by closest accused to victim relationship and Indigenous identity, Canada, 2020
Table 9 Homicides, by closest accused to victim relationship and gender, Canada, 2020
Survey description
The Homicide Survey collects police-reported data on the characteristics of all homicide incidents, victims and accused persons in Canada. The Homicide Survey began collecting information on all murders in 1961 and was expanded in 1974 to include all incidents of manslaughter and infanticide. Although details on these incidents are not available prior to 1974, counts are available from the Uniform Crime Reporting Survey (UCR) and are included in the historical aggregate totals.
Whenever a homicide becomes known to police, the investigating police service completes the survey questionnaires, which are then sent to Statistics Canada. There are cases where homicides become known to police months or years after they occurred. These incidents are counted in the year in which they become known to police (based on the report date). Information on persons accused of homicide are only available for solved incidents (i.e., where at least one accused has been identified). Accused characteristics are updated as homicide cases are solved and new information is submitted to the Homicide Survey. Information collected through the victim and incident questionnaires is also accordingly updated as a result of a case being solved. For incidents involving more than one accused, only the relationship between the victim and the closest accused is recorded.
Due to revisions to the Homicide Survey database, annual data reported by the Homicide Survey prior to 2015 may not match the annual homicide counts reported by the UCR. Data from the Homicide Survey are appended to the UCR database each year for the reporting of annual police reported crime statistics. Each reporting year, the UCR includes revised data reported by police for the previous survey year. In 2015, a review of data quality was undertaken for the Homicide Survey for all survey years from 1961 to 2014. The review included the collection of incident, victim and charged/suspect-chargeable records that were previously unreported to the Homicide Survey. In addition, the database excludes deaths, and associated accused records, which are not deemed as homicides by police any longer (i.e., occurrences of self-defence, suicide, criminal negligence causing death that had originally been deemed, but no longer considered homicides, by police). For operational reasons, these revisions were not applied to the UCR.
Defining Indigenous identity for the Homicide Survey
Indigenous identity is reported by police to the Homicide Survey and is determined through information found with the victim or accused person, such as status cards, or through information supplied by victims' or accused persons' families, the accused persons themselves, community members, or other sources (i.e., such as band records). Forensic evidence such as genetic testing results may also be an acceptable means of determining the Indigenous identity of victims.
For the purposes of the Homicide Survey, Indigenous identity includes those identified as First Nations persons (either status or non-status), Métis, Inuit, or an Indigenous identity where the Indigenous group is not known to police. Non-Indigenous identity refers to instances where the police have confirmed that a victim or accused person is not identified as an Indigenous person. Indigenous identity reported as 'unknown' by police includes instances where police are unable to determine the Indigenous identity of the victim or accused person, where Indigenous identity is not collected by the police service, or where the accused person has refused to disclose their Indigenous identity to police. The term Indigenous will be used in place of Aboriginal throughout this report.
References
Arriagada, P., T. Hahmann and V. O’Donnell. 2020. “StatCan COVID-19: Data to insights for a better Canada Indigenous people in urban areas: Vulnerabilities to the socioeconomic impacts of COVID-19.” StatCan COVID-19: Data to Insights for a Better Canada. Statistics Canada Catalogue no. 45-28-0001.
Bombay, A., K., Matherson, K. and H. Anisman. 2009. “Intergenerational trauma: Convergence of multiple processes among First Nations peoples in Canada.” Journal of Aboriginal Health. p. 6-47.
Bombay, A., K., Matherson, K. and H. Anisman. 2011. “The impact of stressors on second generation Indian residential school survivors.” Transcultural Psychiatry. Vol. 51, no. 4. p. 367-391.
Bombay, A., K., Matherson, K. and H. Anisman. 2014. “The intergenerational effects of Indian Residential Schools: Implication for the concept of historical trauma.” Transcultural Psychiatry. Vol. 51, no. 3. p. 320-338.
Cotter, A. 2014. “Homicide in Canada, 2013.” Juristat. Statistics Canada Catalogue no. 85-002-X.
Hotton Mahony, T. and Turner, J. 2012. “Police-reported clearance rates in Canada, 2010”. Juristat. Statistics Canada Catalogue no. 85-002-X.
House of Commons. 2018. “Indigenous people in the federal correctional system.” Report of the Standing Committee on Public Safety and National Security. 42nd Parliament, 1st session (June 2018).
MacKenzie, A. 2021. “Montreal mayor, police chief, announce new squad to weed out gun violence after rash of shootings.” CTV News. (accessed August 12, 2021).
Maxwell, A. 2017, “Adult criminal court statistics in Canada, 2014-2015”. Juristat. Statistics Canada Catalogue no. 85-002-X.
Moreau, G. 2021. “Police-reported crime statistics in Canada, 2020.” Juristat. Statistics Canada Catalogue no. 85-002-X.
National Inquiry into Missing and Murdered Indigenous Women and Girls (MMIWG). 2019. Reclaiming Power and Place: The Final Report on the National Inquiry into Missing and Murdered Indigenous Women and Girls. (accessed July 5, 2021).
Ontario Human Rights Commission. 2003. “The impact of racial profiling on the Aboriginal community.” Paying the Price: The Human Cost of Racial Profiling. Ontario Human Rights Commission.
Ouimet, M. and C. Montmagny-Grenier. 2014. “Homicide and violence – International and cross-national research: The construct validity of the results generated by the World Homicide Survey.” International Criminal Justice Review. Vol. 24, no. 3. p. 222-234.
Rivara, F.P., Mueller, B.A., Somes, G., Mendoza, C.T., Rushforth, N.B. and A.L. Kellerman. 1997. “Alcohol and illicit drug abuse and the risk of violent death in the home.” Journal of the American Medical Association. No. 278, vol. 7. p. 569-575.
Romer, D., Hall Jamieson, K. and S. Aday. 2003. “Television, news and the cultivation of fear of crime.” Journal of Communication. Vol. 53, no. 1. p. 88-104.
Slaughter, G. and N. Bogart. 2020. “22 people killed in Nova Scotia rampage: RCMP.” CTV News. (accessed August 3, 2021).
Statistics Canada. 2015. “Projections of the Aboriginal Population and Households in Canada, 2011 to 2036”. Statistics Canada Catalogue no. 91-552-X.
Statistics Canada. 2020a. Table 13-10-0156-01. Deaths, by cause: External causes of morbidity and mortality (V01 to Y89).
Statistics Canada. 2020b. “First Nations people, Métis and Inuit and COVID-19: Health and social characteristics.” The Daily. Statistics Canada Catalogue no. 11-001-X.
Statistics Canada. 2020c. Annual Demographic Estimates: Canada, Provinces and Territories, 2020. Statistics Canada Catalogue no. 91-215-X.
Statistics Canada. 2020d. “Perceptions of personal safety among population groups designated as visible minorities in Canada during the COVID-19 pandemic.” StatCan COVID-19: Data to Insights for a Better Canada. Statistics Canada Catalogue no. 45-28-0001.
Statistics Canada. 2020e. “Canadian perspectives survey series 1: Impacts of COVID-19”. The Daily. Statistics Canada Catalogue no. 11-001-X.
Statistics Canada. 2021. “Alcohol and cannabis use during the pandemic: Canadian Perspectives Survey Series 6.” The Daily. Statistics Canada Catalogue no. 11-001-X.
The Truth and Reconciliation Commission of Canada. 2015. Summary of the Final Report of the Truth and Reconciliation Commission of Canada. (accessed July 5, 2021).
Trussler, T. 2010. “Explaining the changing nature of homicide clearance in Canada.” International Criminal Justice Review. Vol. 20, no. 1. p. 366-383.
United Nations Office on Drugs and Crime (UNODC). 2019a. “Victims of intentional homicide 1990-2018.” Global Study on Homicide. (accessed August 8, 2021).
United Nations Office on Drugs and Crime (UNODC). 2019b. “Global study on homicide: Executive summary, 2019.” (accessed August 8, 2021).
United Nations. 2020. “The shadow pandemic: Violence against women during COVID-19.” In Focus. United Nations Women.
Vaeza, M. 2020. “Addressing the impact of the COVID-19 pandemic on violence against women and girls.” UN Chronicle. United Nations.
Women and Gender Equality Canada (WAGE). 2021. “Snapshot: COVID-19 and gender based-violence.” Gender-based Violence Knowledge Centre.
- Date modified: