
Section 2: Police-reported family violence against children and youth in Canada, 2019
Family violence against children and youth—also referred to as child maltreatment—can lead to a range of impacts on young victims, including physical injury, delayed growth and development, emotional and mental health issues, alcohol and drug use, and other risky behaviour (Public Health Agency of Canada 2014; United Nations 2006). In addition, research has shown an association between childhood maltreatment and violent victimization in adulthood—including intimate partner violence—and increased mental or psychological limitations and poor physical health (Burczycka 2017).
It is important to note that the victimization of children and youth is often difficult to detect—particularly in the context of family violence—and police-reported data are likely an underestimation of the true extent of the issue. For instance, younger victims are unique in that they may be unaware that they are being victimized, may not know how to seek help, may be unable to report their victimization and may be dependent on the perpetrator. During the COVID-19 pandemic, many children and youth have had minimal exposure to people outside the home—such as friends, teachers, doctors and counsellors—and thus violence against young victims has become more hidden. Further, as children and youth have spent more time online, the nature of their victimization might have changed.
In this section, family violence refers to violence committed by parents (biological, step, adoptive and foster), siblings (biological, step, half, adopted and foster), extended family members (e.g., grandparents, uncles, aunts, cousins and in-laws) and spouses (legally married, separated, divorced and common-law). Victims refer to those aged 17 years and younger.Note
One in three child and youth victims of police-reported violence victimized by a family member
In 2019, there were 69,691 child and youth victims of police-reported violence in Canada, and victims were more commonly girls (57%) (Table 2.1). Perpetrators of violence against children and youth were most commonly a casual acquaintance (32%), a parent (19%) or a stranger (16%).
One-third (32%) of children and youth who were victims of violence that came to the attention of police were victimized by a family member. This represented 22,299 child and youth victims of family violence and, again, a larger proportion of victims were girls (60%). Within the family, child and youth victims were most often victimized by a parent (60%) while a sibling (15%) was less common.
Younger children had the highest proportion of family violence, and this decreased with age. More than two-thirds (71%) of victims aged 5 and younger were victimized by a family member. Meanwhile, less than one-fifth (18%) of victims of violence aged 15 to 17 were victimized by a family member.
Family violence against children and youth increases for the third consecutive year
The rate of police-reported family violence against children and youth was 14% higher in 2019 compared with the previous year, and increases were similar for girls and boys (Chart 2.1).Note Since 2016, there has been a year-over-year increase in the rate of family violence against children and youth, marking a 33% increase. Between 2009 and 2019, the rate increased 15% while the rate of non-family violence against children and youth decreased 22%.
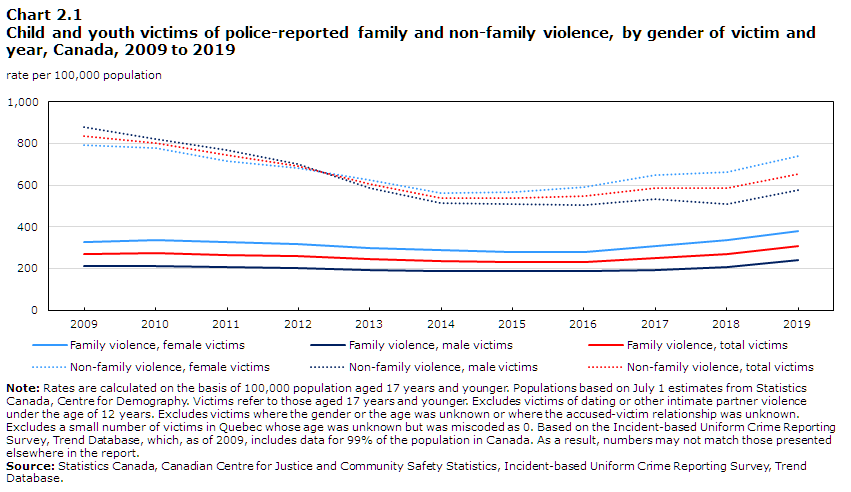
Data table for Chart 2.1
| Family violence | Non-family violence | |||||
|---|---|---|---|---|---|---|
| Female victims | Male victims | Total victims | Female victims | Male victims | Total victims | |
| rate per 100,000 population | ||||||
| 2009 | 325 | 211 | 267 | 791 | 878 | 835 |
| 2010 | 338 | 211 | 273 | 778 | 823 | 801 |
| 2011 | 326 | 209 | 266 | 716 | 768 | 743 |
| 2012 | 319 | 204 | 260 | 682 | 704 | 693 |
| 2013 | 299 | 191 | 244 | 624 | 584 | 603 |
| 2014 | 287 | 188 | 237 | 563 | 512 | 537 |
| 2015 | 279 | 185 | 231 | 567 | 509 | 538 |
| 2016 | 279 | 186 | 232 | 593 | 505 | 548 |
| 2017 | 308 | 193 | 249 | 646 | 532 | 588 |
| 2018 | 335 | 208 | 270 | 665 | 509 | 585 |
| 2019 | 379 | 239 | 308 | 739 | 575 | 655 |
|
Note: Rates are calculated on the basis of 100,000 population aged 17 years and younger. Populations based on July 1 estimates from Statistics Canada, Centre for Demography. Victims refer to those aged 17 years and younger. Excludes victims of dating or other intimate partner violence under the age of 12 years. Excludes victims where the gender or the age was unknown or where the accused-victim relationship was unknown. Excludes a small number of victims in Quebec whose age was unknown but was miscoded as 0. Based on the Incident-based Uniform Crime Reporting Survey, Trend Database, which, as of 2009, includes data for 99% of the population in Canada. As a result, numbers may not match those presented elsewhere in the report. Source: Statistics Canada, Canadian Centre for Justice and Community Safety Statistics, Incident-based Uniform Crime Reporting Survey, Trend Database. |
||||||
Physical assault most common form of family violence against children and youth
In 2019, the rate of police-reported family violence against children and youth was 311 victims per 100,000 population (Table 2.2). The most common type of family violence perpetrated against children and youth was physical assaultNote (accounting for 54% of victims, a rate of 169 per 100,000 population). While the rate of physical assault was similar for girls and boys (167 versus 171), the rate of sexual offencesNote was 4.6 times higher for girls than boys (170 versus 37).
Among child and youth victims of family violence, rates of physical assault generally increased with age. Meanwhile, rates of sexual offences peaked among girls aged 12 to 14 and boys aged 6 to 11 (275 and 50 per 100,000 population, respectively).
Three-quarters (74%) of child and youth victims of family violence were assaulted using physical force (Table 2.3).Note A further 15% of young victims of family violence were assaulted with a weapon present, such as a knife, club or firearm. More than one-third (36%) of child and youth victims of family violence suffered a physical injury.Note Among those who were physically injured, nearly all (96%) had minor injuries. Physical injury resulting from family violence was more common for boys than girls (43% versus 31%).
Start of text box 2
Text box 2
Self-reported childhood experiences of physical and sexual abuse
As mentioned, measuring violence against children and youth is challenging. Gathering information from a range of sources is critical for monitoring this issue (Public Health Agency of Canada 2019). Police-reported data are likely an underestimation of the true extent of violence against children and youth, particularly in the family context. For this reason, self-reported data offer additional insight into the nature and extent of violence against young victims and complement police-reported data.
The 2018 Survey of Safety in Public and Private Spaces included retrospective questions about experiences of childhood physical and sexual abuse.Note Just over one-quarter (27%) of Canadians experienced abuse before age 15.Note A slightly lower proportion of women than men had experienced physical abuse early in life (22% versus 25%) while the proportion that experienced sexual abuse was three times higher for women than men (12% versus 4%).
When it came to violence during childhood, 78% of victims of physical abuse and 45% of victims of sexual abuse said the most serious incident they experienced was perpetrated by a family member. Victimization by a family member was more common for female victims of physical abuse (83% versus 74% of male victims) and sexual abuse (49% versus 32% of male victims).
Of those victimized within the family context during childhood, 6% of victims said the violence they experienced came to the attention of police while another 6% said they spoke with someone from child protective services.
End of text box 2
Saskatchewan, Newfoundland and Labrador, and Manitoba have highest provincial rates of family violence against children and youth
Among the provinces, the rate of police-reported family violence against children and youth was highest in Saskatchewan (540 per 100,000 population), Newfoundland and Labrador (433) and Manitoba (414) (Table 2.4).Note Meanwhile, it was lowest in Ontario (211), Alberta (286) and British Columbia (291). Compared with the provinces, rates were notably higher in the territories, with Nunavut reporting the highest rate (1,913) followed by the Northwest Territories (1,349) and Yukon (764).
Girls experienced a higher rate of family violence than boys in every province and territory. The largest differences in the rate for girls and boys were noted in the Northwest Territories (1,953 versus 748, 2.6 times higher for girls), Yukon (999 versus 546, 1.8 times higher) and British Columbia (374 versus 213, 1.8 times higher).
In every province and territory in 2019, the rate of family violence against children and youth increased from the previous year, with the exception of Prince Edward Island (-1%).Note The largest provincial increases were noted in Newfoundland and Labrador (+46%) and British Columbia (+41%).
The rate of family violence against children and youth in the provinces was 2.0 times higher in rural areas than urban areas (522 versus 265 per 100,000 population), and this pattern was similar for girls and boys (Chart 2.2).Note In rural areas, girls had a rate of family violence that was 1.6 times higher than boys (652 versus 398). Of note, when it came to child and youth victims, the difference between rural and urban rates was larger for family violence than non-family violence (2.0 versus 1.5 times higher in rural areas).

Data table for Chart 2.2
| Family violence | Non-family violence | |||||
|---|---|---|---|---|---|---|
| Female victims | Male victims | Total victims | Female victims | Male victims | Total victims | |
| rate per 100,000 population | ||||||
| Urban area | 325 | 208 | 265 | 656 | 551 | 602 |
| Rural area | 652 | 398 | 522 | 1,146 | 692 | 914 |
|
Note: An urban area is defined as a census metropolitan area (CMA) or a census agglomeration (CA). A CMA consists of one or more neighbouring municipalities situated around a major urban core. A CMA must have a total population of at least 100,000, of which 50,000 or more live in the urban core. To be included in the CMA, adjacent municipalities must have a high degree of integration with the central urban area, as measured by commuting flows derived from census data. A CA must have a core population of at least 10,000. Rural areas are all areas outside of CMAs and CAs. Rates are calculated on the basis of 100,000 population aged 17 years and younger. Populations based on July 1 estimates from Statistics Canada, Centre for Demography. Victims refer to those aged 17 years and younger. Excludes victims of dating or other intimate partner violence under the age of 12 years. Excludes victims where the gender or the age was unknown or where the accused-victim relationship was unknown. Excludes a small number of victims in Quebec whose age was unknown but was miscoded as 0. Excludes data from the territories. Source: Statistics Canada, Canadian Centre for Justice and Community Safety Statistics, Incident-based Uniform Crime Reporting Survey. |
||||||
The rate of family violence against children and youth was 2.1 times lower in Canada’s largest cities—referred to as census metropolitan areasNote or CMAs—than it was in non-CMAs (239 versus 492) (Table 2.5).Note Among the CMAs, rates were highest in Saguenay (488), Trois-Rivières (417) and Kitchener–Cambridge–Waterloo (389). Meanwhile, rates were lowest in Guelph (106), OttawaNote (121) and Barrie (163).
Among the CMAs, the largest differences in the rate of family violence between girls and boys were noted in Thunder Bay (389 versus 111, 3.5 times higher for girls) and Kingston (274 versus 93, 2.9 times higher).
Detailed data tables
References
Burczycka, M. 2017. “Profile of Canadian adults who experienced childhood maltreatment” in Family violence in Canada: A statistical profile, 2015. Juristat. Statistics Canada Catalogue no. 85-002-X.
Public Health Agency of Canada. 2019. “A pathfinding country: Canada’s road map to end violence against children.”
Public Health Agency of Canada. 2014. Family Violence Initiative.
United Nations. 2006. “World report on violence against children.” Geneva, Switzerland: United Nations Publishing Services.
- Date modified: