
Public perceptions of the police in Canada’s provinces, 2019
by Dyna Ibrahim, Canadian Centre for Justice and Community Safety Statistics
Highlights
- In 2019, more than four in ten (41%) Canadians living in the provinces said they had a great deal of confidence in the police, while about half (49%) said they had some confidence.
- People living in census metropolitan areas (40%) were less likely than those in census agglomerations (44%) or in rural areas (45%) to report having a great deal of confidence in the police.
- Canadians who said they had a physical (38%), or mental or cognitive (33%) disability were less likely than people without a disability (43%) to report having a great deal of confidence in the police.
- Three in ten (30%) First Nations people, Métis and Inuit said they had a great deal of confidence in the police, compared with 42% of non-Indigenous people.
- Canadians belonging to population groups designated as visible minorities were significantly less likely to report having a great deal of confidence in the police (35%), compared with 44% of non-visible minorities.
- Seniors (53%) were more likely to report having a great deal of confidence in the police compared with young Canadians aged 15 to 24 (36%).
- Less than half of Canadians thought their local police were doing a good job of being approachable and easy to talk to (49%), enforcing the laws (46%), ensuring the safety of citizens (44%), treating people fairly (42%), promptly responding to calls (40%) and supplying information to the public on ways to prevent crime (37%). Less than one in five (18%) Canadians felt that the local police were doing a good job on all six of these measures.
In Canada, the police rely on continued support and cooperation from the Canadian public to efficiently and successfully carry out its duties. The public’s willingness to report crime, to cooperate with police during investigations, to call if in need of assistance and to abide by laws and police orders, are all associated with how they view the police (Brown and Benedict 2002; Cao 2014; Chow 2012; Ren et al. 2005). Positive perceptions of police among citizens are, therefore, a critical aspect of public safety and contribute to a lower level of crime.
Historically, police agencies across Canada have used various localized means to assess public confidence and opinions about the police. In order to streamline these types of measures and allow for trend and comparative analysis across time and jurisdictions, a police performance metrics framework for Canadian policing was developed in 2017 by Public Safety Canada. In addition to traditional indicators such as crime rates, calls for service and traffic offences that are typically used to measure police performance, the framework also identified trust and confidence in the police and public perceptions of the police as being critical to this end (Giacomantonio et al. 2019; Mazowita and Rotenberg 2019; Public Safety Canada 2019).
This Juristat article uses data from the 2019 General Social Survey (GSS) on Canadians’ Safety (Victimization) to examine perceptions of the police among Canadians living in the provinces. The article has two sections: confidence in the police and perceptions of police performance. Text box 1 provides information on how these two concepts were measured in the 2019 GSS on Victimization. Within each section, findings are presented for the following populations: seniors; persons with physical, and mental or cognitive disabilities; Indigenous peoples; people belonging to groups designated as visible minorities and; sexual minority persons. Information on experiences of criminal victimization are not included in this article.Note
Although the current article is largely based on data collected in 2019, some results related to perceptions of police from the 2020 crowdsourcing initiative “Impacts of COVID-19 on Canadians: Experience of Discrimination” are also presented (Text box 2). Together, the findings in this article will provide more recently available, national-level information on the perceptions Canadians have of the police—including those of people belonging to population groups designated as visible minorities (hereafter referred to as visible minorities) and Indigenous people.
Start of text box 1
Text box 1
Measures of confidence in the police and
perceptions of police performance
To measure confidence in the police, the 2019 General Social Survey (GSS) on Victimization asked respondents to indicate how much confidence they had by selecting one of the categories provided: “a great deal of confidence,” “some confidence,” “not very much confidence” or “no confidence at all.”
To measure perceptions of police performance, respondents were asked about their thoughts on whether their local police force or the RCMP detachment in their community do a good job, an average job or a poor job with respect to six elements: “enforcing the laws,” “promptly responding to calls,” “being approachable and easy to talk to,” “supplying information to the public on ways to prevent crime,” “ensuring the safety of the citizens in their area” and “treating people fairly.”
Across Canada, different communities are served by different police services including municipal stand-alone police services, First Nations self-administered police services, provincial police services, and federal policing (Conor et al. 2019). Questions in the 2019 GSS on Victimization related to confidence in police and perceptions of police performance did not specify the policing jurisdiction serving a respondent’s community. As such, this article does not include analysis based on police jurisdiction.
New means of collecting data and impact on trend analysis
In 2019, the GSS on Victimization offered, for the first time, the ability for respondents to complete the survey online. This new collection for the GSS was in recognition of the need to adapt to the changing use of technology and the ever present demands on Canadians’ time. By having telephone and self-administered internet questionnaire as modes of data collection, the 2019 GSS offered survey respondents greater flexibility and convenience in providing key and vital information to Statistics Canada.
It is important to point out, however, that changes in survey methodology can affect the comparability of data over time. It has previously been shown that certain topics are more susceptible to variations based on collection mode—and among these topics are social desirability variables such as perceptions of the police (Boivin and Lam 2016; Hennigan et al. 2002; Linchiat and Krosnick 2010). Therefore, the current article does not present any trend analysis as it is impossible to determine with certainty whether, and to what extent, differences in a variable are attributable to an actual change in the population or to changes in the survey methodology. Analysis of the impact that the mode of collection had on the results of the survey is expected to be completed at a later date.
End of text box 1
Confidence in the police
Nine in ten Canadians have confidence in the police
In 2019, nine in 10 Canadians living in the provinces said that they had a great deal or some confidence in the police (90%). More than four in ten (41%) reported having a great deal of confidence in the police, while almost half (49%) said they had some confidence in the police. Less than one in ten people (7%) said they did not have very much confidence in the police. A small minority (2%) of Canadians reported having no confidence at all in the police.Note
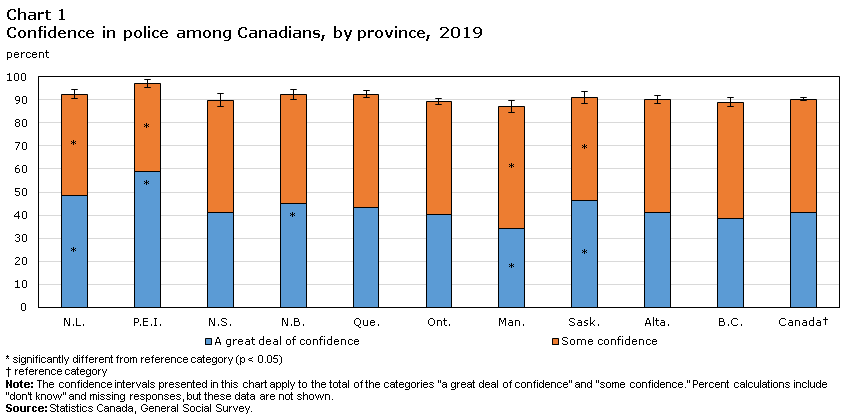
Confidence in the police varies provincially
The degree to which Canadians reported confidence in the police varied by province.Note In Newfoundland and Labrador (49%), Prince Edward Island (59%), New Brunswick (45%) and Saskatchewan (46%) the proportions of residents reporting a great deal of confidence in the police were higher compared to the national level (Chart 1).Note In Manitoba, residents were less likely to say they had a great deal of confidence in the police compared with the overall provincial proportion (34% versus 41%).
Chart 1 start
Data table for Chart 1
| Province | A great deal of confidence | Some confidence | Standard error |
|---|---|---|---|
| percent | |||
| N.L. | 49Note * | 44Note * | 1.01 |
| P.E.I. | 59Note * | 38Note * | 0.87 |
| N.S. | 41 | 49 | 1.48 |
| N.B. | 45Note * | 47 | 1.16 |
| Que. | 43 | 49 | 0.75 |
| Ont. | 40 | 49 | 0.66 |
| Man. | 34Note * | 53Note * | 1.35 |
| Sask. | 46Note * | 45Note * | 1.23 |
| Alta. | 41 | 49 | 0.87 |
| B.C. | 39 | 50 | 0.94 |
| CanadaData table Note † | 41 | 49 | 0.36 |
Source: Statistics Canada, General Social Survey. |
|||
Chart 1 end
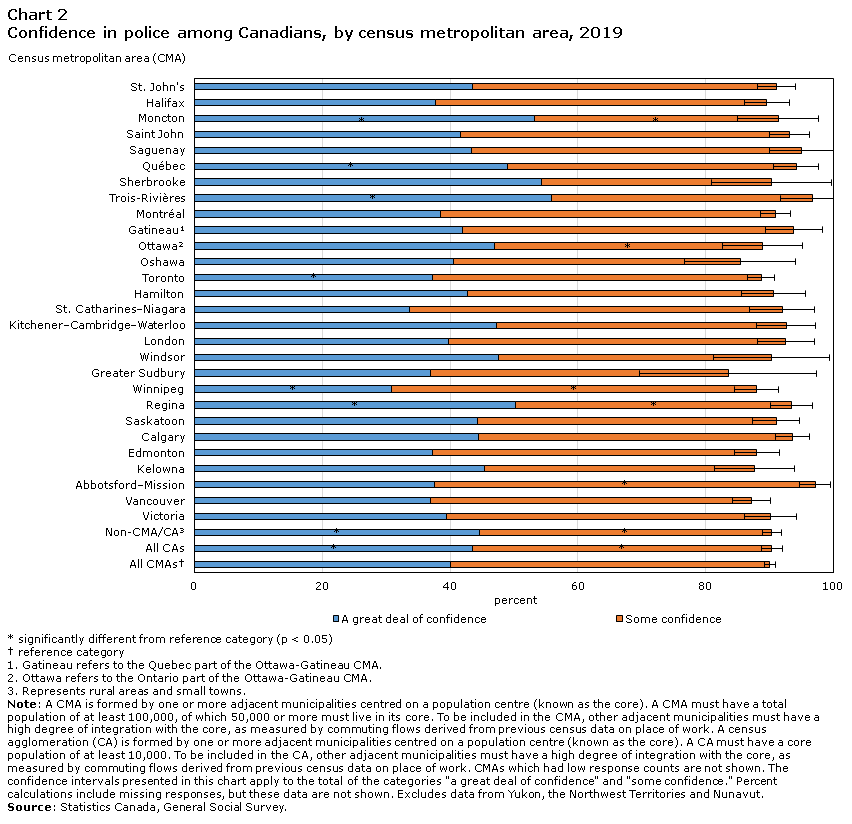
Four in ten Canadians living in census metropolitan areas (CMAs) (40%) reported a great deal of confidence in the police, a lower proportion compared with people living in census agglomerations (CAs) (44%) or in rural areas (45%) (Chart 2).Note While confidence in the police was generally high across all large Canadian cities, proportions of people reporting a great deal of confidence varied in some. For example, about half of the residents of Trois-Rivières (56%), Moncton (53%), Regina (50%) and Québec (49%) reported having a great deal of confidence in the police, while this was less often the case in Winnipeg (31%) or Toronto (37%).
Chart 2 start
Data table for Chart 2
| Census metropolitan area (CMA) | A great deal of confidence | Some confidence | Standard error |
|---|---|---|---|
| percent | |||
| St. John's | 43 | 48 | 1.52 |
| Halifax | 38 | 52 | 1.81 |
| Moncton | 53Note * | 38Note * | 3.24 |
| Saint John | 42 | 51 | 1.61 |
| Saguenay | 43 | 52 | 2.60 |
| Québec | 49Note * | 45 | 1.80 |
| Sherbrooke | 54 | 36 | 4.81 |
| Trois-Rivières | 56Note * | 41 | 2.58 |
| Montréal | 38 | 53 | 1.22 |
| GatineauData table Note 1 | 42 | 52 | 2.28 |
| OttawaData table Note 2 | 47 | 42Note * | 3.16 |
| Oshawa | 41 | 45 | 4.43 |
| Toronto | 37Note * | 51 | 1.07 |
| Hamilton | 43 | 48 | 2.54 |
| St. Catharines–Niagara | 34 | 58 | 2.59 |
| Kitchener–Cambridge–Waterloo | 47 | 45 | 2.36 |
| London | 40 | 53 | 2.27 |
| Windsor | 48 | 43 | 4.65 |
| Greater Sudbury | 37 | 47 | 7.05 |
| Winnipeg | 31Note * | 57Note * | 1.74 |
| Regina | 50Note * | 43Note * | 1.69 |
| Saskatoon | 44 | 47 | 1.87 |
| Calgary | 44 | 49 | 1.37 |
| Edmonton | 37 | 51 | 1.79 |
| Kelowna | 45 | 42 | 3.21 |
| Abbotsford–Mission | 38 | 60Note * | 1.22 |
| Vancouver | 37 | 50 | 1.54 |
| Victoria | 39 | 51 | 2.09 |
| Non-CMA/CAData table Note 3 | 45Note * | 46Note * | 0.77 |
| All CAs | 44Note * | 47Note * | 0.86 |
| All CMAsData table Note † | 40 | 50 | 0.44 |
Source: Statistics Canada, General Social Survey. |
|||
Chart 2 end
Geographical differences in confidence levels in police may be partly attributed to the demographic profiles of the respective areas. For example, according to the 2016 Census of Population, there are fewer visible minorities in Prince Edward Island and more seniors relative to the rest of Canada. On the other hand, the CMA of Winnipeg has the largest Indigenous population, and nearly half of Toronto’s population are people belonging to population groups designated as visible minorities (Statistics Canada 2017).
Recent negative encounters with police result in lower confidence
Many studies have found that confidence in and perceptions of the police are greatly affected by prior experiences with the police, and particularly whether the experience was perceived as positive or negative (Brown and Benedict 2002; Cao 2014; Chow 2012; Cotter 2015; Myhill and Beak 2008).
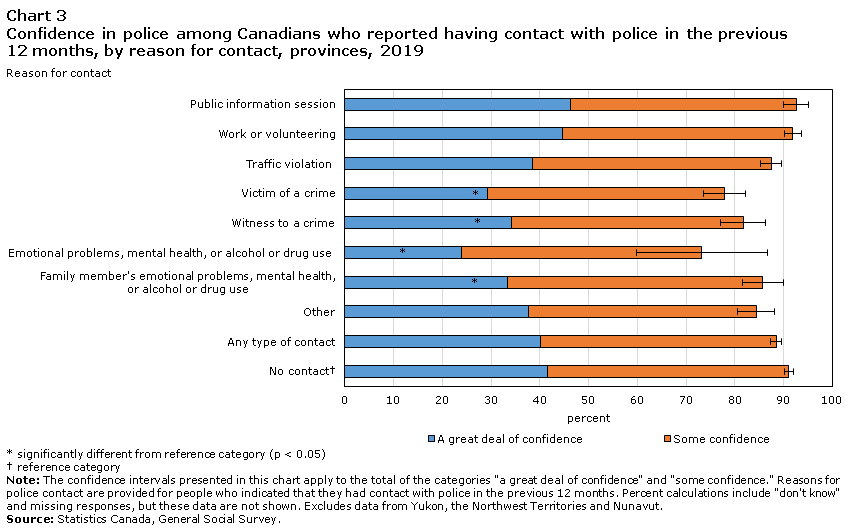
In 2019, about one in three Canadians (34%) reported having recent contact with police (in the previous 12 months). This contact could have been during work, volunteering or public information sessions, in relation to a crime—as a victim, an accused or a witness—or for other reasons such as emotional problems, mental health, or alcohol or drug use. The level of confidence in the police was high regardless of recent contact, and Canadians who reported a recent encounter with police were, generally, as likely to say that they had a great deal of confidence in the police (40%) as those who did not report a contact with police in the previous year (42%).
However, compared with individuals who did not have a recent interaction with police, confidence in the police was relatively lower among those who came into contact with the police in relation to emotional problems, mental health, or alcohol or drug use, or a crime. Specifically, about one-quarter (24%) of people who said they came into contact with the police in the previous 12 months for their own emotional problems, mental health or alcohol or drug use and one-third (33%) of those who said their recent interaction with police was related to a family member’s emotional problems, mental health or alcohol or drug use reported having a great deal of confidence in the police (Chart 3). Similarly, among victims and witnesses of crime, about one in three (29% and 34%, respectively) reported a great deal of confidence in the police.
Chart 3 start
Data table for Chart 3
| Reason for contact |
A great deal of confidence | Some confidence | Standard error |
|---|---|---|---|
| percent | |||
| Public information session | 46 | 46 | 1.27 |
| Work or volunteering | 45 | 47 | 0.90 |
| Traffic violation | 39 | 49 | 1.12 |
| Victim of a crime | 29Note * | 49 | 2.18 |
| Witness to a crime | 34Note * | 48 | 2.36 |
| Emotional problems, mental health, or alcohol or drug use | 24Note * | 49 | 6.85 |
| Family member's emotional problems, mental health, or alcohol or drug use | 33Note * | 52 | 2.15 |
| Other | 38 | 47 | 1.96 |
| Any type of contact | 40 | 48 | 0.62 |
| No contactData table Note † | 42 | 49 | 0.45 |
Source: Statistics Canada, General Social Survey. |
|||
Chart 3 end
In addition to there being some differences in the level of confidence reported based on the type of encounter that an individual had with the police, positive and negative perceptions of the encounter magnified these differences. Almost nine in ten (87%) Canadians who had contact with police in the previous year said that, overall, the interaction was positive, while 12% felt it was negative. Canadians who reported having a positive recent experience with the police were significantly more likely to have a great deal of confidence in the police compared with those who reported having a recent negative experience (44% vs. 10%). In other words, Canadians who reported a negative recent experience with the police were six times as likely to report low confidence in the police as people who said that their recent experience with police was positive (42% versus 7%).Note
Multiple logistic regression analysis confirmed the association between contact with police and confidence in the police.Note The analysis revealed that when other variables are held constant, having a recent negative encounter with police significantly increased the odds of reporting low confidence in the police (6.5 times higher odds than not having a recent contact) (Table 1). Conversely, reporting a recent positive encounter reduced the odds of reporting low confidence in the police.
Seniors most confident in police
Research shows that there are a number of factors which can have an impact on public perceptions of and confidence in the police. These factors range from demographic characteristics such as age and race, to socio-economic characteristics such as income and level of education, as well as perceptions about one’s neighbourhood circumstances and experiences of victimization (Cao 2014; Chow 2012; Gannon 2005; Payne and Gainey 2007).Note
Consistent with findings in previous research, confidence in the police was highest among seniors. While similar proportions of younger Canadians below the age of 45 said they had a great deal of confidence in the police, the share of Canadians over this age who said the same increased with every age group. Seniors 75 years and older (53%) were significantly more likely than younger Canadians to report having a great deal of confidence in the police (Table 1).Note
Confidence, generally, did not differ by gender among Canadians living in the provinces in 2019.Note Similar proportions of women (42%) and men (41%) said they had a great deal of confidence in the police.Note
After holding all variables of interest constant (all variables in Table 1), people aged 65 and older had lower odds of reporting low confidence in the police than younger people aged 15 to 24.
Canadians with disabilities less likely to report great deal of confidence in police
The Canadian Survey on Disability estimates that in 2017, about 22% of the population aged 15 and over (approximately 6.2 million people) reported having a disability (Morris et al. 2018).Note Challenges related to interactions between Canadians with a mental or cognitive disorder and police continue to be the subjects of ongoing public discussion, with more of these interactions being reported in recent years (Coleman and Cotton 2014). A 2015 article reported that about one in five people who had a recent contact with police had a mental or substance use disorder (Boyce et al. 2015).
In 2019, confidence in the police among Canadians who reported having a mental or cognitive, or physical disability was generally lower when compared to people who said they did not have a disability.Note One in three (33%) individuals reporting a mental or cognitive disability and about two in five (38%) with a physical disability said that they had a great deal of confidence in the police—proportions significantly lower than that of Canadians with no disability (43%).
Individuals who reported having a mental or cognitive disability (42%) or a physical disability (35%) were more likely to say they had had a police encounter in the previous 12 months compared with individuals with no disability (33%). Additionally, people with a mental or cognitive, or a physical disability were more likely to say their encounter was negative compared to people with no disabilities (15% each, versus 11%). Of note, about 8% of Canadians with mental or cognitive disabilities who had contact with police said they had an encounter related to their own emotional problems, mental health or alcohol or drug use.
Moreover, it has been reported that people with disabilities experience higher rates of violent victimization and a lower sense of safety than people with no disabilities, factors which may contribute to their overall lower level of confidence in the police (Cotter 2018; Perreault 2017).
When all other factors were held constant, having a mental or cognitive disability increased the odds of reporting low confidence in the police by about 50% while the odds of reporting low confidence in the police were 30% higher for people who had a physical disability than for people who did not report any disabilities. People who had both physical, and mental or cognitive disabilities had 70% higher odds of reporting low confidence in police.
Confidence in police lower among Indigenous people
In 2019, three in ten (30%) First Nations people, Métis and Inuit said that they had a great deal of confidence in the police, a proportion significantly lower compared with non-Indigenous people (42%).Note First Nations people reported the lowest level of confidence in the police with under three in ten (27%) saying they had a great deal of confidence in the police. Similarly, one in three (32%) Métis reported a great deal of confidence in the police.Note
Confidence in police reported among Indigenous people living in urban areas did not differ significantly from those living in rural areas in terms of reporting a great deal of confidence in the police (33% and 25%, respectively).Note However, Indigenous people living in urban areas were significantly less likely to report low confidence in the police (13%, compared with 23% among Indigenous people living in rural areas).
Despite the fact that contact with the police has been shown to have an impact on confidence, when all factors of interest are held constant—including any recent police encounters—Indigenous people had nearly twice the odds (1.9 times) of reporting low confidence in the police.Note Of note, while Indigenous people (44%) were more likely than non-Indigenous people (34%) to report a contact with police in the previous year, of those who had contact, similar proportions of Indigenous and non-Indigenous people said that their recent encounter with police was negative, a factor which significantly impacts confidence in the police. Indigenous people also generally reported similar reasons for coming into contact with the police.Note These findings are evidence that other factors are contributing to the lower degree of confidence in the police among Indigenous people.
The issue of poor relations between the police and Indigenous people and racialized people in Canada is well documented (Ben-Porat 2008; Brown and Benedict 2002; Chan and Mirchandani 2002; Council of Canadian Academies 2019; Jones et al. 2014; Nilson and Mantello 2019; Selkirk 2020). The relationship between Indigenous people and the police has been described as one of mistrust, a characterization that is rooted in colonialization. The Truth and Reconciliation Commission, for example, has described how the involvement of police in the residential school system has impacted Indigenous people and their trust in police (Truth and Reconciliation Commission of Canada 2015). In addition, The Final Report of the National Inquiry into Missing and Murdered Indigenous Women and Girls also presents recent evidence of how historical events and system responses to missing and murdered Indigenous women and girls directly contribute to the lack of trust in police among Indigenous people (MMIWG 2019). These reports, along with others, have shown the impact of colonialization on factors such as socio-economic inequities, trauma, mental health issues, and substance abuse which disproportionately affect Indigenous people. These factors perpetuate a cycle of contact with the police and other systems that are under scrutiny for systemic racism and systemic contact, and therefore further distrust in police (Text box 2) (Canada Parliament 2020a; Canada Parliament 2020b; Cao 2014; Chrismas 2012; Council of Canadian Academies 2019; LeBeuf 2011; Jones et al 2014; Malakieh 2019; Nilson and Mantello 2019).
Of note, despite reporting a lower level of confidence in the police, Indigenous people have reported greater feelings of safety in their neighbourhood than non-Indigenous people—a finding that may be attributable to strong community ties (Perreault 2017).
Visible minorities report less confidence in the police
In 2019, 87% of people designated as visible minorities reported having a great deal or some confidence in the police, this was slightly lower than the 92% among non-visible minorities.Note The proportion of visible minority Canadians who said that they had a great deal of confidence in the police was nine percentage points lower than for non-visible minorities (35% versus 44%). Southeast Asian (25%) and Chinese (26%) Canadians, in particular, were significantly less likely to report having a great deal of confidence in the police. While Black and Latin American people were as likely as non-visible minority people to say they had a great deal of confidence in the police, nearly one in five (18% and 17%, respectively) reported having not very much or no confidence in the police—more than double the proportion among non-visible minorities (8%).
It is worth noting that while visible minorities were less likely to report a contact with police in the previous year (29%, versus 36% among non-visible minorities), 16% of visible minorities who reported a recent police encounter said that their experiences were negative, a proportion higher than that of non-visible minorities (10%). When all other factors are kept constant, visible minorities were found to have 50% greater odds of reporting low confidence in the police than non-visible minorities. Overall, 13% of visible minorities reported low confidence in the police, compared with 8% of non-visible minorities.
Experiences and perceptions of systemic racism in policing and acts of racial prejudice by officers are likely factors contributing to the overall lower sense of confidence in the police within this segment of the population (British Columbia 2020; Canada Parliament 2020b; Stelkia 2020; Weitzer and Tuch 2005). Visible minorities are more likely to report experiencing discrimination when dealing with the police (Text box 2). According to the 2019 GSS on Victimization, 2% of visible minority Canadians reported experiencing some form of discrimination in the previous five years while dealing with police, compared with 0.6% of non-visible minority Canadians. The underrepresentation of visible minorities in police agencies has also been shown to have an impact on perceptions of police among visible minorities (Chow 2012). In 2018, visible minorities made up 22% of the Canadian population but 8% of police officers in Canada that year (Conor et al. 2019). Moreover, visible minorities are more likely to live in larger cities and are overrepresented in low-income neighbourhoods, and although they experience victimization at a lower rate than non-visible minorities they are less likely to feel safe in their neighbourhoods—factors found to be negatively correlated with perceptions of police (Chow 2012; Perreault 2017; Simpson 2018a).
Start of text box 2
Text box 2
Trust in police, August 2020
During the summer of 2020, many discussions around issues of systemic racism within policing emerged in Canada in light of some high profile incidents of police misconduct (British Columbia 2020; Canada Parliament 2020a; Canada Parliament 2020b). Such highly publicized incidents have been seen to negatively impact public perceptions of the police (Weitzer 2002; Weitzer and Tuch 2005). Many Canadians took to the streets in protest to express their frustrations with police misconduct that target Indigenous, Black and other racialized people. Further, the onset of the COVID-19 pandemic earlier in the year led to some rules and restrictions being put in place to combat the spread of this disease, impacting Canadians’ daily lives. There have been indications of a disproportionate impact of these new rules and their enforcement measures on specific communities, including Indigenous, Black and other racialized and disadvantaged groups (Deshman et al. 2020). These rules have also been found to have some negative impact on Canadians’ perceptions about crime in their neighbourhoods and feelings of safety, particularly among Indigenous people (Arriagada et al. 2020)—both of these factors have been shown to contribute to one’s perceptions of the police.
Therefore, although the focus of the current article is to examine data collected in the 2019 General Social Survey (GSS) on Victimization, in an effort to shed some light on even more recent attitudes towards police and any indications of changes in perceptions—particularly among Indigenous people and visible minorities—this text box uses data from the crowdsourcing initiative Impacts of COVID-19 on Canadians: Experience of Discrimination. This data collection was conducted in August 2020 and collected information on perceived experiences of discrimination during the COVID-19 pandemic, which included questions about perceptions of the police and other justice and public institutions. It is important to note, however, that crowdsourcing does not have a probabilistic sampling design and as such, the information presents the opinions of the participants only and cannot be generalized to the overall Canadian population. Moreover, the crowdsourcing questionnaire collected information on level of trust, and provided response categories that were different from the GSS on Victimization. Therefore, no direct comparisons should be made between the two data sources, and for this reason, results presented in this text box focus on participants who reported having low trust and GSS data are not included in this textbox.
Over 36,000 people in Canada took part in the crowdsourcing initiative. Among them, 23% reported having low trust in the police.Note This proportion was the same for distrust in the court system and local governments, but higher than what was reported for federal government (21%), school system (20%), public health agencies (13%) health care system (13%), and local merchants or business people (9%). Other institutions that received a higher level of distrust than police included major corporations, provincial or territorial governments, by-law officers, banks and Canadian media. In comparison, a similar 2015 study previously found that Canadians had much higher levels of confidence in the police than they had for the school system, courts and federal parliament, among others (Cotter 2015).
Participants who identified as members of some population groups were particularly more likely to express distrust in the police. For example, four in ten (40%) participants identifying as Indigenous expressed a distrust in police compared with 19% of non-Indigenous and non-visible minority participants.Note Similarly, about three in ten (31%) participants who identified as belonging to population groups designated as visible minorities expressed distrust in police. Distrust in police was particularly high among Black participants (52%) and people who identified as belonging to multiple visible minority groups (44%).
When asked about experiences of discrimination or unfair treatment by others since the beginning of the COVID-19 pandemic, 2% of all participants reported such experiences while interacting with the police. While less than 1% of non-Indigenous and non-visible minority participants said they had experienced discrimination while interacting with the police since the pandemic began, notably larger proportions of Black (8%), multiple visible minority (7%), Indigenous (6%) and Latin American (6%) participants said the same. The vast majority of participants who reported experiencing discrimination or unfair treatment while dealing with the police also reported having low trust in the police (82%).
For more results from this crowdsourcing initiative, see Statistics Canada 2020.
End of text box 2
Lesbian, gay and bisexual Canadians report moderate confidence in the police
Sexual minority Canadians (namely those who self-identified as lesbian, gay, bisexual or otherwise not heterosexual), overall, had feelings of confidence in the police that were similar to heterosexual Canadians, however the degree of confidence reported differed.Note For example, lesbian or gay Canadians (31%) and bisexual Canadians (25%) were significantly less likely to report having a great deal of confidence in the police, compared with heterosexual Canadians (42%).
Overall, similar proportions of sexual minority Canadians and heterosexual Canadians reported having contact with police in the previous year, and perceptions about recent encounters with police among sexual minorities were similar to those reported among heterosexual Canadians.
Sexual minorities in Canada report experiencing higher victimization rates, poorer mental health and struggle with fears of stigmatization and discrimination when having to interact with police compared with heterosexual Canadians (Jaffray 2020; Nadal 2015; Simpson 2018b). Feelings of safety are also lower among lesbian, gay and bisexual Canadians compared with heterosexual people (Perreault 2017). These factors are potential contributors to a reduced sense of confidence in the police among this segment of the population. When other factors of interest are held constant, being lesbian, gay or bisexual did not impact the odds of reporting lower confidence in the police.
Start of text box 3
Text box 3
Confidence in Canadian criminal courts
The 2019 General Social Survey on Victimization asked Canadians about their confidence in the Canadian criminal courts. Consistent with previous findings (Cotter 2015), confidence in Canada’s criminal courts was generally lower than that in police. While 41% of Canadians said that they had a great deal of confidence in the police, one in seven (14%) Canadians said they had a great deal of confidence in the criminal courts.
About one in five (20%) Canadians reported having ever come into contact with the Canadian criminal courts. People with prior contact with the criminal courts were as likely as those with none to report having some or a great deal of confidence in the courts. However, people who reported having contact with the criminal courts were more likely to say that they do not have very much confidence in the courts (24%) or no confidence at all (11%) compared to Canadians with no previous contact (13% and 3%, respectively).
About 18% of Canadians said they did not know how much confidence they had in the Canadian criminal courts. This answer category was more common among people who said they never had contact with the criminal courts (data not shown).
Although women were as likely as men to report confidence in the police, this was not the case for confidence in the criminal courts: 12% of women said they had a great deal of confidence in criminal courts compared with 15% of men. Reporting a great deal of confidence in the Canadian criminal courts was also less common among: common law and divorced people, non-visible minorities, non-immigrants, people with disabilities (mental or cognitive, and physical), bisexual people, people with no university diploma, and people with no religion.Note
Confidence levels in Canada’s criminal courts were similar across most provinces, with the exception of in Manitoba (9%) and Alberta (11%) where residents were less likely to say they had a great deal of confidence when compared with the national level.
End of text box 3
Perceptions of police performance
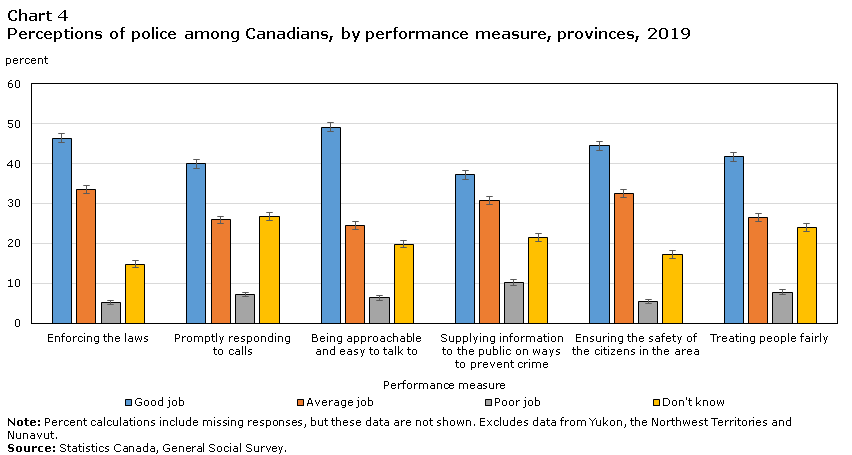
Less than half of Canadians think their local police are doing a good job
Across all six police performance measures included in the GSS on Victimization (see Text box 1), less than half of Canadians reported that their local police were doing a good job. In 2019, overall, the beliefs that the police were doing a good job of being approachable and easy to talk to (49%) and enforcing the laws (46%) were rated slightly more favourably among Canadians, followed by the police ensuring the safety of citizens (44%) and treating people fairly (42%) (Chart 4, Table 2). About four in ten said the same about the police promptly responding to calls (40%) and supplying information to the public on ways to prevent crime (37%). About one in five Canadians (18%) felt that the police were doing a good job on all six measures.
Chart 4 start
Data table for Chart 4
| Performance measure | Enforcing the laws | Promptly responding to calls | Being approachable and easy to talk to | Supplying information to the public on ways to prevent crime | Ensuring the safety of the citizens in the area | Treating people fairly |
|---|---|---|---|---|---|---|
| percent | ||||||
| Good job | 46 | 40 | 49 | 37 | 44 | 42 |
| Average job | 33 | 26 | 24 | 31 | 33 | 26 |
| Poor job | 5 | 7 | 6 | 10 | 6 | 8 |
| Don't know | 15 | 27 | 20 | 22 | 17 | 24 |
| Standard error | ||||||
| Good job | 0.59 | 0.56 | 0.57 | 0.58 | 0.56 | 0.56 |
| Average job | 0.54 | 0.45 | 0.51 | 0.52 | 0.52 | 0.52 |
| Poor job | 0.25 | 0.29 | 0.29 | 0.36 | 0.23 | 0.32 |
| Don't know | 0.42 | 0.52 | 0.46 | 0.49 | 0.46 | 0.52 |
|
Note: Percent calculations include missing responses, but these data are not shown. Excludes data from Yukon, the Northwest Territories and Nunavut. Source: Statistics Canada, General Social Survey. |
||||||
Chart 4 end
The proportion of Canadians who said their local police were doing an average job ranged between 24% and 33% across all six measures. One in ten people, or less, said the police were doing a poor job.
Perceptions about police performance linked to perceptions about recent encounters
Canadians who had a recent encounter with the police were as likely as those who did not to say that the police were doing a good job for five out of the six measures. The sole exception among the measures was that Canadians who reported a contact with the police in the previous 12 months were more likely to say that the police were doing a good job of being approachable and easy to talk to compared with those who did not report a recent police encounter (53% versus 47%).
Perceptions of police performance sometimes differed among Canadians based on the type of encounter reported. For example, Canadians who reported coming into contact with the police in the previous year because of a public information session were more likely to say that the police were doing a good job of being approachable and easy to talk to (63%) and supplying information on how to prevent crime (51%), compared to people who did not come into contact with the police in the last year for any reason (Table 3). In contrast, Canadians who were victims of crime in the last year were less likely to say the police were doing a good job of enforcing the laws (32%).
Moreover, among Canadians who reported a recent police encounter, their perceptions of police performance appeared to be associated with their opinion of how the encounter went—whether positively or negatively. Unsurprisingly, people who said they had a recent negative experience with the police were significantly less likely to say the police were doing a good job on any of the measures compared to people with recent positive experiences, and, vice versa, people with a recent positive encounter were more likely to say the police were doing a good job. To once again use the example of perceptions related to enforcing the laws, 15% of Canadians who had a recent negative encounter with the police said that the police were doing a good job, and 25% said they were doing a poor job. In comparison, 50% of people who said their recent experience with the police was positive said the police were doing a good job, while 5% said they were doing a poor job.
It is worth noting that in 2019, between 15% and 27% of people said they did not know if their local police were doing a good job on at least one of the measures. This was more common among people who reported not having any contact with the police in the previous year.Note
Perceptions of police performance generally similar by gender, differ by age group and sexual orientation
Perceptions of police performance generally varied across different age groups. However, overall, older Canadians had more positive views than younger Canadians. For example, Canadian seniors (those aged 75 and older) were more likely than Canadians aged 15 to 24, to say that their local police do a good job an all of the measures except of promptly responding to calls, for which they were as likely to say the police were doing a good job (Table 2).
When comparing by gender, men and women reported similar opinions when it came to perceptions of police performance, with under half saying that the police do a good job on each of the measures.Note The sole exception was in relation to treating people fairly which was rated slightly less favourably among women (40% versus 43%).
Canadians who reported being bisexual were far less likely than heterosexual Canadians to say that the police were doing a good job on three of the measures. Namely, around one in three or fewer bisexual people said that the police were doing a good job enforcing the laws (25%), being approachable and easy to talk to (34%), and ensuring the safety of citizens (33%), which compares with 47%, 50% and 45%, respectively, among heterosexual people.
People with disabilities less likely to say police are doing a good job
People reporting a disability were generally less satisfied with police performance. Canadians who reported a mental or cognitive disability were less likely than people without disabilities to say the police were doing a good job on all of the measures, namely, of enforcing the laws (39% versus 48%), promptly responding to calls (37% versus 41%), being approachable and easy to talk to (43% versus 50%), supplying the public with information to prevent crime (33% versus 38%), ensuring the safety of citizens (38% versus 46%) and treating people fairly (36% versus 43%). Similarly, compared to people with no disabilities, people with a physical disability less often said they thought the police were doing a good job on four of the measures: enforcing the laws (44%), promptly responding to calls (38%), ensuring the safety of citizens (41%) and treating people fairly (40%).
Perceptions of police performance generally similar among Indigenous and non-Indigenous people
In 2019, Indigenous people generally had perceptions of police performance that were similar to non-Indigenous people. The sole exception was in relation to enforcing the laws, which was driven by a less positive perception among First Nations people. First Nations people were significantly less likely to say that the police were doing a good job of enforcing the laws compared with non-Indigenous people (36% and 47%, respectively). Métis reported similar levels of satisfaction with police performance on all of the six measures when compared to non-Indigenous people.Note
Overall in the provinces, perceptions of police performance among Indigenous people were similar regardless of whether they lived in urban or rural areas.
Perceptions of police performance vary among visible minority groups
Overall, Canadians who identified as belonging to a group designated as visible minority were significantly less likely than non-visible minorities to say the police were doing a good job on five of the six elements measured, except when it came to promptly responding to calls, for which similar proportions said the police were doing a good job. Differences, however, varied among Canada’s largest ethnic groups. For example, Chinese Canadians were less likely to say the police were doing a good job on all six measures, while Latin Americans (37%) and Southeast Asians (35%) were less likely to say the police were doing a good job of enforcing the laws compared with non-visible minorities (49%). With the exception of Latin Americans, Filipino and Arab Canadians who had similar views as non-visible minorities, all of the remaining ethnic groups reported lower levels of satisfaction with police performance related to treating people fairly. Overall, about one in three (34%) visible minority Canadians said the police were doing a good job of treating people fairly, compared with 45% of non-visible minorities.
It is worth noting that between 20% and 30% of visible minorities reported that they did not know if the police were doing a good, average or poor job.
Established immigrants rate police performance less favourably
Immigrants were less likely than non-immigrants to say that the police were doing a good job on two out of the six measures: being approachable and easy to talk to (46% versus 50%) and treating people fairly (38% versus 43%). Immigrants who had been in Canada longer than ten years generally had less positive views compared with non-immigrants. On five out of the six measures, these established immigrants were less likely than non-immigrants to say that the police were doing a good job—with the exception being when it came to promptly responding to calls, for which they held similar views.
Recent immigrants, on the other hand, generally had the same or more positive opinions about police performance when compared to non-immigrants. When it came to promptly responding to calls (47%) and ensuring the safety of the citizens in the area (51%), recent immigrants were more likely to say that the police do a good job compared with non-immigrants (39% and 45%, respectively).
Between 19% and 29% of immigrants reported that they did not know if the police were doing a good, average or poor job on each of the six performance measures included. These proportions were generally similar among recent and established immigrants.
Start of text box 4
Text box 4
Canadians’ perceptions of the criminal justice
system
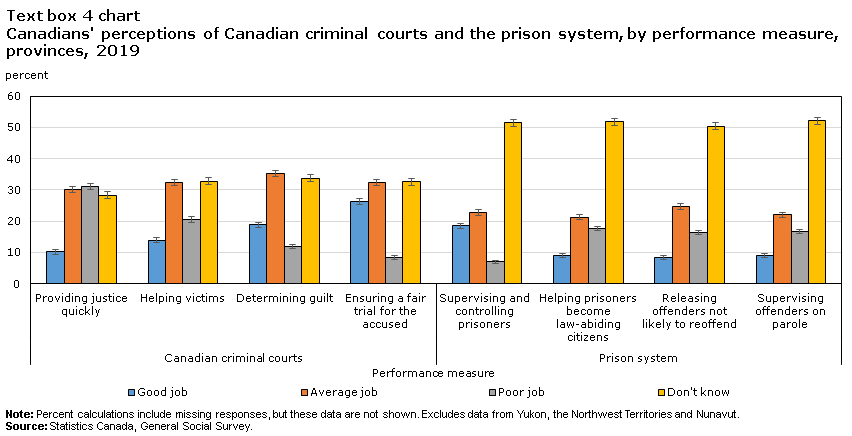
In addition to questions on the perceptions of local police, the 2019 General Social Survey (GSS) on Victimization also asked questions regarding Canadians’ perceptions of other aspects of the Canadian justice system, namely, criminal courts and prisons. With regards to criminal courts, the GSS asked respondents if they thought the Canadian criminal courts were doing a good job, an average job or a poor job of providing justice quickly, helping victims, determining guilt and ensuring a fair trial for the accused. Similarly, respondents were asked if they thought that the prison system does a good job, an average job or a poor job of supervising and controlling prisoners while in prison, helping prisoners become law-abiding citizens, releasing offenders who are not likely to commit another crime and supervising offenders on parole.
Perceptions about the criminal courts and prisons were generally less positive compared to perceptions related to police performance. Among the measures of performance of the criminal courts, Canadians were least likely to say the criminal courts were doing a good job of providing justice quickly (10%) or helping victims (14%) (Text box 3 chart). Instead, about one in three (31%) and one in five (21%) Canadians thought the criminal courts were doing a poor job on these two measures, respectively. Canadians were slightly more likely to say the criminal courts were doing a good job of ensuring a fair trial (26%) and determining guilt (19%).
Text box 4 chart start
Data table for Text box 4 chart
| Performance measure |
Canadian criminal courts | Prison system | ||||||
|---|---|---|---|---|---|---|---|---|
| Providing justice quickly | Helping victims | Determining guilt | Ensuring a fair trial for the accused | Supervising and controlling prisoners | Helping prisoners become law-abiding citizens | Releasing offenders not likely to reoffend | Supervising offenders on parole | |
| Good job | 10 | 14 | 19 | 26 | 18 | 9 | 8 | 9 |
| Average job | 30 | 32 | 35 | 32 | 23 | 21 | 25 | 22 |
| Poor job | 31 | 21 | 12 | 8 | 7 | 18 | 16 | 17 |
| Don't know | 28 | 33 | 34 | 33 | 52 | 52 | 50 | 52 |
| Standard error | ||||||||
| Good job | 0.39 | 0.43 | 0.45 | 0.53 | 0.47 | 0.34 | 0.32 | 0.35 |
| Average job | 0.53 | 0.53 | 0.53 | 0.54 | 0.46 | 0.47 | 0.47 | 0.47 |
| Poor job | 0.50 | 0.44 | 0.36 | 0.32 | 0.27 | 0.40 | 0.37 | 0.39 |
| Don't know | 0.52 | 0.54 | 0.55 | 0.55 | 0.57 | 0.56 | 0.58 | 0.57 |
|
Note: Percent calculations include missing responses, but these data are not shown. Excludes data from Yukon, the Northwest Territories and Nunavut. Source: Statistics Canada, General Social Survey. |
||||||||
Text box 4 chart end
Canadians were even less positive about their perceptions of Canadian prisons. About one in five (18%) said they believed prisons are doing a good job of supervising and controlling prisoners while in prison, and about one in ten said the same about helping prisoners become law-abiding citizens, releasing offenders, and supervising offenders on parole.
Notably, about one in three Canadians said they did not know if the criminal courts were doing a good, average or poor job, while around half said the same about prisons.
End of text box 4
Residents of Ontario report lower levels of satisfaction with police performance, more satisfaction with police in Prince Edward Island
In 2019, there were many provincial variations in Canadians’ level of satisfaction with police performance. Prince Edward Island was the only province to report higher levels of satisfaction with police performance on all six measures compared with the Canadian provincial average. Quebec residents rated their local police more favourably on five out of the six measures (all except for being approachable and easy to talk to) (Table 4). In contrast, compared with all of the provinces, people living in Ontario were less likely to say their local police were doing a good job on any of the six measures.
Perceptions about police performance also differed regionally, with people living in census agglomerations and rural areas having more positive perceptions on all of the measures compared with people living in CMAs (Table 5). Perceptions of police also differed among CMAs in a variety of ways ranging from some cities reporting higher levels of satisfaction in police performance for most of the measures to others reporting satisfaction with police for some measures but not others. For example, Canadians living in Québec, Trois-Rivières and Sherbrooke were more likely to report that their local police do a good job on five of the six measures when compared to the overall CMA averages, while lower proportions of people in Toronto and Winnipeg said the police were doing a good job on five out of the six measures.
Similar to what was previously noted about confidence in the police, provincial and regional differences in perceptions of police among residents may be partly attributed to the demographic profiles of these areas.
Summary
The vast majority of Canadians reported having confidence in the police in 2019, reporting either a great deal (41%) or some confidence (49%).
Prior negative encounters with police was the most influential factor in predicting reported confidence levels (among the factors included in the article). People who said they had a negative encounter with the police in the previous year had odds almost seven times higher of reporting low confidence in the police. Other factors which negatively impacted Canadians’ confidence levels in police included: identifying as a visible minority, an Indigenous person, or a person with a disability. On the other hand, being 65 or older reduced the odds of reporting low confidence in the police.
Between 37% and 49% of Canadians in 2019 felt that the police were doing a good job on the performance measures included. Namely, enforcing the laws; promptly responding to calls; being approachable and easy to talk to; supplying information to the public on ways to prevent crime; ensuring the safety of the citizens in their area; and treating people fairly.
Similar to confidence in police, perceptions of police performance were linked to opinions formed by prior experiences with police. For example, Canadians who reported a negative police encounter in the previous 12 months were significantly less likely to say the police were doing a good job on any of the measure compared with people with no recent police contact, while more favourable views were more common among people with recent positive encounters.
As was the case with confidence in police, some sub-populations also held more positive perceptions of police. Specifically, people aged 45 and older generally had more positive views about police performance compared with those aged 15 to 24, while visible minorities, and people with disabilities generally had less positive views. Dissimilar to findings related to confidence in the police, Indigenous people generally had similar perceptions about police performance as non-Indigenous people except in relation to enforcing the laws, which was viewed less favourably among First Nations people. Further, established immigrants (those who immigrated to Canada before 2010), had less favourable views on five of the six measures, while recent immigrants were more likely than non-immigrants to say that the police were doing a good job of promptly responding to calls and ensuring the safety of the citizens in the area.
Many studies have shown that confidence in and perceptions of police among citizens are associated with several factors including their demographic characteristics, socioeconomic status, environmental exposures and prior negative experiences. While this article has presented a number of demographic characteristics, and some reported prior negative interactions with the police, it is important to consider other factors which have been linked to public perceptions of the police. These would include experiences of victimization and factors associated with vulnerability to victimization such as neighbourhood characteristics and perceptions of personal safety.
Detailed data tables
Table 1 Canadians' confidence in police, by selected characteristics, provinces, 2019
Table 2 Canadians' perceptions of police, by selected characteristics, provinces, 2019
Table 3 Canadians' perceptions of police, by reason for police contact, provinces, 2019
Table 4 Canadians' perceptions of police, by province, 2019
Table 5 Canadians' perceptions of police, by census metropolitan area, 2019
Methods for logistic regression analysis
The odds ratios presented throughout this article were the results of multiple regression analysis which was undertaken to assess the influence of factors of interest on the level of confidence that Canadians had in police. To simplify the interpretation of results, the dependent variable in the model was defined as having low confidence (not very much or no confidence at all). All variables listed in Table 1 were included in the model, however, only variables which had a significant impact (p < 0.05) were kept in the final model to yield the odds ratios. These variables are: age group, disability status, visible minority status, Indigenous identity, religious affiliation and recent contact with police (positive, negative or no contact in the previous 12 months).
Survey description
This article uses data from the General Social Survey (GSS) on Canadians’ Safety (Victimization). In 2019, Statistics Canada conducted the GSS on Victimization for the seventh time. Previous cycles were conducted in 1988, 1993, 1999, 2004, 2009 and 2014. The main objective of the GSS on Victimization is to better understand issues related to the safety and security of Canadians, including perceptions of crime and the justice system, experiences of intimate partner violence, and how safe people feel in their communities.
The target population was persons aged 15 and older living in the ten Canadian provinces, except for people living full-time in institutions. In 2019, the survey was also conducted in the three territories using a different sampling design. However, data pertaining to the territories, and to incidents of crime experienced in the previous twelve months for the provinces and territories will be released at a later date.
Data collection
Data collection took place between April 2019 and March 2020. Responses were obtained by computer-assisted telephone interviews (CATI) and, for the first time, the GSS on Victimization offered a self-administered internet collection option to survey respondents. Respondents were able to respond in the official language of their choice.
An individual aged 15 or older was randomly selected within each household to respond to the survey. An oversample of Indigenous people was added to the 2019 GSS on Victimization to allow for a more detailed analysis of individuals belonging to this population group.
In 2019, the sample size was 20,454 respondents, this number included an oversample of 3,056 Indigenous people.
Response rates
In 2019, the overall response rate was 36.4% (41.0% for the main sample, and 22.2% for the oversample). Non-respondents included people who refused to participate, could not be reached, or could not speak English or French. Respondents in the sample were weighted so that their responses represent the non-institutionalized Canadian population aged 15 and older.
Data limitations
As with any household survey, there are some data limitations. The results are based on a sample and are therefore subject to sampling errors. Somewhat different results might have been obtained if the entire population had been surveyed.
For the quality of estimates, the lower and upper bounds of the confidence intervals are presented in the tables and charts. Confidence intervals should be interpreted as follows: If the survey were repeated many times, then 95% of the time (or 19 times out of 20), the confidence interval would cover the true population value. Throughout this article, unless otherwise specified, statistically significant differences were determined using 95% confidence intervals.
Statistics Canada has confidence in the quality of the data disseminated from the 2019 GSS and assures that the data are fit for use for this analysis. Because of method used to collect information for the GSS, however, the data may not be representative for some subpopulations and smaller geographic areas. For example, this would have a more notable impact on populations with language barriers, or those in remote areas with less reliable telephone or telecommunications.
References
Arriagada, Paula, Tara Hahmann and Vivian O’Donnell. 2020. “Perceptions of safety of Indigenous people during the COVID-19 pandemic.” Data to Insights for a Better Canada. Statistics Canada Catalogue no. 45-28-0001.
Ben-Porat, Guy. 2008. “Policing multicultural states: lessons from the Canadian model.” Policing and Society. Vol., no. 4, p. 411-425.
Boivin, R. and Lam, R. 2016. “Sondages Web, opinion publique et performance policière.” Criminologie, Vol. 49, no. 1. p. 225–245.
Boyce, Jillian, Cristine Rotenberg and Maisie Karam. 2015. “Mental health and contact with police in Canada, 2012.” Juristat. Statistics Canada Catalogue no. 85-002-X.
British Columbia, Public Safety and Solicitor General. 2020. “Ministers statement on police act reform.” BC Gov News. (12 June 2020). (accessed September 21, 2020)
Brown, Ben and Wm. Reed Benedict. 2002, “Perceptions of the police: Past findings, methodological issues, conceptual issues and policy implications.” Policing: An International Journal of Police Strategies and Management. Vol. 25, no. 3. p. 543-580.
Canada. Parliament. 2020a. Debates of the Senate, 43rd Parl, 1st Sess, Vol. 151, Issue 22 (16 June 2020). (accessed September 15, 2020).
Canada. Parliament. 2020b. Debates of the Senate, 43rd Parl, 1st Sess, Vol. 151, Issue 27 (25 June 2020). (accessed September 15, 2020).
Cao, Liqun. 2014. “Aboriginal people and confidence in the police.” Canadian Journal of Criminology and Criminal Justice. Vol. 1. p. 1-34.
Chan, Wendy and Kiran Mirchandani. 2002. Crimes of Colour: Racialization and the Criminal Justice System in Canada. Peterborough. Broadview Press.
Chow, Henry P.H. 2012. “Attitudes towards police in Canada: A study of perceptions of university students in a western Canadian city.” International Journal of Criminal Justice Sciences. Vol. 7, no. 1. p. 508-523.
Chrismas, R. 2012. “The people are the police: Building trust with Aboriginal communities in contemporary Canadian society.” Canadian Public Administration. Vol. 55, no. 3. p. 451-470.
Coleman, Terry and Dorothy Cotton. 2014, “TEMP: Police Interactions: A report towards improving interactions between police and people living with mental health problems.” Mental Health Commission of Canada.
Conor, Patricia, Jodi Robson and Sharon Marcellus. 2019. “Police resources in Canada, 2018.” Juristat. Statistics Canada Catalogue no. 85-002-X.
Cotter, Adam. 2015. “Public confidence in Canadian institutions.” Spotlight on Canadians: Results from the General survey. Statistics Canada catalogue no. 89-652-X.
Cotter, Adam. 2018. “Violent victimization of women with disabilities”. Juristat. Statistics Canada catalogue no. 85-002-X.
Council of Canadian Academies, 2019. “Toward peace, harmony, and well-being: Policing in Indigenous communities. The Expert Panel on Policing in Indigenous Communities. Council of Canadian Academies. Ottawa, Ontario.
Deshman, Abby, Alexander McClelland and Alex Luscombe. 2020. “Stay off the grass: COVID-19 and law enforcement in Canada.” Policing the Pandemic Mapping Project. Canadian Civil Liberties Association.
Gannon, M. 2005. General Social Survey on Victimization: An Overview of Findings, 2004. Cycle 18. Statistics Canada, Social and Aboriginal Statistics Division.
Giacomantonio, Chris, Rebecca Mugford, Anton Maslov and Austin Lawrence. 2019. “Developing a common data standards for measuring attitudes toward the police in Canada.” Research Report. Catalogue no. PS113-1.
Hennigan, Karen M., Cheryl L. Maxson, David Sloane and Molly Ranney. 2002. “Community views on crime and policing: Survey mode effects on bias in community surveys.” Justice Quarterly. Vol 19, no. 3. p. 565-587. DOI: 10.1080/07418820200095351
Jaffray, Brianna. 2020. “Experiences of violent victimization and unwanted sexual behaviours among gay, lesbian, bisexual and other sexual minority people, and the transgender population, in Canada, 2019.” Juristat. Statistics Canada Catalogue no. 85-002-X.
Jones, N.A., Ruddell, R., Nestor, R., Quinn, K. and Phillips, B. 2014. “First Nations policing: A review of the literature.” Collaborative Centre for Justice and Safety. Regina, Saskatchewan.
LeBeuf, M. E. 2011. The Role of the Royal Canadian Mounted Police During the Indian Residential School System. Royal Canadian Mounted Police. Ottawa, Ontario.
Linchiat Chang and Jon A. Krosnick. 2010. “Comparing oral interviewing with self-administered computerized questionnaires an experiment.” Public Opinion Quarterly. Vol. 74, no. 1. p. 154–167.
Malakieh, Jamil. 2019. “Adult and youth correctional statistics in Canada, 2017/2018.” Juristat. Statistics Canada Catalogue no. 85-002-X.
Mazowita, Benjamin and Cristine Rotenberg. 2019. “The Canadian police performance metrics framework: Standardized indicators for police services in Canada.” Juristat. Statistics Canada Catalogue no. 85-002-X.
Missing and murdered Indigenous women and girls (MMIWG). 2019. Reclaiming Power and Place: The Final Report of the National Inquiry into Missing and Murdered Indigenous Women and Girls.
Morris, Stuart, Gail Fawcett, Larent Brisebois and Jeffrey Hughes. 2018. “A demographic, employment and income profile of Canadians with disabilities aged 15 years and over, 2017.” Canadian Survey on Disability Reports. Released on November 28, 2018.
Myhill, Andy and Kristi Beak. 2008. “Public confidence in the police.” Research, Analysis and Information. National Policing Improvement Agency. p. 1-42.
Nadal, K. L. and K. C. Davidoff. 2015. “Perceptions of Police Scale (POPS): Measuring attitudes towards law enforcement and beliefs about police bias.” Journal of Psychology and Behavioral Science. Vol. 3, no. 2. p. 1-9.
Nilson, Chad and Barb Mantello. 2019. “Joining the circle: Identifying key ingredients for effective police collaboration within Indigenous communities.” Community Safety Knowledge Alliance. Saskatoon, Saskatchewan.
Ontario Human Rights Commission. 2018. Interrupted Childhoods: Over-representation of Indigenous and Black Children in Ontario Child Welfare.
Payne, Brian K. and Randy R. Gainey. 2007. "Attitudes about the police and neighborhood safety in disadvantaged neighborhoods: The influence of criminal victimization and perceptions of a drug problem." Criminal Justice Review. Vol. 32, no. 2. p. 142-155.
Perreault, Samuel. 2017. “Canadians’ perceptions of personal safety and crime, 2014.” Juristat. Statistics Canada Catalogue no. 85-002-X.
Perreault, Samuel. 2019. “Police-reported crime in rural and urban areas in the Canadian provinces, 2017.” Juristat. Statistics Canada Catalogue no. 85-002-X.
Public Safety Canada. 2019. “Measuring public attitudes towards the police-Technical report.” Research Summary. 2019-S001.
Ren, Ling. Liqun Cao, Nicholas Lovrich and Michael Gaffney. 2005. “Linking confidence in the police with the performance of the police: Community policing can make a difference.” Journal of Criminal Justice. Vol. 33. p. 55-66.
Selkirk, Morgan. 2020. “Visible minority status and confidence in the police.” The Sociological Imagination: Western’s Undergraduate Sociology and Criminology Student Journal. Vol. 6, no. 1.
Simpson, Laura. 2018a. “Violent victimization and discrimination among visible minority populations, Canada, 2014.” Juristat. Statistics Canada Catalogue no. 85-002-X.
Simpson, Laura. 2018b. “Violent victimization of lesbians, gays and bisexuals in Canada, 2014.” Juristat. Statistics Canada Catalogue no. 85-002-X.
Statistics Canada. 2017. Census Profile, 2016 Census. Statistics Canada Catalogue no. 98-316-X.
Statistics Canada. 2020. “Experiences of discrimination during the COVID-19 pandemic.” The Daily. Statistics Canada. Released on September 17, 2020.
Stelkia, Krista. 2020. “Police brutality in Canada: A symptom of structural racism and colonial violence.” Policy Brief. Vol. 72. Yellowhead Institute.
Truth and Reconciliation Commission of Canada. 2015. Truth and Reconciliation Commission of Canada: Calls to Action. Winnipeg, Manitoba.
Weitzerm, Ronald. 2002. “Incidents of police misconduct and public opinion.” Journal of Criminal Justice. Vol. 30, no. 2.
Weitzer, Ronald and Steven A. Tuch. 2005. “Racially biased policing: Determinants of citizen perceptions.” Social Forces. Vol. 83, p. 1009-1030.
- Date modified: