
Crime reported by police serving areas where the majority of the population is Indigenous, 2018

Archived Content
Information identified as archived is provided for reference, research or recordkeeping purposes. It is not subject to the Government of Canada Web Standards and has not been altered or updated since it was archived. Please "contact us" to request a format other than those available.
by Mary Allen, Canadian Centre for Justice and Community Safety Statistics
Highlights
- In 2018, there were 182 police services or detachments in Canada that were responsible for serving populations where over half the residents were Indigenous. For ease of readability, these are often referred to as “Indigenous communities” in this article. It is important to note that the communities served by these police services do not represent all Indigenous communities in Canada.
- For most of these police services, 75% or more of the population they served were Indigenous. This specific set of small communities represents 21% of the Indigenous population of Canada (or 1% of the total Canadian population), based on information on the population that identified as First Nations people, Métis or Inuit in the 2016 Census of Population, or that lived on reserve.
- The median population served by these 182 police services was fewer than 1,500 individuals. Overall, 88% of the population of these communities was Indigenous. Most of the populations served lived in a rural area (91%), and 71% lived in the northern regions of the provinces or in the Territories. Over two-thirds (72%) of the population in these Indigenous communities lived in remote areas.
- These 182 police services reported some of the highest rates of crime among the about 1,200 police services and detachments in Canada. This study explores the nature and extent of the police-reported crime in these Indigenous communities.
- In 2018, police-reported crime rates for these Indigenous communities were six times higher than crime rates reported by police services that served primarily non-Indigenous populations.
- The higher crime rates reported by police serving these Indigenous communities can be mainly attributed to greater levels of mischief, common assault, and disturbing the peace. These three offences accounted for a relatively small share of police-reported crime in non-Indigenous communities (23%), but more than half (58%) of crime reported in Indigenous communities. Mischief and disturbing the peace are offences which may be more likely to come to the attention of police in smaller communities. They may also be affected by differences in police practices with respect to the use of provincial violations and municipal by-laws for this type of behaviour.
- Crime rates among Indigenous communities varied by province and territory. The highest rates were reported in Indigenous communities in the Northwest Territories, Saskatchewan, Yukon, and Newfoundland and Labrador. The lowest rates of crime reported in Indigenous communities were in British Columbia and Ontario.
- Violent crime rates reported by Indigenous communities were almost nine times higher than those primarily serving non-Indigenous communities. Most of the difference between these rates can be attributed to higher rates of common assault.
- Police-reported crimes in the Indigenous communities studied were more likely to be solved (cleared) than in non-Indigenous communities (66% versus 37%). However, of those that were cleared, crimes in Indigenous communities were less likely to result in a criminal charge being laid than those in non-Indigenous communities (35% versus 70%), with the most notable difference among non-violent property crimes such as mischief (10% versus 59%).
- Unlike non-Indigenous communities where the highest rates of individuals accused of crime are limited to youth and young adults, rates of accused in Indigenous communities in this study were generally higher among adults than youth, and were notably high among older adults. This may be related to higher levels of risk factors among the older Indigenous population, including childhood trauma, experience in residential schools, mental health issues, and heavy drinking. Among younger populations, there is little difference in these factors between Indigenous and non-Indigenous individuals.
Levels of crime and victimization in First Nations, Métis and Inuit communities are a concern in Canada. Self-reported data have repeatedly shown high rates of victimization among individuals who identify as First Nations people, Métis or Inuit (Boyce 2016). Similarly, police-reported data consistently shows high rates of homicide among Indigenous peoples compared to the rate for non-Indigenous victims (Roy and Marcellus 2018). The National Inquiry into Missing and Murdered Indigenous Women and Girls (MMIWG) provided an in-depth examination of violence against First Nations, Métis and Inuit women, girls and 2SLGBTQQIA people and called for action to address the root causes behind Canada’s staggering rates of violence against them (Missing and Murdered Indigenous Women and Girls 2019). This report also raised concerns around the treatment of Indigenous peoples in the criminal justice system both as victims and as accused individuals. Information from Canadian correctional services has shown that Indigenous peoples are notably over-represented among offenders in correctional services (Malakieh 2019). Recently, there has also been much public discussion about the relationship between police and Indigenous peoples, with calls to address systemic racism in policing (British Columbia 2020, Canada, Parliament 2020a, Canada, Parliament, 2020b).
In parallel, there has been much discussion of the ongoing impact of colonization on First Nations people, Métis and Inuit in Canada, particularly regarding the effects of socioeconomic marginalization, trauma, and intergenerational violence on life outcomes as well as on substance use, mental health, delinquency and associated criminal behaviour (Aguiar and Halseth 2015, Anderson 2015, Capobianco et al. 2003, Kumar and Nahwegahbow 2016, Oliver et al. 2016, R. v. Gladue 1999, R. v. Ipeelee 2012). Many Indigenous people in Canada face challenging social and economic circumstances which can be a factor in criminal behaviour, and may also have an impact on the ability of both accused and victims to navigate the criminal justice system.
Research on victimization has pointed to risk factors such as child maltreatment, substance use, mental health, homelessness, and neighbourhood disorder. Indigenous people are more likely to self-report each of these key factors (Boyce 2016). These are also factors that have been associated with offending, and recognizing their impact is important in understanding crime among these populations (See Text box 2). The Truth and Reconciliation Commission has drawn attention to the challenges of crime experienced in Indigenous communities and the issue of over-incarceration as part of the legacy of the residential schools (Truth and Reconciliation Commission 2015). This history was also noted in the 1999 Supreme Court decision in the case of R. v. Gladue (the “Gladue decision”), which ruled that judges “must give attention to the unique background and systemic factors which may have played a part in bringing the particular offender before the courts” (R. v. Gladue 1999). In spite of this decision, however, there is still concern about how Indigenous individuals are treated by the criminal justice system. In particular, there has been considerable concern about their continued over-representation in correctional institutions (Office of the Correctional Investigator 2020) as well as a renewed focus on police practices.
Much of the research previously available examines issues facing the Indigenous population in general. Less information has been published, however, on the experience of crime at a community level, within Indigenous communities. Although statistics consistently show that police services serving Indigenous communities report some of the highest rates of crime in Canada (Statistics Canada n.d.a), there has been little detailed analysis to examine the nature of crime in these communities.
Building on previous studies that looked at crime in regions with relatively large Indigenous populations,Note this Juristat uses data from the Uniform Crime Reporting Survey (UCR) to examine the nature and extent of crime reported in 2018 by 182 police services or detachments that were identified in this study as serving populations where over half the residents were Indigenous. For most of these police services, 75% or more of the population they served were Indigenous, that is, they identified as First Nations people, Métis or Inuit in the 2016 Census of Population, or lived on reserve. The focus of this article is to identify those offences which account for much of the difference between rates of crime when compared with police serving predominantly non-Indigenous populations. In addition, the article presents information on the socioeconomic conditions of these communities as well as contextual information on other challenges faced by Indigenous peoples in Canada which may help in interpreting the crime experienced in these communities.
It is important to note that the communities identified as Indigenous for this study are not representative of crime experienced by Indigenous populations in general. Rather, they are a small set of communities including villages and reserves that are relatively small, generally rural, and often remote, and they represent only a small proportion of the Indigenous population of Canada (See the Indigenous communities examined in this study section). However, for ease of readability, in this article, the communities served by police services serving majority Indigenous populations are sometimes referred to as “Indigenous communities”.
The term “Indigenous” is used throughout this article when referring to the Indigenous population (First Nations people, Métis or Inuit) served by a police service (estimated from Census data on Aboriginal identity, reserve locations and other administrative data sources).Note Note
Indigenous communities examined in this study
Method
The Uniform Crime Reporting Survey collects detailed information on all criminal incidents reported by police services and detachments in Canada. Information about the specific location of incidents (such as on-reserve) or the Indigenous identity of accused and victims is not consistently reported by police.Note Therefore, in order to examine crime affecting Indigenous communities, this study identified police services where more than half of the population they served was Indigenous.
To delineate these police services for the purposes of this analysis, information was gathered from the 2016 Census of Population and verified by various administrative sources to identify police services and detachments where over 50% of the population they serve identified as First Nations people, Métis or Inuit in the 2016 Census of Population, or lived on reserve. For a detailed description of this method see the Data sources and concepts section).
This method identified 182 police services or detachments serving majority Indigenous populations. In total, 1,167 police services reported to the Uniform Crime Reporting Survey (UCR) in 2018. For ease of readability, in this article, the communities served by these 182 police services are sometimes referred to as “Indigenous communities”.
Limitations
It should be noted that some police services may serve more than one community or location, including both Indigenous and non-Indigenous communities. Moreover, it is important to note that the communities served by these 182 police services do not represent all Indigenous communities in Canada. For example, many small Indigenous villages or reserves are served by police in adjacent, primarily non-Indigenous rural centers, and others may be policed by municipal police based in larger non-Indigenous cities, and, as such, were included as part of the “non-Indigenous” communities in this study.
Due to the nature of the police-reported data, this study cannot specifically examine crimes committed on reserve, compared to crimes committed off reserve. While this study was able to identify police services which serve reserves, and can estimate the percentage of the population living on reserve (using 2016 Census of Population data), the UCR does not have sufficient information to identify where crimes occurred (on or off reserve) (See the Data sources and concepts section). In the Provinces, where reserves are located, 130 police services served areas with majority Indigenous populations. Most of these (114 police services) served reserves, and 94 police services served communities where over half of the population lived on reserve. Over half of these 114 police services (64) served populations living both on and off reserve; another 50 of them served only reserve populations. Overall, the police services identified a serving majority Indigenous populations in this study served 70% of the total population living on reserve in Canada.
Characteristics of the communities served by police services in this study
While comparisons are made between police services serving areas with majority Indigenous populations and those serving majority non-Indigenous populations, it should be noted that there are notable differences in the populations and locations of the communities served by these two comparison groups. For example, all of the police services serving majority Indigenous populations were generally small, while those serving non-Indigenous populations included large municipal police services. These and other differences should be considered in the interpretation of the findings.Note
Based on information from the 2016 Census of Population, the 182 police services and detachments identified in this analysis as serving Indigenous communities served 21% of the Indigenous population in Canada. Overall, the total population served by the 182 police services accounted for about 1% of the population of Canada. The police services in this study are therefore a very specific and small subset of Indigenous communities and do not represent Indigenous populations in general, particularly the growing majority of Indigenous people who live in urban areas.
Most of the police services serving Indigenous communities in this study were Royal Canadian Mounted Police (RCMP) detachments (139 detachments); seven were Ontario Provincial Police (OPP) detachments, and 36 police services were First Nations self-administered police services (See Text box 1).Note
Nationally, an estimated 88% of the population served by these 182 police services were Indigenous (identified as First Nations people, Métis or Inuit in the 2016 Census of Population, or lived on reserve). This proportion varied by province and territory, ranging from 71% in British Columbia, 75% in Yukon, and 77% in Alberta to 100% in Nova Scotia, New Brunswick, and Quebec (See the Data sources and concepts section). These proportions show that although this study uses a greater than 50% cut-off to identify police services serving primarily Indigenous populations, most have much higher proportions. For 149 of the police services or detachments identified as serving Indigenous communities, 75% or more of the population was Indigenous.
The populations served by police services serving Indigenous communities are very different from the non-Indigenous communities they are compared to in this study. Of the 182 police services identified as serving majority Indigenous populations, 168 served rural areas, of which 141 were remote.Note Most (91%) of the population of the Indigenous communities in this analysis lived in a rural area, and 71% lived in the Provincial North or Territories (134 police services). Over two-thirds (72%) of the population in the Indigenous communities in this study lived in remote areas. In contrast, 85% of the population of the non-Indigenous communities in this analysis lived in urban areas; 5% lived in the North; and 3% lived in remote communities.
Indigenous communities in this study also tended to be much smaller than non-Indigenous communities, with a median population of less than 1,500 inhabitants. Most (160) police services serving Indigenous communities in this study served fewer than 5,000 people. In contrast, the median population served by police services in the comparison group for this study (non-Indigenous communities) was about 9,500.Note Almost two-thirds (63%) of the population in these non-Indigenous communities were served by police services serving populations of 100,000 or more.
In spite of these general differences, it is important to note that the Indigenous communities in this study are not homogenous. Some are close to larger urban areas, many are remote. Their populations are also varied, representing the diversity of First Nations people, Métis and Inuit, with a range of cultural differences and historical experiences. Despite these differences, there remain shared factors common to all three groups, namely the historical oppression, discrimination, and socioeconomic marginalization which often play a role in various social and health inequities.
Start of text box 1
Text box 1
Approaches to
addressing crime in Indigenous communities
In the context of high rates of victimization and ongoing discussions about the experience of Indigenous individuals in the criminal justice system, a wide range of policies and strategies have been developed to help reduce crime in Indigenous communities. These generally tend to be programs designed to address broader social issues through community involvement. Communities often seek to manage at-risk behaviours, criminal offending and violence through mental health and substance use programs, youth programming, family violence initiatives, or community restrictions related to alcohol use.
There are also a variety of community-based justice programs available in many Indigenous communities. These include diversion programs for offenders, sentencing alternatives such as justice circles, family and community mediation, victim support, and offender-reintegration services. Many communities have developed restorative justice programs, such as community justice committees, as a means of diverting offenders away from the formal court system, especially for minor offences. These restorative justice programs are particularly relevant in smaller communities where offenders and victims (and police) often know each other, and where individual crimes have an impact on the community overall. Restorative justice programs seek to repair the harm done by the offender, offer healing for victims and the community, restore relationships, and reintegrate the offender into the community and prevent re-offending. They include a variety of alternative measures such as victim offender mediation, family group conferencing, and sentencing circles. Community justice committees, for example, facilitate discussions between the offender and victim(s), encourage offenders to take responsibility for their actions and find ways for them to make restitution. Resolutions may include community service, counseling or addiction treatment. Where these are available, offenders may be diverted to these programs with or without being charged by police, and referrals may occur pre-trial or as part of sentencing. It is worth noting, however, that not all communities have the resources or expertise available to provide various types of programming.
Another way that communities seek to take control of their own justice matters is through direct involvement in the policing of their communities often supported by the federal government’s First Nations Policing Program (FNPP). This program provides funding for police services in Indigenous communities. The communities are responsible for governing the police service through a police board, band council, or other authority (Lithopoulos and Ruddell 2011). Some communities (36 in this study) have self-administered First Nations police services: 21 are in Quebec, another 9 are in Ontario, and the remaining 6 are in the western provinces. Most FNPP agreements, however, support RCMP detachments working with community consultative groups through “community tripartite agreements” which involve the federal government, provincial or territorial governments, and the Indigenous community.
The Supreme Court decision in R v. Gladue in 1999 set out principles requiring that courts take the unique circumstances of Indigenous offenders into account in sentencing. The decision laid out a framework to help guide judges in sentencing Indigenous offenders. This led to the recommended use of “Gladue reports” which provide background information on an offender to assist in appropriate sentencing. In 2012, in R.v Ipeelee, the Supreme Court reaffirmed and extended the Gladue decision, and also recognized that the system bore some of the responsibility for the offences discussed in the case (R. v. Ipeelee 2012 para 154-156). The Gladue decision also contributed to the development of specialized Indigenous courts in Canada. These courts bring an awareness of Indigenous issues into sentencing and incorporate Indigenous customs and traditions into the court process (April and Magrinelli Orsi 2013). British Columbia, for example, has First Nations courts in a number of communities (Dandurand and Vogt 2017). Developed with local First Nations and the justice system, these courts involve community Elders, and use healing plans and a restorative justice approach to dealing with Indigenous accused. Other provinces have also developed specialized courts for Indigenous accused persons. Saskatchewan, for example, has a Cree Court which provides circuit courts in Indigenous communities in the Cree language. These courts encourage community involvement in the court process and also incorporate traditional approaches to justice.
End of text box 1
Police-reported crime in Indigenous communities
Rate of police-reported crime six times higher in Indigenous communities than in non-Indigenous communities
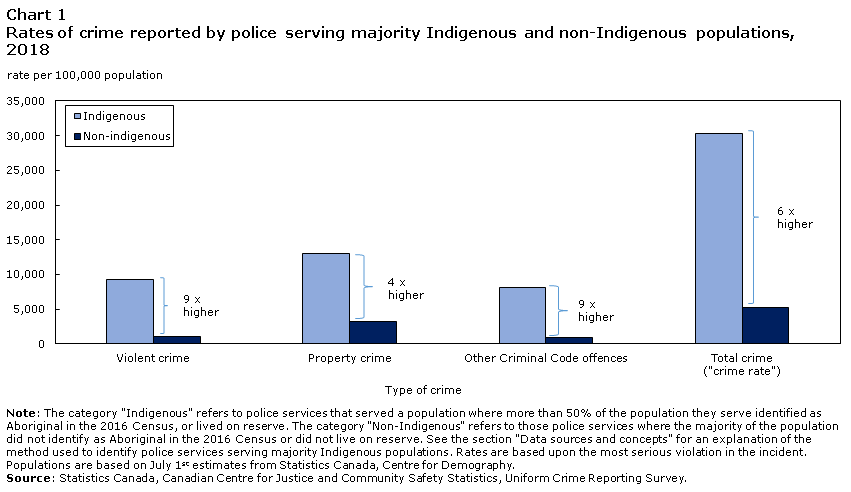
In 2018, police serving majority Indigenous populations reported an overall crime rate of 30,333 incidents per 100,000 population, or about 3 criminal incidents reported for every 10 people living in the community. This represented 133,419 criminal incidents, and accounted for 7% of all crime reported in Canada in 2018. By comparison, police serving non-Indigenous communities reported 5,191 incidents per 100,000 population, or about 1 incident for every 20 inhabitants. Crime rates were higher in Indigenous communities across all major crime categories (Table 1, Chart 1).
Chart 1 start
Data table for Chart 1
| Type of crime | Indigenous | Non-indigenous |
|---|---|---|
| rate per 100,000 population | ||
| Violent crime | 9,220 | 1,047 |
| Property crime | 13,029 | 3,223 |
| Other Criminal Code offences | 8,084 | 921 |
| Total crime ("crime rate") | 30,333 | 5,191 |
|
Note: The category "Indigenous" refers to police services that served a population where more than 50% of the population they serve identified as Aboriginal in the 2016 Census, or lived on reserve. The category "Non-Indigenous" refers to those police services where the majority of the population did not identify as Aboriginal in the 2016 Census or did not live on reserve. See the section "Data sources and concepts" for an explanation of the method used to identify police services serving majority Indigenous populations. Rates are based upon the most serious violation in the incident. Populations are based on July 1st estimates from Statistics Canada, Centre for Demography. Source: Statistics Canada, Canadian Centre for Justice and Community Safety Statistics, Uniform Crime Reporting Survey. |
||
Chart 1 end
Although accounting for a very small portion of the crime committed in Canada, the rates of crime reported by police that serve predominantly Indigenous populations in Canada are notably high. Of the 50 police services in Canada reporting the highest rates of crime in 2018, 47 served majority Indigenous populations. Moreover, over 9 in 10 police services serving majority Indigenous populations (169 police services) reported rates of crime above the national crime rate for Canada (5,488 per 100,000 population), with 147 reporting rates more than double the national rate.
Nationally, rates of almost all offences were higher in Indigenous communities with the exception of theft of $5,000 or under from a motor vehicle, shoplifting ($5,000 or under), and fraudNote (Table 2). This is not surprising as most of the Indigenous communities in this study are rural and these offences are much more common in urban areas (Perreault 2019).
Most notably, rates of some of the most serious offences including homicide, major assault (levels 2 and 3),Note and violent firearms offences such as pointing or discharging a firearm with intent were particularly high in Indigenous communities. Overall, these more serious offences were relatively infrequent, representing 5% of criminal incidents in Indigenous communities and 3% in non-Indigenous communities.
Crime rates in Indigenous communities varied by province and territory
Crime rates reported by police services serving majority Indigenous and non-Indigenous communities varied by province and territory. The highest rates were reported in Indigenous communities in the Northwest Territories and Saskatchewan, while the provinces with the lowest rates of crime reported in Indigenous communities were British Columbia and Ontario (Chart 2). In all jurisdictions, rates of almost all categories of crime were higher in Indigenous communities. The only exception was British Columbia where rates of property crime were higher in non-Indigenous communities, primarily as a result of much higher rates of theft of $5,000 or under (specifically shoplifting or theft from a motor vehicle). This was the jurisdiction with the smallest difference overall between Indigenous and non-Indigenous communities (Table 1).
Chart 2 start

Data table for Chart 2
| Province or territory | Indigenous | Non-indigenous |
|---|---|---|
| rate per 100,000 population | ||
| Canada | 30,333 | 5,191 |
| Nunavut | 38,119 | Note ...: not applicable |
| Northwest Territories | 56,844 | 27,792 |
| Yukon | 43,028 | 17,795 |
| British Columbia | 10,534 | 7,378 |
| Alberta | 34,359 | 8,281 |
| Saskatchewan | 50,258 | 9,578 |
| Manitoba | 29,892 | 8,026 |
| Ontario | 16,593 | 4,054 |
| Quebec | 21,138 | 3,167 |
| New Brunswick | 24,174 | 5,226 |
| Nova Scotia | 21,058 | 4,981 |
| Prince Edward Island | Note ...: not applicable | 4,678 |
| Newfoundland and Labrador | 42,407 | 4,993 |
|
... not applicable Note: The category "Indigenous" refers to police services that served a population where more than 50% of the population they serve identified as Aboriginal in the 2016 Census, or lived on reserve. The category "Non-Indigenous" refers to those police services where the majority of the population did not identify as Aboriginal in the 2016 Census or did not live on reserve. See the section "Data sources and concepts" for an explanation of the method used to identify police services serving majority Indigenous populations. Populations are based on July 1st estimates from Statistics Canada, Centre for Demography. Source: Statistics Canada, Canadian Centre for Justice and Community Safety Statistics, Uniform Crime Reporting Survey. |
||
Chart 2 end
It should be noted that high rates in some jurisdictions may reflect differences in legislation or in police practices. For example, police may report some incidents (especially mischief and disturbing the peace) under provincial law or municipal by-laws where these are available, and, as such, are not included in the UCR crime data. In addition, geographic differences by jurisdiction may also play a role, especially in terms of the remoteness of communities and proximity to urban centres.
High rates of mischief, common assault, and disturbing the peace help explain the large differences in crime rates between Indigenous and non-Indigenous communities
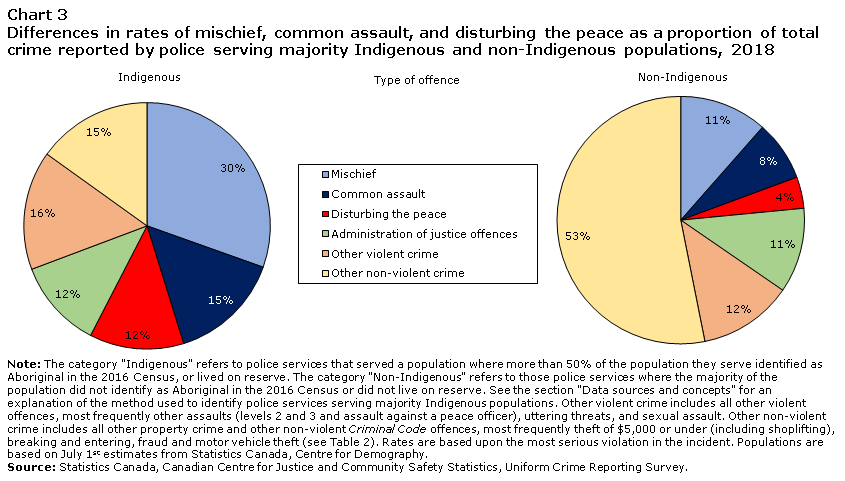
A substantial proportion of the difference in the crime rates between police serving majority Indigenous and non-Indigenous populations can be attributed to high rates of mischief, common assault, and disturbing the peace, which are often considered less serious offences. These three offences accounted for a relatively small share of crime in non-Indigenous communities (23%), but accounted for over half of crime (58%) reported in Indigenous communities (Chart 3).
Chart 3 start
Data table for Chart 3
| Type of offence | Indigenous | Non-Indigenous |
|---|---|---|
| percent | ||
| Mischief | 30 | 11 |
| Common assault | 15 | 8 |
| Disturbing the peace | 12 | 4 |
| Administration of justice offences | 12 | 11 |
| Other violent crime | 16 | 12 |
| Other non-violent crime | 15 | 53 |
|
Note: The category "Indigenous" refers to police services that served a population where more than 50% of the population they serve identified as Aboriginal in the 2016 Census, or lived on reserve. The category "Non-Indigenous" refers to those police services where the majority of the population did not identify as Aboriginal in the 2016 Census or did not live on reserve. See the section "Data sources and concepts" for an explanation of the method used to identify police services serving majority Indigenous populations. Other violent crime includes all other violent offences, most frequently other assaults (levels 2 and 3 and assault against a peace officer), uttering threats, and sexual assault. Other non-violent crime includes all other property crime and other non-violent Criminal Code offences, most frequently theft of $5,000 or under (including shoplifting), breaking and entering, fraud and motor vehicle theft (see Table 2). Rates are based upon the most serious violation in the incident. Populations are based on July 1st estimates from Statistics Canada, Centre for Demography. Source: Statistics Canada, Canadian Centre for Justice and Community Safety Statistics, Uniform Crime Reporting Survey. |
||
Chart 3 end
Over four in ten criminal incidents in Indigenous communities are mischief or disturbing the peace
In 2018, the rate of mischief was 15 times higher in Indigenous communities than in non-Indigenous communities (9,233 versus 597 incidents per 100,000 population) (Table 2). Mischief is a Criminal Code offence that covers a range of criminal behaviour, including various sorts of vandalism, such as graffiti, as well as destructive or obstructive reckless behaviour.Note Almost one-third (30%) of all police-reported crimes in Indigenous communities was mischief compared to 11% in non-Indigenous communities. At the national level, the high rate of mischief reported in Indigenous communities accounted for a substantial part of the difference in crime rate between them and non-Indigenous communities.Note
The penalty for this type of offence is generally low and differences across police services in how these are handled could be associated with higher police-reported levels in some areas than others. In some jurisdictions these behaviours may be dealt with as a provincial offence or municipal by-law infraction resulting in a ticket. For example, obstructive drunk behaviour may be treated under provincial public intoxication laws or municipal noise by-laws; graffiti is sometimes dealt with under municipal graffiti by-laws. When dealt with through provincial or municipal laws and by-laws, such infractions are not included in the crime rate. Provincial and municipal alternatives may be more readily available to police in non-Indigenous, particularly urban, communities, and this availability may contribute to the differences in rates seen between Indigenous and non-Indigenous communities.Note
The highest rates of mischief were reported by police serving majority Indigenous populations in the Northwest Territories, Newfoundland and Labrador, and Saskatchewan (Table 3). In contrast, much lower rates of mischief were reported in Indigenous communities in British Columbia, Quebec, and Ontario.
In 2018, 12% of police-reported criminal incidents in Indigenous communities were for disturbing the peace (4% in non-Indigenous communities). Disturbing the peace is a Criminal Code offence that involves causing a disturbance in or near a public place, including fighting, shouting, or using insulting or obscene language, public intoxication, or impeding or molesting other persons.Note Like mischief, it may also be dealt with under provincial or territorial laws (e.g. public intoxication) or municipal by-laws. Police serving primarily Indigenous communities in Canada reported 3,754 incidents of disturbing the peace per 100,000 population. This is almost 18 times higher than in non-Indigenous communities (213 per 100,000) (Table 2).
Together, mischief and disturbing the peace accounted for 43% of all criminal incidents reported in Indigenous communities in 2018 compared to 16% of crime in non-Indigenous communities. Notably, the proportion of all incidents that were mischief or disturbing the peace varied considerably by jurisdiction. These offences accounted for lower proportions of criminal incidents for Indigenous communities in Quebec (11%) and Ontario (24%), but comprised the majority of criminal incidents in Indigenous communities in Nunavut (62%), the Northwest Territories (58%), Newfoundland and Labrador (57%), and Yukon (53%). They also accounted for almost half of crime (48%) in Indigenous communities in both Saskatchewan and Alberta.
It is important to recognize that some of the difference in police-reported rates of mischief and disturbing the peace is a reflection of different police practices across jurisdictions. As noted earlier, some police services may be more likely to record incidents (especially of disturbing the peace) under related municipal or reserve by-laws (including violations of alcohol bans on reserve), or provincial or territorial statutes such as laws governing public intoxication or noise, which may result in a ticket. For example, the highest rates of mischief or disturbing the peace were reported by the RCMP whether serving Indigenous or non-Indigenous communities. Relatively lower rates were typically reported by the Ontario Provincial Police, the Sûreté du Québec, the Royal Newfoundland Constabulary and most municipal police services where there may be a greater tendency to use provincial or municipal alternative violations available in their jurisdictions.
Other factors that might influence the high rates of mischief and disturbing the peace include the small size of communities where incidents such as these may more readily come to the attention of the police. It is also important to note that these specific offences are related to mental health and substance use conditions, which are proportionally more frequent among Indigenous populations (Boyce et al. 2015).
The impact of these two offences on levels of crime reported in Indigenous communities is notable. When just these two offences are excluded from the calculation of the overall crime rate, the difference in rates of crime between Indigenous and non-Indigenous communities is still large, but shrinks by almost half (48%) (Chart 4).
Chart 4 start

Data table for Chart 4
| Indigenous | Non-Indigenous | |
|---|---|---|
| rate per 100,000 population | ||
| Total crime ("crime rate") | 30,333 | 5,191 |
| Total crime excluding mischief and disturbing the peace | 17,347 | 4,382 |
|
Note: The category "Indigenous" refers to police services that served a population where more than 50% of the population they serve identified as Aboriginal in the 2016 Census, or lived on reserve. The category "Non-Indigenous" refers to those police services where the majority of the population did not identify as Aboriginal in the 2016 Census or did not live on reserve. See the section "Data sources and concepts" for an explanation of the method used to identify police services serving majority Indigenous populations. Rates are based upon the most serious violation in the incident. Populations are based on July 1st estimates from Statistics Canada, Centre for Demography. Source: Statistics Canada, Canadian Centre for Justice and Community Safety Statistics, Uniform Crime Reporting Survey. |
||
Chart 4 end
Incidents of mischief and disturbing the peace in Indigenous communities more likely to be solved, but rarely resulted in a charge
It is worth noting that, while rates of mischief and disturbing the peace were particularly high in Indigenous communities, these incidents were also more likely to be cleared (solved, with an accused identified), relative to non-Indigenous communities. Once cleared, however, these incidents were less likely to result in a charge, relative to non-Indigenous communities. In 2018, police serving primarily Indigenous populations were able to identify an accused (clear the incident) in 61% of mischief incidents, but only 4% of these cleared incidents resulted in a charge. In non-Indigenous communities, only 21% of mischief incidents were cleared, but a much higher proportion of these cleared incidents (32%) resulted in a charge.
It may be that this reflects differences in the nature of mischief in these communities, which can vary from graffiti for which an accused is generally not identified, to obstructive and damaging behaviour where the police are called in. In addition, incidents of a nature that might otherwise be dealt with as non-criminal infractions in other jurisdictions (such as bylaws related to noise or public intoxication) might not be considered serious enough to warrant charges. A similar pattern was seen for disturbing the peace (Table 4, Chart 5).
Chart 5 start

Data table for Chart 5
| Clearance status | Disturbing the Peace | Mischief | ||
|---|---|---|---|---|
| Indigenous | Non-Indigenous | Indigenous | Non-Indigenous | |
| percent | ||||
| Not cleared | 39 | 59 | 39 | 79 |
| Cleared by charge | 1 | 2 | 2 | 7 |
| Cleared by other means | 61 | 39 | 59 | 14 |
|
Note: The category "Indigenous" refers to police services that served a population where more than 50% of the population they serve identified as Aboriginal in the 2016 Census, or lived on reserve. The category "Non-Indigenous" refers to those police services where the majority of the population did not identify as Aboriginal in the 2016 Census or did not live on reserve. See the section "Data sources and concepts" for an explanation of the method used to identify police services serving majority Indigenous populations. For an incident to be cleared by charge, at least one accused must have been identified and either a charge has been laid, or recommended to be laid, against this individual in connection with the incident. For an incident to be cleared otherwise, an accused must be identified and there must be sufficient evidence to lay a charge in connection with the incident, but the accused is processed by other means. Source: Statistics Canada, Canadian Centre for Justice and Community Safety Statistics, Uniform Crime Reporting Survey. |
||||
Chart 5 end
Administration of justice offences six times higher in Indigenous communities
The rate of violations related to the administration of justice in 2018 were six times higher in Indigenous communities compared to non-Indigenous communities (3,548 versus 577 incidents per 100,000 population). Offences related to the administration of justice result from previous contact with the criminal justice system, and include offences such as failure to comply with an order, breach of probation, and failure to appear. These administrative offences are sometimes seen as the ‘revolving door’ of the justice system, since by definition most of these types of crimes are committed when an individual disobeys a pre-trial condition or sentence imposed for a previous offence, such as probation. In Indigenous communities, the most frequent administration of justice offences were failure to comply with an order (60% of these offences) and breach of probation (25%). These were also the most frequent administration of justice offences in non-Indigenous communities, (55% and 22%, respectively).
They are also considered a contributing factor in re-offending and a factor in the over-representation of Indigenous offenders in the corrections system. Recent reports have drawn attention to ways that unreasonable bail conditions exacerbate the number of administration of justice crimes, particularly with respect to remote communities and Indigenous peoples (Coady 2018; Deshman 2014; R. vs Antic 2017; Barnett et al. 2018).
Much of the difference in rates of these offences can be accounted for by the high proportion of Indigenous communities located in the North where rates of administration of justice offences were notably high in both Indigenous and non-Indigenous communities. The size and remoteness of many of these Northern communities may be a factor if they affect the ability of an accused to appear in court, report to a probation officer, or access required programming if services and programs are not readily available in their community.
Start of text box 2
Text box 2
Context of crime in
Indigenous communities
There are many factors that influence police-reported crime statistics. First, an incident must come to the attention of police and be treated as criminal. Differences between individual police services, such as available resources or departmental priorities, policies and procedures can also have an effect on police-reported crime. As noted above, some police services, particularly those in larger non-Indigenous communities, may make greater use of municipal bylaws or provincial statutes to respond to minor offences such as mischief and disturbing the peace.
It is also important to acknowledge the circumstances of Indigenous communities in Canada, particularly the personal and socioeconomic effects of colonization and the residential school system which have been associated with trauma, mental health issues, substance abuse, intergenerational violence and suicidal thoughts (Capobianco et al. 2003, Carrière et al. 2018, Kumar and Nahwegahbow 2016, Anderson 2015). As the Report of the Truth and Reconciliation Commission notes: “traumatized by their school experiences, many succumbed to addiction and found themselves among the disproportionate number of Aboriginal people who come into conflict with the law” (Truth and Reconciliation Commission 2015, Vol. 5). More recently, there has been increasing concern about the similar impact on the large numbers of Indigenous youth in the child welfare system (Doucet and Pratt 2018, Ontario Human Rights Commission 2018).
The socioeconomic conditions of the Indigenous communities in this study are notably different from the average conditions of non-Indigenous communities in Canada.Note According to information from the 2016 Census of Population, individuals in the Indigenous communities in this study were much less likely to have completed high school. In addition, they were less likely to be employed and less likely to participate in the labour force, which may be tied to limited access to work opportunities in more remote communities. In turn, individuals in Indigenous communities were more likely to live in low-income families, with a relatively high proportion of the population in the bottom income decile.Note They were also more likely to live in crowded housing.Note These differences varied by jurisdiction (Table 5). Overall, these data show that the Indigenous communities in this study are particularly marginalized. For example, an examination of the 100 police services with the highest proportions of the population with the lowest incomes (in the bottom income decile), shows that 92 of them served majority Indigenous populations. A similar pattern is seen for high school completion.
The conditions faced by the Indigenous populations reflect factors generally associated with high levels of violence. Findings from the 2014 General Social Survey on Canadians’ Safety (Victimization) (GSS) found that high rates of victimization were related to factors such as experiencing childhood maltreatment, perceiving social disorder in one's neighbourhood, experiencing homelessness, using drugs, or having fair or poor mental health, circumstances that are reported more often by Indigenous respondents (Perreault 2015, Boyce 2016).
Results from the same survey also show that the prevalence of childhood physical and sexual abuse is higher among Indigenous people. Two out of every five Indigenous people in Canada (40%) reported having been the victim of physical and/or sexual violence at the hands of an adult before they turned 15 (compared to 29% among non-Indigenous individuals. People identifying as Indigenous were also more likely than non-Indigenous to report that, as a child, they witnessed violence committed by a parent, step-parent or guardian against another adult (Burczycka 2017).This finding, however, is only true for those aged 30 and over, and may be related, in part, to residential school experiences among the older population. According to the 2012 Aboriginal Peoples Survey, 9% of off-reserve First Nations people aged 20 years and older reported having attended a residential school at some point in their lives. Of those aged 55 years and older, 17% had attended a residential school (Rotenberg 2012). Proportions among those living on reserve are not available.
Experiencing child maltreatment and its consequent trauma is associated with later mental health and substance use disorders which tend to be higher among Indigenous populations. Information from the 2012 Canadian Community Health Survey―Mental Health (CCHS―MH) showed that 67% of Canadians aged 18 and older with a mental health or substance use disorder had experienced at least one form of childhood maltreatment, at least once, before the age of 16, which was significantly higher than those Canadians aged 18 and older without a disorder (45%) (Boyce et al. 2015).Note At the same time, there is concern that many communities lack mental health services that are accessible, culturally appropriate and adequately resourced (Boksa et al. 2015, Nelson and Wilson 2017).
A recent report found that First Nations people, both on and off reserve, had twice the rate of acute care hospitalizations for mental and behavioural disorders. These were most frequently substance-related disorders which were 7 times higher among on-reserve, and 4 times higher among off-reserve First Nations populations compared to non-Indigenous people (Carrière et al. 2018). High rates of mental health disorders among Indigenous people are a serious concern, associated with high rates of suicide, health issues, and victimization, as well as delinquent behaviour.
Mental health issues have been shown to increase the likelihood of criminal behaviour and police contact. A study on mental health and contact with police found that individuals with a mental or substance use disorder, or who perceived a need for help with their emotions, mental health or substance use, had increased odds of contact with police, even when controlling for other factors (Boyce et al. 2015). Similarly, the study of Adverse Childhood Experiences (ACE) showed a strong relationship between childhood maltreatment and substance abuse, and it found that offenders had substantially higher rates of almost all types of childhood maltreatment compared to a control group (Reavis 2013).
Substance use generally is also associated with criminal behaviour and may be an important factor in offences such as mischief, disturbing the peace and assault, as well as breach of conditions. Information from the 2014 GSS on Victimization shows that Indigenous people are more likely to abstain from drinking: with 31% reporting that they did not drink in the year prior to the survey compared to 25% for non-Indigenous people. However, among those who do drink, Indigenous individuals were more likely to be heavy drinkers: 9% reported binge drinking (more than 5 drinks on one occasion) at least 5 times in the previous month compared to 5% of non-Indigenous drinkers.
The report on Police-reported crime in Inuit Nunangat (Charron et al. 2010) found that alcohol restrictions are associated with the variations in the police-reported crime rates between communities in Inuit Nunangat. In fact, crime rates were significantly higher in communities with fewer alcohol restrictions. The impact was particularly noticeable for rates of mischief and disturbing the peace.
All of these factors, size and location of communities, as well as socioeconomic conditions, and individual circumstances such as a history of trauma, and mental health or substance use issues, have been associated with contact with police. In addition, the nature of policing in these small communities may also play a role in how incidents come to the attention of police and how they are dealt with. All combined, therefore, they are likely key factors in rates of crime in Indigenous communities which have to deal with the impact of colonization, the trauma of the residential schools, and challenging community conditions.
End of text box 2
High rates of police-reported violent crime in Indigenous communities, particularly common assault
Violent offences accounted for 3 in 10 crimes (30%) reported by police serving majority Indigenous populations compared to 2 in 10 crimes (20%) in non-Indigenous communities. Police serving primarily Indigenous communities reported 9,220 incidents of violent crime per 100,000 population in 2018, almost nine times higher than those primarily serving non-Indigenous communities (1,047 per 100,000 population). Most of the difference between these rates can be attributed to higher rates of common assault, which was the most frequent violent offence for both community types (Table 2).
Common assault 11 times higher in Indigenous than in non-Indigenous communities
The rate of common assault (level 1) reported by police serving majority Indigenous populations was 11 times higher in Indigenous communities than in non-Indigenous communities (4,481 versus 409 incidents per 100,000 population), and represented half (49%) of violent crime compared with 39% of violent crime in non-Indigenous communities. The rate of major assault (levels 2 and 3) was also much higher (Table 2). Both common assaults and major assaults were more likely to be cleared in Indigenous communities (81% versus 72% for common assault; 83% versus 72% for major assaults), but, when cleared, they were less likely to result in a charge (53% versus 65% of cleared incidents for common assault; 75% versus 84% for major assaults).
Rate of non-spousal police-reported family violence in Indigenous communities was sixteen times higher than in non-Indigenous communities
In both Indigenous and non-Indigenous communities, the perpetrator in police-reported violent incidents was most often either a friend or acquaintance of the victim or an intimate partner other than a spouse. However, individuals in Indigenous communities were proportionally more likely than those in non-Indigenous communities to be victimized by family members other than a spouse (25% versus 13%), a greater number of victims being victimized by extended family members such as a grandparent, uncle, aunt or cousin. Overall, the rate of non-spousal family violence was 16 times higher in Indigenous communities, with the largest differences for major assault and common assault (Table 6, Table 7). The high rate of violence at the hands of extended family members may be partly related to differences in living arrangements in Indigenous communities. According to the GSS on Victimization, 15% of Indigenous individuals lived with extended family members (other than a child or spouse) compared to 8% in the non-Indigenous population. In addition, individuals in the Indigenous communities in this study were more likely to live in crowded housing.Note
The rate of intimate partner violence was 10 times higher in Indigenous communities than in non-Indigenous communities. This includes violence where the perpetrator was a current or former spouse or another intimate partner. In particular, the perpetrator was more likely to be an intimate partner other than a spouse such as a current or former boyfriend or girlfriend in Indigenous communities. The proportion of victims in Indigenous communities victimized by a stranger was smaller (8% versus 26%), which is expected given the realities of small communities where people are more likely to know one another and strangers are few. That said, rates of victimization by a stranger were still over twice as high in Indigenous communities (652 versus 244 per 100,000 population).
Rate of sexual assault in Indigenous communities was six times higher than in non-Indigenous communities
Police serving majority Indigenous populations reported 463 incidents of sexual assault per 100,000 population compared to 73 per 100,000 in non-Indigenous communities. In both cases, sexual assault level 1 accounted for over 97% of these incidents.Note It is important to note that the GSS on Victimization showed that only 5%E of self-reported sexual assaults experienced by Canadians aged 15 years and older in 2014 were brought to the attention of police, which means that figures reported by police are likely an underrepresentation of the true extent of sexual assault in both Indigenous and non-Indigenous communities.
In addition to sexual assaults, sexual crimes specific to children such as sexual interference, invitation to sexual touching and sexual exploitation are of particular concern in light of the impact of child physical and sexual abuse on the cycle of intergenerational violence (Truth and Reconciliation Commission 2015).Note The overall rate of these child-specific sexual offences (per 100,000 inhabitants) was seven times higher in Indigenous communities than elsewhere.Note
Children under age 18 accounted for one-third (33%) of the population in the Indigenous communities in this study compared to 19% in non-Indigenous communities. When controlling for age, then, the rate of these sexual violations against children (per 100,000 children) in Indigenous communities was four times higher than in non-Indigenous communities, with the highest rates for victims aged 12 to 17.Note Most incidents of sexual violations against children were for sexual interference, which accounted for 88% of incidents of sexual violations against children in Indigenous communities. In contrast, 68% of sexual violations against children in non-Indigenous communities were sexual interference. In non-Indigenous communities which may have greater access to the Internet, a much higher proportion of these crimes were for luring a child by means of telecommunication (17% versus 4% in Indigenous communities).
Start of text box 3
Text box 3
The nature of
homicides in Indigenous communities was notably different from homicides in
non-Indigenous communities
Homicides in Indigenous communities often perpetrated by a family member, rarely by a stranger
This study was also able to look at detailed characteristics of homicides in predominantly Indigenous populations using information from the Homicide Survey. In 2018, the Indigenous communities in this study reported 59 homicides, resulting in a rate about eight times higher in Indigenous communities than in non-Indigenous communities (13.4 versus 1.6 homicides per 100,000 population).Note
Victims of homicides in Indigenous communities were more often female (36%) compared to victims in non-Indigenous communities (24%). The median age of victims was slightly younger in Indigenous communities (32 vs. 34 years).
Individuals accused of homicide in 2018 were slightly older in Indigenous communities (median age 30 compared to 28 in non-Indigenous communities). As with violent crime generally, when an accused was identified, homicides in Indigenous communities were more likely to be perpetrated by a family member (48% versus 31%) than in non-Indigenous communities. Homicides were rarely committed by a stranger in Indigenous communities (2%, equivalent to one accused, compared to 22% in non-Indigenous communities).Note
Homicides less often pre-meditated in Indigenous communities
In terms of the type of homicide, motives and methods, the nature of homicides reported by police serving majority Indigenous populations was notably different from homicides in non-Indigenous communities. While almost half (48%) of homicides in non-Indigenous communities were first-degree murder (pre-meditated), this was not the case in Indigenous communities where 17% were first-degree murder. Instead, 58% of homicides in Indigenous communities were second-degree murder and another 25% were manslaughter (compared to 41% and 10%, respectively, in non-Indigenous communities). That being said, rates of all types of homicide were higher in Indigenous communities than elsewhere.
Homicides in Indigenous communities were more likely to result from an argument or quarrel or from frustration, anger or despair (70%) than in non-Indigenous communities (48%).Note
In 2018, homicides in Indigenous communities were most commonly committed through beatings (39%), stabbings (35%), or shootings (14%). In contrast, shootings were the most common cause of death for homicides in non-Indigenous communities (42%), while stabbings and beatings accounted for a lower proportion (29% and 17%, respectively). Most (94%) of the individuals accused of homicide in the Indigenous communities in this study had consumed alcohol, drugs or some other substance prior to the incident. This was also the case for many of the accused in non-Indigenous communities.Note
In contrast, homicides in non-Indigenous communities were more likely to be gang-related: For 7% of homicides in non-Indigenous communities (44 homicides), police had evidence that they were gang-related and another 18% (109 homicides) suspected to be gang-related.Note In Indigenous communities, 93% of homicides were recorded as non-gang-related; the other 7% (4 homicides) were suspected to be gang-related.
In 2018, four in five (81%) homicides in Indigenous communities were cleared (solved) by police and three in four homicides (75%) resulted in a criminal charge (compared to 65% cleared in non-Indigenous communities, and 60% of homicides cleared by charge). Accounting for the difference in clearance rates, in both types of community, 92% of cleared (solved) homicides resulted in a charge.
In 2018, the majority of homicide victims (53 out of 59 victims) and of individuals accused of homicide in Indigenous communities (49 out of 54 accused) were identified by police as Indigenous.
It is important to note that the data in this article on homicides in Indigenous communities does not represent all homicides involving Indigenous victims or accused in Canada. More information on all Indigenous homicide victims can be found in Homicide in Canada, 2018 (Roy and Marcellus 2018).
End of text box 3
Clearance and charging rates
Crimes reported by police serving majority Indigenous populations were more likely to be solved and have an accused identified by police
Crimes reported by police serving majority Indigenous populations were more likely to be cleared (solved) and have an accused identified by police. In 2018, about two-thirds (66%) of criminal incidents were cleared in Indigenous communities compared to just over one-third (37%) in non-Indigenous communities. This was partly the result of the high volume of cleared incidents of mischief in Indigenous communities. Apart from these non-violent crimes, clearance rates were also higher in Indigenous communities for violent crime (79% versus 63%) (Table 4).
One possible reason behind this difference is the relative size of the communities served by police because clearance rates for most crimes tend to be higher in small communities where more crimes and information about those crimes come to the attention of police (Hotton Mahony and Turner 2012). The median population served by police in Indigenous communities was less than 1,500 compared to about 9,500 in non-Indigenous communities.
Accused charged less often in Indigenous communities, often because complainant requested that no further action be taken
Once cleared, however, crimes in Indigenous communities were half as likely overall to result in a charge (35%) than those in non-Indigenous communities (70%) in 2018.Note This was the case for most types of crime: violent (58% versus 68%); property (10% versus 59%); and other Criminal Code offences (44% versus 79%). The offences where cleared incidents in Indigenous communities were more likely to result in a charge than in non-Indigenous communities were other federal statutes, Criminal Code traffic offences, and sexual offences.Note
The most frequent reason for an incident to be cleared without a criminal charge was that the complainant requested that no further action be taken, which was proportionally over three times more common in Indigenous communities than non-Indigenous communities (35% versus 10%). Among violent crimes, the complainant requested that no further action be taken in 32% of cleared incidents in Indigenous communities compared to 16% in non-Indigenous communities. Over half (53%) of property offences where an accused was identified were cleared in Indigenous communities as a result of the complainant requesting that no further action be taken (compared to 14% in non-Indigenous communities).
For violent offences where information on victims was available, it was more common for the victim to request that no further action be taken in Indigenous communities than in non-Indigenous communities in almost all incidents.Note However, it was more often the case when the perpetrator was a family member other than a spouse (child, parent, sibling or extended family member) (46% versus 22% in non-Indigenous communities). When it was a friend or casual acquaintance, many victims still requested no further action (42% and 37%, respectively, compared to 25% and 21% in non-Indigenous communities).Note Even when the perpetrator was a stranger, the victim was twice as likely to request that no further action be taken in Indigenous communities (21% versus 12%). In incidents of intimate partner violence, however, where the perpetrator was a spouse or former spouse or other intimate partner, the victim requesting that no further action be taken was less frequent in both types of communities, possibly due to pro-charging policies in domestic violence situations (11% versus 6% in non-Indigenous communities).Note
One factor which might explain the high number of complainants who request that no further action be taken in Indigenous communities is that they do not want their family members to get in trouble with the law or they prefer to deal with the matter by themselves or within the community rather than through the criminal justice system (Jerome 2019). In addition, the relative remoteness of these Indigenous communities may also play a role. High proportions of uncharged incidents are cleared in this way in the Territories and in remote communities elsewhere, regardless of whether the community was primarily Indigenous.Note Another factor may be that victims do not want to proceed if it means they have to leave their communities to attend court. It may also be the case that there is a greater burden on the victim and their families, both economic and personal, if the perpetrator is charged and has to leave the community for court or incarceration, especially where the accused is a family member, particularly if they are the main provider for their families.
According to the 2014 GSS, among Indigenous victims, when the incident came to the attention of police, only half (49%E) of victims said that they had reported it themselves. It is therefore possible that some of the victims of police-reported crimes in Indigenous communities who did not report the crime themselves may be less likely to cooperate with police. This is reinforced by the fact that, according to the GSS, Indigenous individuals were more likely than non-Indigenous individuals to have not very much or no confidence in the police (Boyce 2016).
Characteristics of individuals accused of crime in Indigenous communities
High rate of individuals accused of crime among older populations in Indigenous communities particularly for mischief and disturbing the peace
There were notable differences in the age profile of individuals accused of crime in Indigenous communities compared to non-Indigenous communities. Historically, rates of accused in Canada have tended to peak in late adolescence and then decline (Allen 2016). Research shows that this inverse relationship between age and criminal activity has been seen in most countries and time periods, with some variations (Ulmer and Steffensmeier 2014). As a result, age has typically been seen as an important factor in rates of crime, and it has often been assumed that the high rates of crime in Indigenous communities can be somewhat explained by the fact that these populations tend to be much younger. However, this was not found to be the case in this study. Instead, the higher rates of accused in 2018 in the Indigenous communities in this study were driven in part by crimes committed by older individuals, specifically mischief and disturbing the peace offences.Note
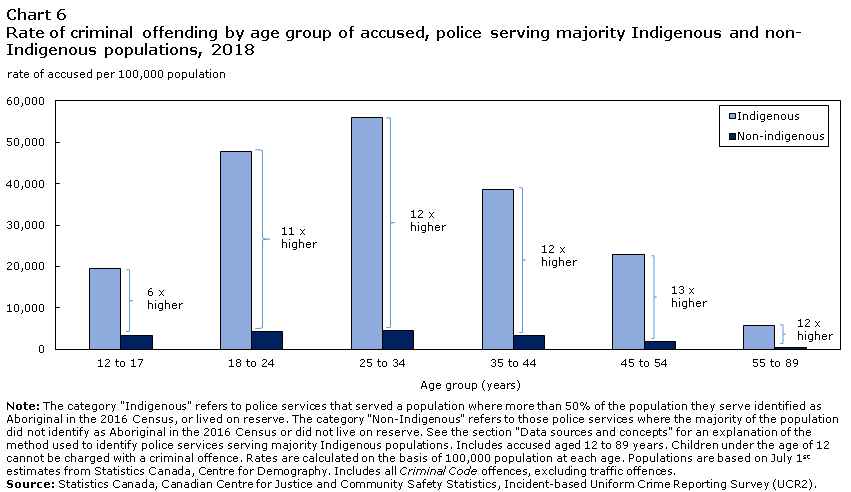
Although rates of individuals accused of crime reported by police serving majority Indigenous populations were notably higher at all ages than in non-Indigenous communities, they show a notable variation from the age-crime relationship seen elsewhere. While rates of youth accused were 6 times higher in Indigenous than in non-Indigenous communities, rates for adult age groups were over 10 times higher. Moreover, rates of accused in Indigenous communities were still higher even among 45 to 54-year olds than among youth (Table 8, Chart 6).
However, it is worth noting that accused rates among youth were higher in Indigenous communities than in non-Indigenous communities.
Chart 6 start
Data table for Chart 6
| Age group (years) | Indigenous | Non-indigenous |
|---|---|---|
| rate of accused per 100,000 population | ||
| 12 to 17 | 19,477 | 3,255 |
| 18 to 24 | 47,862 | 4,389 |
| 25 to 34 | 55,887 | 4,614 |
| 35 to 44 | 38,662 | 3,343 |
| 45 to 54 | 23,005 | 1,829 |
| 55 to 89 | 5,721 | 497 |
|
Note: The category "Indigenous" refers to police services that served a population where more than 50% of the population they serve identified as Aboriginal in the 2016 Census, or lived on reserve. The category "Non-Indigenous" refers to those police services where the majority of the population did not identify as Aboriginal in the 2016 Census or did not live on reserve. See the section "Data sources and concepts" for an explanation of the method used to identify police services serving majority Indigenous populations. Includes accused aged 12 to 89 years. Children under the age of 12 cannot be charged with a criminal offence. Rates are calculated on the basis of 100,000 population at each age. Populations are based on July 1st estimates from Statistics Canada, Centre for Demography. Includes all Criminal Code offences, excluding traffic offences. Source: Statistics Canada, Canadian Centre for Justice and Community Safety Statistics, Incident-based Uniform Crime Reporting Survey (UCR2). |
||
Chart 6 end
Mischief and disturbing the peace most common crime committed by older accused
Less serious offences explained some of the high crime rates among the older age groups. In particular, the rate of non-violent offences (property and “other Criminal Code offences”) was notably high among 45 to 54 year olds in Indigenous communities primarily as a result of high rates of mischief and disturbing the peace in those age groups.
Rates of mischief and disturbing the peace were notably high among older age groups in Indigenous communities. In fact, while mischief and disturbing the peace accounted for 34% of youth crime in Indigenous communities, this proportion increased with age, representing 57% of crime committed by 45 to 64 year olds. In non-Indigenous communities, these offences accounted for 12% of youth crime, a proportion which changed little by age (15% by age 45 to 64).
These high accused rates among older populations, particularly mischief and disturbing the peace, may be partly explained by differences in risk factors for youth and older Indigenous populations, such as having experienced child maltreatment (including experience in residential schools), which is associated with mental health issues, substance use and increased contact with police (Boyce et al. 2015). Recent studies have noted that while there were large differences in rates of child maltreatment among older Indigenous people relative to their non-Indigenous counterparts—this difference was not present among the younger population. Among younger people between the ages of 15 to 29 years, no statistically significant differences were found between Indigenous and non-Indigenous individuals in terms of having suffered physical and/or sexual abuse before the age of 15 (24% and 23%). Instead, differences in the prevalence of child abuse were found only for those aged 30 or above: Indigenous people in this older age group were considerably more likely than their non-Indigenous counterparts to have been victimized as children (48% versus 31%) (Burczycka 2017).
In addition, possibly related to this difference in childhood trauma, health indicators show that First Nations (off-reserve) and Inuit populations were more likely to report heavy drinking than non-Indigenous populations.Note However, this was the case only for older drinkers 25 to 44 years old and 45 years and older. There was no significant difference in the rate of heavy drinking for youth and young adults (aged 12 to 24) (Statistics Canada n.d. b). This is notable as alcohol use is associated with criminal behaviour (Pernanen et al. 2002).
Other factors may also explain high accused rates for older populations in these communities. Research suggests that life transitions such as completing education, getting a steady job and starting a family are tied to an “ageing out” of criminal behaviour. However, involvement in the justice system—particularly incarceration and long sentences—has been shown to disrupt these transitions into the adult roles associated with desistence from crime and is associated with repeat offending (Massoglia and Uggen 2010). In addition, incarceration increases contact with a criminalized peer group and can aggravate mental health issues (Holman and Zeidenburg 2013).
Rate of females accused of crime higher in Indigenous communities relative to non-Indigenous communities
Previous research has drawn attention to the over-representation of Indigenous women in correctional services (Malakieh 2019). Similarly, the police-reported data in this analysis showed that females accounted for a greater proportion of those accused of crime in Indigenous communities compared to non-Indigenous communities (31% compared to 25%). As a result, while the accused rate among males was 11 times higher in Indigenous communities than in non-Indigenous communities, it was 16 times higher for females. The rate of females accused was higher in Indigenous communities for all categories of crime. As with accused overall, this was driven by high rates among older individuals as the age-crime curve for females in Indigenous communities was very similar to that of males.
Start of text box 4
Text box 4
Measuring over-representation
of Indigenous offenders in the correctional system
There has been much discussion about the over-representation of Indigenous peoples in the criminal justice system and particularly in correctional services. Unfortunately, current data on correctional services do not support an examination of the corrections experiences of offenders from the Indigenous communities in this analysis.
Information on admissions to correctional services have been used to provide an indication of Indigenous over-representation. However, this data does not actually provide a measure of how many individuals are in corrections at a certain point in time. Instead admissions are counted each time an individual begins or moves to a new type of custody or community supervision. The same person can therefore be included several times in the admissions counts whenever the individual moves from one type of supervision to another, thereby providing an indication of the flow of persons through the correctional system. The amount of this activity may differ for Indigenous and non-Indigenous offenders.
The development of the new Canadian Correctional Services Survey (CCSS) will allow Statistics Canada to produce better, and more detailed indicators on individuals in correctional services, as well as improved statistics on the overrepresentation of Indigenous persons in the Canadian correctional system. Statistics Canada also plans to release a Juristat in 2021 focused on overrepresentation of Indigenous persons in correctional services.
End of text box 4
Summary
To build on existing research and shed more light on crime experienced in Indigenous communities, this study examined the nature and extent of crime reported by the relatively small subset of police services and detachments that serve a population where more than 50% of residents were Indigenous. The rates of police-reported crime experienced in these communities in 2018 were typically very high compared to crime in non-Indigenous communities. Much of this difference can be attributed to high rates of mischief and disturbing the peace, offences which may be more likely to come to the attention of police in smaller communities. Rates of these offences may also be affected by differences in police practices with respect to the availability and use of provincial violations and municipal by-laws for this type of behaviour.
Studies have demonstrated that crime and victimization are often associated with mental health issues, alcohol misuse, intergenerational trauma, and adverse socioeconomic conditions, all of which are more frequent among Indigenous populations.
It is worth noting that, unlike non-Indigenous communities where the highest rates of individuals accused of crime are limited to youth and young adults, accused rates in Indigenous communities in this study were higher among adults than youth. This may be related to higher levels of risk factors among the older Indigenous population, including childhood trauma, residential school experiences, and the effects associated with these such as mental health and substance use issues.
The method used in this study to identify police services serving majority Indigenous populations provides a way to broaden statistical understanding of crime experienced among a selected group of predominantly indigenous communities. In the future, other new research methods that link data from multiple sources (such as police, courts, corrections as well as the Census, health data and other sources) could also improve our understanding of crime in these communities as well as the experiences of Indigenous individuals with the criminal justice system.
Detailed data tables
Data sources and concepts
The Uniform Crime Reporting (UCR) Survey
The UCR Survey was developed in 1962 with the cooperation and assistance of the Canadian Association of Chiefs of Police. UCR Survey data reflects reported crime that has been substantiated through police investigation from all separate federal, provincial, and municipal police services in Canada. There are currently two versions of the UCR Survey: aggregate and incident-based microdata.
Uniform Crime Reporting (aggregate) Survey
The aggregate UCR Survey includes the total number of offences, by most serious violation, reported by police in the survey year. It also includes a count of offences cleared by charge or cleared otherwise and persons charged (by gender and by adult/youth breakdown) during the survey year. It does not include victim or incident characteristics. Coverage of the UCR Survey in 2018 was at 99.9% of the caseload of all police services in Canada. Data does not reflect revisions to 2018 data published in October 2020.
Incident-based Uniform Crime Reporting (UCR2) Survey
The Incident-based UCR2 Survey captures detailed information on individual criminal incidents reported to police, including characteristics of victims, accused persons and incidents. Coverage of the UCR2 Survey for 2018 represented 99.6% of the population in Canada. Many of the police services not reporting to the UCR2 are First Nations services, many of which are in Quebec. Overall, the data from the UCR2 survey for 2018 covers 90% of the police services identified as serving Indigenous populations and 85% of the population. Data does not reflect revisions to 2018 data published in October 2020.
Homicide Survey
The Homicide Survey collects police-reported data on the characteristics of all homicide incidents, victims and accused persons in Canada. Whenever a homicide becomes known to police, the investigating police service completes the survey questionnaires, which are then sent to Statistics Canada. There are cases where homicides become known to police months or years after they occurred. These incidents are counted in the year in which they become known to police. For incidents involving more than one accused, only the relationship between the victim and the closest accused is recorded.
Indigenous identity is reported by police to the Homicide Survey and is determined through information found with the victim or accused person, such as status cards, or through information supplied by victims' or accused persons' families, the accused persons themselves, community members, or other sources (i.e., such as band records). Forensic evidence such as genetic testing results may also be an acceptable means of determining the Indigenous identity of victims.
Most serious violation: Criminal incidents are categorized by the most serious violation occurring in the police-reported incident. One incident can involve multiple offences. Counts presented in this article are based upon the most serious offence in the incident as determined by a standard classification rule used by all police services.
Provincial North: Provincial North encompasses the northern regions of Newfoundland and Labrador, Quebec, Ontario, Manitoba, Saskatchewan, Alberta and British Columbia. South refers to the southern regions of these provinces as well as Prince Edward Island, Nova Scotia and New Brunswick.
Rural: Rural police services are those where the majority of the population lives outside of a census metropolitan area (CMA) or census agglomeration (CA). Urban police services are those where the majority of the population lives within a CMA or CA. A CMA or a CA is formed by one or more adjacent municipalities centered on a population centre (known as the core). A CMA must have a total population of at least 100,000 of which 50,000 or more must live in the core. A CA must have a core population of at least 10,000. To be included in the CMA or CA, other adjacent municipalities must have a high degree of integration with the core as measured by commuting flows derived from previous census place of work data, where 50% or more of the population commutes into the core. It should be noted that information was not available for all police services to determine whether they were rural or urban.
Remote: Communities are classified as remote based on a remoteness index that takes into account distance and access to larger population centers and selected services such as health services, social assistance, banking and legal services, and retail (Alasia et al. 2017). For this analysis, a police service is considered remote where the majority of the population served lives in a CSD with a remoteness index of 0.4 or greater. It should be noted that information was not available for all police services to determine whether they were remote.
Detailed method for identifying police services serving majority Indigenous populations (“Indigenous communities”)
A police service is identified as serving a majority Indigenous population if over 50% of the current year population (ex. 2018) can be estimated to be Indigenous. The Indigenous population served is based on information on the Census subdivisions (CSDs or portions thereof) served by the police service or detachment. Estimated Indigenous populations for each CSD are calculated as follows and then rolled up to the police service level.
The total Indigenous population referred to here is the estimate of individuals living on reserve (CSD) plus an estimate of the population in non-reserve CSDs (or portion of the CSD served) based on the proportion who identified as First Nations people, Métis or Inuit in the 2016 Census of Population. This approach adjusts for the fact that some reserve populations did not respond to the 2016 Census. Using only information on Aboriginal identity from the 2016 Census, these police services served 20% of the total First Nations people, Métis and Inuit population. It should be noted that this estimate does not take into account any differential population growth over the period between 2016 and 2018 nor does it take into account small non-Indigenous populations living on reserve. However, information was provided by Statistics Canada’s Centre for Indigenous Statistics and Partnerships to identify reserve CSDs where non-Indigenous populations are considerable (such as in the British Columbia Lower Mainland). These were excluded from the reserve-based identification of Indigenous populations.
The sensitivity of the 50% cut-off is small is expected to have only limited impact. Most of the police services in the study served populations with high proportions of Indigenous residents. Only a few police services were close to the 50% cut-off and had small populations: 7 police services served populations that were between 50% and 55% Indigenous, and represented 6% of the total population served by police services serving majority Indigenous populations in this study. Similarly, 9 police services fell just below the cut-off, serving populations that were between 45% and 50% Indigenous. If they had been included above the cut-off they would have accounted for 7% of the total population served by police services serving majority Indigenous populations in this study.
Indigenous population of police services classified as serving majority Indigenous populations (“Indigenous communities”)
Overall, 88% of the population served by police services classified as serving predominantly Indigenous populations identified as First Nations people, Métis or Inuit, or lived on a reserve, according to the 2016 Census of Population. As shown in the table below, the proportion of the population estimated to be Indigenous varies by jurisdiction for both types of police service.
Preliminary analysis carried out in the development of the method for identifying police services serving majority Indigenous populations showed that it was not feasible to carry out analysis distinguishing First Nations, Métis and Inuit communities. There were not enough police services identified as serving majority Métis populations to provide reliable analysis. Moreover, outside of Nunavut, there were also insufficient numbers of police services identified as serving Inuit communities to support analysis.
It is worth noting that all police services in Nunavut serve majority Inuit populations. Data for Nunavut is available in Table 1, Table 3, and Table 5 of this report. Most of the police services identified as serving majority Indigenous populations outside of Nunavut served majority First Nations populations.
| Province or Territory | Police services serving majority Indigenous populations | Police services serving majority non-Indigenous populations |
|---|---|---|
| percent | ||
| Newfoundland and Labrador | 96 | 8 |
| Prince Edward Island | Note ...: not applicable | 2 |
| Nova Scotia | 100 | 5 |
| New Brunswick | 100 | 4 |
| Quebec | 100 | 2 |
| Ontario | 94 | 2 |
| Manitoba | 88 | 13 |
| Saskatchewan | 85 | 13 |
| Alberta | 77 | 6 |
| British Columbia | 71 | 6 |
| Yukon | 75 | 20 |
| Northwest Territories | 81 | 25 |
| Nunavut | 91 | Note ...: not applicable |
| Canada | 88 | 4 |
|
... not applicable Note: The total Indigenous population referred to here is the estimate of individuals living on reserve plus the proportion of the population in non-reserve Census subdivisions (CSDs) who identified as First Nations, Métis or Inuit in the 2016 Census of Population (see above). Source: Statistics Canada, Canadian Centre for Justice and Community Safety Statistics, Uniform Crime Reporting Survey. |
||
The police services in this study are not representative of police serving the majority of the Indigenous population in Canada. Overall, the 182 police services in this study served 21% of the Canadian population that identified as First Nations people, Métis or Inuit, or who lived on reserve, according to the 2016 Census. The vast majority of Indigenous individuals in Canada are served by a “non-Indigenous” police service as defined by this study. Coverage of the Indigenous population by police services varied considerably by jurisdiction.
| Province or Territory | percent |
|---|---|
| Newfoundland and Labrador | 16 |
| Prince Edward Island | Note ...: not applicable |
| Nova Scotia | 10 |
| New Brunswick | 9 |
| Quebec | 32 |
| Ontario | 16 |
| Manitoba | 31 |
| Saskatchewan | 26 |
| Alberta | 13 |
| British Columbia | 8 |
| Yukon | 23 |
| Northwest Territories | 77 |
| Nunavut | 100 |
| Canada | 21 |
|
... not applicable Note: The total Indigenous population referred to here is the estimate of individuals living on reserve plus the proportion of the population in non-reserve Census subdivisions (CSDs) who identified as First Nations, Métis or Inuit in the 2016 Census of Population (see above). Source: Statistics Canada, Canadian Centre for Justice and Community Safety Statistics, Uniform Crime Reporting Survey. |
|
No information available specific to crimes committed on reserve:
This study does not provide measures of crime committed on reserve as opposed to in off-reserve locations. Although a large proportion of the population living on reserve are included in the Indigenous communities in this analysis, 30% of Canada’s reserve population are served by non-Indigenous police services.Note
Because the UCR is collected from police services, it is not able to provide specific measures of crime occurring on reserve. While this study was able to identify police services which serve reserve populations, and can estimate the percentage of the population living on reserve (using 2016 Census of Population data), the UCR does not have sufficient information to identify where crimes occurred (on or off reserve). This is particularly relevant to smaller First Nations communities/villages where the population lives both on and off reserve within the same community boundaries and is served by the same police force.
Overall, 62% of the population served by the 182 police services and detachments identified as serving majority Indigenous populations lived on reserve.
References
Ad Hoc Federal-Provincial-Territorial Working Group. 2003. Final Report of the Ad Hoc Federal-Provincial-Territorial Working Group Reviewing Spousal Abuse Policies and Legislation. Report prepared for Federal-Provincial-Territorial Ministers responsible for Justice.
Aguiar, William and Regine Halseth. 2015. Aboriginal Peoples and Historic Trauma: The Processes of Intergenerational Transmission. National Collaborating Centre for Aboriginal Health. Prince George, BC.
Alasia, Alessandro, Frédéric Bédard, Julie Bélanger, Eric Guimond and Christopher Penney. 2017. Measuring Remoteness and Accessibility – A Set of Indices for Canadian Communities. Statistics Canada Catalogue no. 18-001-X.
Allen, Mary. 2016. “Youth crime in Canada, 2014.” Juristat. Statistics Canada Catalogue no. 85-002-X.
Allen, Mary and Samuel Perreault. 2015. “Police-reported crime in Canada’s Provincial North and Territories, 2013.” Juristat. Statistics Canada Catalogue no. 85-002-X.
Anderson, Thomas. 2015. “The social determinants of higher mental distress among Inuit.” Aboriginal People Survey 2012. Statistics Canada Catalogue no. 89-653-X.
April, Sébastien and Mylène Magrinelli Orsi. 2013. Gladue Practices in the Provinces and Territories. Department of Justice Canada. Ottawa.
Barnett, Laura, Maxime Charron-Tousignant, Tanya Dupuis, Julia Nicol, Dominique Valiquet and Julian Walker. May, 7 2018. Legislative Summary of Bill C-75: An Act to amend the Criminal Code, the Youth Criminal Justice Act and Other Acts and to Make Consequential Amendments to other Acts. Publication No. 42-1-C75-E. Parliamentary Information and Research Service. Library of Parliament. Ottawa.
Boksa, P., Joober, R., and Kirmayer, L. J. 2015. “Mental wellness in Canada's Aboriginal communities: striving toward reconciliation.”Journal of Psychiatry & Neuroscience.
Boyce, Jillian. 2016. “Victimization of Aboriginal people in Canada, 2014.” Juristat. Statistics Canada Catalogue no. 85-002-X.
Boyce, Jillian, Cristine Rotenberg and Maisie Karam. 2015. “Mental health and contact with police in Canada, 2012.” Juristat. Statistics Canada Catalogue no. 85-002-X.
British Columbia, Public Safety and Solicitor General. 2020. BC Gov News. “Ministers statement on police act reform.” June 12, 2020.
Burczycka, Marta. 2017. “Profile of Canadian adults who experienced childhood maltreatment.” In “Family violence in Canada: A statistical profile, 2015.” Juristat. Statistics Canada Catalogue no. 85-002-X.
Canada. Parliament. 2020a. Debates of the Senate, 43rd Parl, 1st Sess, Vol. 151, Issue 22. June 16, 2020.
Canada. Parliament. 2020b. Debates of the Senate, 43rd Parl, 1st Sess, Vol. 151, Issue 27. June 25, 2020.
Capobianco, Laura and Margaret Shaw. 2003. Crime Prevention and Indigenous Communities: Current International Strategies and Programmes. International Centre for the Prevention of Crime.
Carrière, Gisèle M., Evelyne Bougie and Dafna Kohen. 2018. “Acute care hospitalizations for mental and behaviour disorders among First Nations people.” Health Reports. Statistics Canada Catalogue no. 82-003-X.
Charron, Mathieu, Christopher Penney and Sacha Senécal. 2010. “Police-reported crime in Inuit Nunangat.” Crime and Justice Research Paper Series. Statistics Canada Catalogue no. 85-561-M.
Coady, Kyle. 2018. “Assessments and analyses of Canada’s bail system.” Research in Brief. Department of Justice Canada. Ottawa.
Dandurand, Yvon and Annette Vogt. 2017. Documenting the Experience and the Successes of First Nations Courts in British Columbia. International Centre for Criminal Law Reform and Criminal Justice Policy & School of Criminology and Criminal Justice, University of the Fraser Valley.
Deshman, Abigail C. and Nicole Myers. 2014. Set Up To Fail: Bail and the Revolving Door of Pre-Trial Detention. Canadian Civil Liberties Association.
Doucet, Melanie and Harrison (Harri Sun) Pratt. 2018. “Breaking the cycle for ‘crossover youth.” Policy Options. IRPP.
Holman, Barry and Jason Ziedenberg. 2006. The Dangers of Detention: The Impact of Incarcerating Youth in Detention and Other Secure Facilities. Justice Policy Institute. Washington, DC.
Hotton Mahony, Tina and John Turner. 2012. “Police-reported clearance rates in Canada, 2010.” Juristat. Statistics Canada Catalogue no. 85-002-X.
Jerome, Amanda. 2019. “Indigenous peoples often prefer to deal with conflict resolution within own communities.” The Lawyer’s Daily. January 3, 2019.
Kumar, Mohan B. and Amy Nahwegahbow. 2016. “Past year suicidal thoughts among off-reserve First Nations, Métis and Inuit adults aged 18 to 25: Prevalence and associated characteristics.” Aboriginal Peoples Survey. Statistics Canada Catalogue no. 89-653-X.
Lithopoulos, Savvas and Rick Ruddell. 2011. “Policing isolated aboriginal communities: Perspectives of Canadian officers.” Policing: An international Journal of Police Strategies & Management. Vol. 34, no. 3.
Malakieh, Jamil. 2019. “Adult and youth correctional statistics in Canada, 2017/2018.” Juristat. Statistics Canada Catalogue no. 85-002-X.
Massoglia, Michael and Christopher Uggen. 2010. “Settling down and aging out: Toward an interactionist theory of desistance and the transition to adulthood.” American Journal of Sociology. Vol. 116, no. 2.
Missing and Murdered Indigenous Women and Girls. 2019. Reclaiming Power and Place: The Final Report of the National Inquiry into Missing and Murdered Indigenous Women and Girls.
Nelson, S. E., and Wilson, K. 2017. “The mental health of Indigenous peoples in Canada: A critical review of research.”Social Science & Medicine.
Office of the Correctional Investigator. 2020. “Indigenous People in Federal Custody Surpasses 30%: Correctional Investigator Issues Statement and Challenge.” News Release. January 21, 2020.
Oliver, Lisa N., Chris Penney and Paul A. Peters. 2016. “The influence of community well-being on mortality among Registered First Nations people.” Health Reports. Statistics Canada Catalogue no. 82-003-X.
Ontario Human Rights Commission. 2018. Interrupted Childhoods: Over-Representation of Indigenous and Black Children in Ontario Child Welfare.
Pernanen, Kai, Marie-Marthe Cousineau, Serge Brochu and Fu Sun. 2002. “Proportions of crimes associated with alcohol and other drugs in Canada.” Canadian Centre on Substance Abuse.
Perreault, Samuel. 2019. “Police-reported crime in rural and urban areas.” Juristat. Statistics Canada Catalogue no. 85-002-X.
Perreault, Samuel. 2015. “”Criminal victimization in Canada, 2014.” Juristat. Statistics Canada Catalogue no. 85-002-X.
R. v. Antic. 2017. SCC 27, [2017] 1 SCR. 509.
R. v. Gladue. 1999. 1 SCR 688.
R. v. Ipeelee. 2012. SCC 13, [2012] 1 SCR 433.
Reavis, James A., Jan Looman, Kristina A. Franco and Briana Rojas. 2013. “Adverse childhood experiences and adult criminality: How long must we live before we possess our own lives?” The Permanente Journal. Vol. 17, no. 2.
Rotenberg, Cristine. 2019. “Police-reported violent crimes against young women and girls in Canada’s Provincial North and Territories, 2017”. Juristat. Statistics Canada Catalogue no. 85-002-X.
Rotenberg, Cristine. 2012. “Social determinants of health for the off-reserve First Nations population, 15 years of age and older, 2012.” Aboriginal People Survey. Statistics Canada Catalogue no. 89-653-X.
Roy, Joel and Sharon Marcellus. 2018. “Homicide in Canada, 2018.” Juristat. Statistics Canada Catalogue no. 85-002-X.
Statistics Canada. No date a. Canadian Community Crime Tracker. Statistics Canada Catalogue no. 71-604-X.
Statistics Canada. No date b. Table 13-10-0457-01 Health Indicators, by Aboriginal identity, Four-year Period Estimates.
Truth and Reconciliation Commission of Canada. 2015. Truth and Reconciliation Commission of Canada: Calls to Action. Winnipeg, Man.
Ulmer, Jeffery and Darrell Steffensmeier. 2014. “The age and crime relationship: Social variation, social explanations.” The Nurture Versus Biosocial Debate in Criminology: On the Origins of Criminal Behavior and Criminality. Beaver, Barnes and Brian Boutwell (Eds.). Sage Publications Ltd. London.
- Date modified: