
Gender-based violence: Sexual and physical assault in Canada’s territories, 2018

Archived Content
Information identified as archived is provided for reference, research or recordkeeping purposes. It is not subject to the Government of Canada Web Standards and has not been altered or updated since it was archived. Please "contact us" to request a format other than those available.
by Samuel Perreault, Canadian Centre for Justice and Community Safety Statistics
Highlights
- Approximately one-third of territory residents (35% of women and 31% of men) reported they had been victims of physical or sexual assault before the age of 15. Just over half of territory residents had been victimized since the age of 15 (52% of women and 54% of men), and 8% (both women and men) had been victimized in the 12 months preceding the Survey of Safety in Public and Private Spaces (SSPPS).
- In the territories, women were three times more likely than men to have been victims of sexual assault in their lifetime and six times more likely to have been in the 12 months preceding the survey. However, men were more likely to have been victims of physical assault in their lifetime.
- LGBTQ2+ women and women with a physical or mental disability were more likely than other women to have been victims of sexual assault in their lifetime.
- In the territories, individuals subjected to harsh parenting or who experienced violence in their childhood were more likely to report having been the victim of at least one physical or sexual assault since the age of 15 than those who did not have these experiences in their childhood.
- Compared with women who had not been victims of physical or sexual assault since the age of 15, women who had experienced such an assault were about three times more likely to report having poor mental health and having used alcohol in a problematic way. They were also about twice as likely to have used cannabis or to have ever been homeless.
- The majority of victims who had experienced physical or sexual assault in the 12 months preceding the survey said that the perpetrator was a man. While men victims of physical assault were primarily assaulted by one or more strangers, most of the women were assaulted by people they knew.
- About one-third of physical assault victims and 13% of sexual assault victims said that the most serious incident of victimization in the 12 months preceding the survey had been reported to police.
- Overall, the majority of territory residents had positive attitudes toward gender equality and disapproved of gender-based violence. However, women were slightly more likely than men to have such attitudes.
Canada recognizes the right to equality and the right to live in security for all. However, many people in Canada experience certain forms of violence because of their gender,Note how they express that gender identity or how it is perceived, which is defined as gender-based violence (Women and Gender Equality Canada 2020). Gender-based violence encompasses a range of behaviours, not all of which meet the threshold of criminal behaviour. Although gender-based violence can be interpersonal, it can also express itself and be rooted in structures and social systems (Jewkes et al. 2014, Fleming et al. 2015). As such, it is important to measure the entire continuum of gender-based violence, including violent victimization experiences throughout people’s lives, their experiences of unwanted sexual behaviours and online victimization, as well as their attitudes toward certain stereotypes. While unwanted sexual behaviours were examined in a previous study, this Juristat article presents results pertaining to sexual and physical assault, as well as attitudes toward and beliefs about gender-based violence.
The likelihood of experiencing violent behaviour is not the same for every person across the country. Previous studies have shown that women and LGBTQ2+Note people are more likely to experience sexual assault than men and non-LGBTQ2+ people (Jaffray 2020; Conroy 2018; Perreault 2015). In particular, women and girls living in the territories experience a disproportionate number of violent crimes (Rotenberg 2019; Perreault and Simpson 2016). Several studies have also highlighted victimization rates among First Nations, Métis and InuitNote women, who account for a significant proportionNote of women in the territories (Boyce 2016; Brennan 2011; Perreault 2011). A recent study also found a higher prevalence of violent victimization among Indigenous LGBTQ2+ people (Jaffray 2020). Furthermore, the final report of the National Inquiry into Missing and Murdered Indigenous Women and Girls revealed that persistent and deliberate human and Indigenous rights violations and abuses are the root cause behind Canada’s high rates of violence against Indigenous women, girls and 2SLGBTQQIA people (Missing and Murdered Indigenous Women and Girls 2019).
In addition to an increased risk of victimization, victims of violence in remote or isolated areas face additional challenges because of their geographic location. A United Nations report identified various contextual elements that exacerbate the issues of violence faced by women and young girls in the territories. These elements included easy access to weapons; little access to legal services; limited public transit and daycare services; economic difficulties and poverty; little access to services for women (e.g., women’s shelters, mental health services); barriers to maintaining the confidentiality of reports of abuse; and social, cultural and psychological isolation (United Nations Office of the High Commissioner for Human Rights 2019).
In 2018, Statistics Canada conducted the Survey of Safety in Public and Private Spaces (SSPPS), with the goal of collecting more data to deepen our knowledge of gender-based violence in Canada.Note The SSPPS is part of Canada’s Strategy to Prevent and Address Gender-Based ViolenceNote and will provide the government with the relevant, timely and representative data required to implement the strategy.
Measuring gender-based violence can be complex. Those experiencing violence and those perpetrating it may not perceive its underlying causes and motivations, which can be rooted in a culture that perpetuates gender inequalities (Jewkes et al. 2014). SSPPS respondents were therefore invited to share their experiences and the contextual elements of these experiences to enable these events to be analyzed in terms of gender-based violence. Unlike previous victimization surveys that were generally limited to recent criminal acts, the SSPPS makes it possible to measure the entire continuum of gender-based violence, by including violent victimization experiences throughout people’s lives, their experiences of unwanted sexual behaviours and online victimization, as well as their attitudes toward certain stereotypes.
In addition to the present report, Statistics Canada’s Canadian Centre for Justice and Community Safety Statistics has also published a report with the first results from the SSPPS for the provinces (Cotter and Savage 2019) and a report on unwanted sexual behaviours in the territories (Perreault 2020). The present report, a complement to these two previous reports, presents the first SSPPS results on territory residents’ experiences of physical and sexual assault, as well as attitudes and beliefs about gender-based violence. Results are based on responses from more than 2,500 people, who were each assigned a weight so as to be representative of the entire population aged 15 and older living in the territories. This article takes a gender-based approach by comparing results between genders and, where possible, taking into account the intersection of various other characteristics.
Sexual and physical assault experiences among territory residents since the age of 15
Since criminal victimizationNote is not always brought to the attention of police, self-reported surveys are an essential tool in learning more about the nature and prevalence of victimization in Canada. The SSPPS in the territories asked respondents to report the physical and sexual assault they experienced since the age of 15, whether they reported the incident to the police or not. Because of the specific nature of intimate partner violence, these assaults were measured separately and the results will be published at a later date. Therefore, the estimates presented in the next sections exclude violence perpetrated by spouses or intimate partners.
Start of text box 1
Text box 1
Measuring violent victimization in the Survey of Safety in Public and
Private Spaces
Self-reported surveys are an important complement to official police-reported crime data, as the majority of violent victimizations are never brought to the attention of police. Statistics Canada has been measuring self-reported violent victimization in Canada since the early 1990s, using the General Social Survey (GSS) on the Safety of Canadians (Victimization). Several cycles of the GSS have been conducted since 1993, and significant additions have been made over the years, including questions on domestic violence and criminal harassment adapted from the 1993 Violence Against Women Survey.
The Survey of Safety in Public and Private Spaces (SSPPS) was developed to build on the knowledge base from the GSS and to increase knowledge about gender-based violence in Canada. To that end, a significant number of questions and concepts similar to those in the GSS were integrated in the SSPPS, while expanding, adding and revising sections to fill gaps in terms of knowledge about gender-based violence in Canada.
The SSPPS also measures victimization since the age of 15, which the GSS does not measure. The following five questions on experiences of physical and sexual assault since the age of 15 are included in the SSPPS:
Physical assault:
- Since you were 15, have you been attacked by anyone; that is, anything from being threatened, hit, slapped, pushed or grabbed, to being shot or beaten?
- Since you were 15, has anyone threatened to hit or attack you, or threatened you with a weapon?
Sexual assault:
- Since you were 15, has anyone ever touched you against your will in any sexual way; that is, anything from unwanted touching or grabbing, to kissing or fondling?
- Since you were 15, has anyone, including family and non-family, forced you or attempted to force you into any unwanted sexual activity by threatening you, holding you down or hurting you in some way?
- Since you were 15, has anyone subjected you to a sexual activity to which you were not able to consent; that is, were you drugged, intoxicated, manipulated or forced in other ways than physically?
It should be noted that because of the specific nature of spousal violence, it was measured using a broader set of questions. Results on spousal or intimate partner violence will be published at a later date and are excluded from these analyses.
End of text box 1
Nearly 4 in 10 women have been sexually assaulted since the age of 15
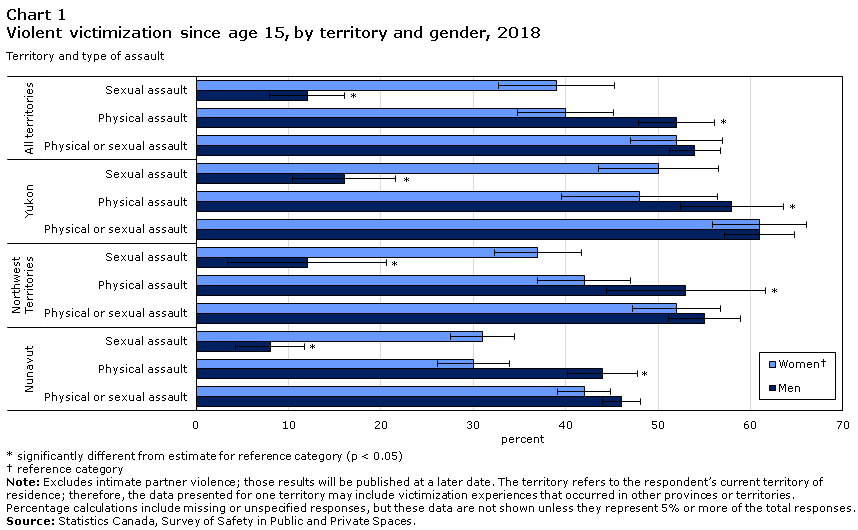
About 50,000 people, or just over half (53%) of territory residents, reported having been the victim of at least one assault, physical or sexual, since the age of 15. Contrary to what was observed in the provinces, where women were slightly more likely to report having been victims of assault at some point in their lives since the age of 15, women (52%) and men (54%) in the territories have been victimized at relatively similar rates, which represents about 24,000 women and 26,000 men (Table 1, Chart 1).
Chart 1 start
Data table for Chart 1
| Territory and type of assault | WomenData tables Note † | Men | Confidence interval | ||
|---|---|---|---|---|---|
| percent | WomenData tables Note † | Men | |||
| All territories | Sexual assault | 39 | 12Note * | 3 | 2 |
| Physical assault | 40 | 52Note * | 4 | 4 | |
| Physical or sexual assault | 52 | 54 | 3 | 4 | |
| Yukon | Sexual assault | 50 | 16Note * | 5 | 4 |
| Physical assault | 48 | 58Note * | 5 | 9 | |
| Physical or sexual assault | 61 | 61 | 5 | 9 | |
| Northwest Territories | Sexual assault | 37 | 12Note * | 5 | 4 |
| Physical assault | 42 | 53Note * | 8 | 6 | |
| Physical or sexual assault | 52 | 55 | 6 | 6 | |
| Nunavut | Sexual assault | 31 | 8Note * | 5 | 3 |
| Physical assault | 30 | 44Note * | 5 | 4 | |
| Physical or sexual assault | 42 | 46 | 6 | 4 | |
Source: Statistics Canada, Survey of Safety in Public and Private Spaces. |
|||||
Chart 1 end
While the proportion of women and men victims is similar overall, there is a notable difference in the type of assault experienced. About three times more women (39%) than men (12%) have been sexually assaulted at least once since the age of 15: about 18,000 women compared with about 6,000 men. In contrast, men (52%) were slightly more likely than women (40%) to have been victims of physical assault: about 25,000 men compared with 18,000 women (Table 1).
Nunavut has the lowest proportion of people who have been assaulted since the age of 15
In each territory, the proportion of women who had been sexually or physically assaulted since the age of 15 was similar overall to that of men. However, in all territories, women were significantly more likely than men to have been victims of sexual assault.
While this overall pattern was consistent across the territories, there were differences between the territories in the proportions of individuals who had experienced at least one assault since the age of 15. For example, according to the SSPPS, Nunavut residents were less likely to report having been victims of at least one assault since the age of 15 (Table 2, Chart 1). These results contrast with police-reported data, for which Nunavut recorded highest rates of major assault and sexual assault among the three territories in 2018 (Moreau 2019).
Specifically, 42% of women and 46% of men in Nunavut had been victims of assault since the age of 15. By comparison, in Yukon, which had the highest proportion of victims, 61% of men and 62% of women reported having been victims of at least one assault since the age of 15.
This trend was also observed for all types of assault. For example, 30% of women and 44% of men living in Nunavut were victims of physical assault at least once since the age of 15, while these proportions where 40% and 52%, respectively, for the territories overall. Similarly, 31% of women and 8% of men in Nunavut were sexually assaulted at least once since the age of 15, compared with 39% and 12% in the territories overall.
The lower prevalence of victimization since the age of 15 was mostly attributable to the relatively low prevalence recorded in Nunavut’s smaller communities. For example, 58% of Iqaluit residents and 56% of Rankin Inlet residents reported having experienced physical or sexual assault since the age of 15, compared with 37% in other Nunavut smaller communities. This trend was seen for both women and men, and for both types of assault. In Yukon and the Northwest Territories, such differences between the capital cities and smaller communities were, however, not noted.
Prevalence of violent victimization higher among people with disabilities
Many previous studies have revealed that people who identify with certain population groups—including LGBTQ2+ individuals, Indigenous people, people with disabilities and young people—are more exposed to criminal victimization (Jaffray 2020; Simpson 2018; Conroy and Cotter 2017; Perreault 2015; Beauchamp 2008), including in the territories (Perreault and Simpson 2016).
SSPPS data on criminal victimization since the age of 15 are nuanced: several minority population groups did have higher-than-average proportions of criminal victimization, while others did not.
For example, higher proportions of victims are observed among women and men with physical or mental disabilities (67% for both women and men) than among women and men without disabilities (42% and 48%, respectively). The trend was the same for each type of assault (Table 3).
LGBTQ2+ women also reported having been assaulted at a higher rate than non-LGBTQ2+ women (70% versus 52%). Similar to what was observed for people with disabilities, the trend was the same regardless of the type of assault. For example, 59% of LGBTQ2+ women reported having been victims of at least one physical assault since the age of 15, and 63% reported having been victims of sexual assault. Among non-LGBTQ2+ women, these proportions were 40% and 39%, respectively.
Previous studies have noted that people identifying with multiple population groups might be more likely to experience violent or inappropriate behaviours (Perreault 2020, Crenshaw 1994), a trend also noted for some people in the territories. For example, 75% of LGBTQ2+ people with a disability were assaulted, physically or sexually, since the age of 15, compared with 45% of non-LGBTQ2+ people with no disability. Similarly, close to two-third (64%) of First Nations women with a disability were sexually assaulted at least once since the age of 15, compared with 38% of non-Indigenous women without any physical or mental disability.
While those identifying with some population groups were more likely to report having been assaulted since the age of 15, others, such as members of population groups designated as visible minorities,Note were less likely. Women and men living in the territories and belonging to a population group designated as a visible minority reported having been victims of assault in proportions (27% and 35%, respectively) that were almost half the proportions for women and men (55% and 56%, respectively) who are not designated as a visible minority. Again, the trend was similar for each type of assault, except for sexual assault among men, where the proportion of victims among those identifying to a population group designated as visible minority was similar to that of those not belonging to a group designated as a visible minority.
Inuit less likely than non-Indigenous people to report having experienced assault since the age of 15
First Nations, Métis and Inuit make up about half of territory residents. In Nunavut, this proportion is higher than 80%. Several studies have found that Indigenous women have higher victimization rates than non-Indigenous women, including in the territories (Perreault and Simpson 2016; Boyce 2016). These higher victimization rates may in part be attributable to various factors related to colonization, including cultural suppression, physical displacement and economic deprivation (Firestone et al. 2015), as well as intergenerational trauma resulting from experiences of abuse and neglect in the residential school system (Elias et al. 2012).
However, in the territories, SSPPS data reveal smaller proportions of Indigenous people (49%) than non-Indigenous people (57%) reporting having been victims of assault since the age of 15. This was mostly attributable to much lower proportions of Inuit women (41%) and men (42%) having been victims of assault (either sexual or physical) than non-Indigenous women and men (56% and 58%, respectively).
This lower prevalence among Inuit is tied with lower rates noted in Nunavut’s smaller communities. In this territory, just over one-third (37%) of Inuit living outside Iqaluit or Rankin Inlet reported having been physically or sexually assaulted since the age of 15. In Iqaluit, this proportion was 50%; a proportion higher than in smaller communities, but still lower than that reported by non-Indigenous Iqaluit residents (66%).
Métis women in the territories were also less likely than non-Indigenous women to report having been victims of sexual assault since the age of 15. However, overall, First Nations women and men (60% and 66%, respectively) and Métis women and men (51% and 45%, respectively) reported having been victims of assault since the age of 15 in proportions relatively similar to non-Indigenous women and men (56% and 58%, respectively).Note
However, it is important to note that results on the victimization of non-Indigenous people differ from what was observed in the provinces (see Cotter and Savage 2019). Among non-Indigenous people, the proportion of those who had been victims of assault since the age of 15 was much higher in the territories than in the provinces (57% of women and 58% of men in the territories, compared with 38% of women and 35% of men in the provinces). By contrast, 55% of Indigenous women and men in the provinces reported having been victims of assault since the age of 15—relatively similar to the proportions recorded among Indigenous people in the territories.
Lastly, some studies have noted that the history of violence resulting from colonization and residential schools may have led to a certain normalization of violence among Inuit women (Brassard et al. 2015; Williams 2019). Therefore, they could be underreporting some old or less serious assaults, particularly since measuring events over someone’s lifetime is especially likely to be affected by recall bias (Sutton 2010; Glasner and van der Wander 2007; Yoshima and Gillepsie 2002; Desai and Saltzman 2001). When more recent assaults (in the 12 months preceding the survey) are considered, 8.4% of Inuit women and 6.9% of non-Indigenous women reported having been victims of assault—however, this difference was not statistically significant.
People who experienced childhood violence or harsh parenting are more likely to be physically or sexually assaulted as adults
Several studies have shown an association between childhood maltreatment and an increased risk of victimization in adulthood (Burczycka and Conroy 2017; Perreault 2015). This association appears to be supported by the SSPPS data, particularly in terms of the likelihood of having been a victim of sexual assault since the age of 15.
For example, among those who had experienced harsh parenting,Note just over half of women (51%) and about one in six men (17%) experienced at least one sexual assault since the age of 15. In contrast, these proportions are 19% and 4%, respectively, among those who had not experienced harsh parenting (Table 3).
The trend was similar for physical assault: twice as many women (49%) and men (61%) who had experienced harsh parenting reported having been victims of physical assault as women (24%) and men (35%) who had not experienced harsh parenting.
Overall, more than three-quarters (76%) of those who had experienced physical or sexual violence during childhood (before the age of 15) and nearly two-thirds (64%) of those who had experienced harsh parenting were victims of at least one assault since the age of 15. These figures are almost identical for women and men.
History of criminal victimization often associated with other social or health issues
It has been noted in the past that criminal victimization is often associated with other social or health issues, such as poor health or binge drinking (Perreault 2015; Andersen et al. 2014; Hughes et al. 2014). The SSPPS data confirm that people who have been physically or sexually assaulted since the age of 15 are more likely to report having experienced (or currently experiencing) some social or health issues. It should be noted, however, that these data do not make it possible to establish a causal link (i.e., it is impossible to determine whether victimization experiences are the cause of other social or health issues (e.g. alcohol or drug use to cope with violence), whether these issues may contribute to greater exposure to violence, or whether victimization and these other issues share the same causes).
More specifically, those who had been victims of assault since the age of 15 were more likely to rate their physical or mental health negatively. Nearly one in five women (19%) who had been assaulted since the age of 15 rated their physical health as fair or poor, compared with 12% of women who had never been assaulted. The difference was even more pronounced for mental health (27% compared with 10%).
Similarly, almost one-third (31%) of women victims reported that their drinking had been a source of problems with others, and a similar proportion (32%) had previously been homeless. Among women who had never been victims of assault, these proportions were 12% and 14%, respectively. Of note, these proportions were almost identical regardless the type of assault (Table 4).
For men, the trend was similar, although there was little difference in physical health status. Men who had been assaulted were nevertheless much more likely than men who had not been assaulted to have used alcohol in ways that caused problems with others, to have used illicit drugs in the past year, or to have been previously homeless.
Sexual and physical assault experiences among territory residents in the 12 months preceding the survey
In addition to measuring criminal victimization since the age of 15, the SSPPS asked respondents about their experiences of sexual and physical assault in the 12 months preceding the survey.
Women six times more likely than men to have been sexually assaulted
Overall, approximately 7,300 residents of the territories aged 15 and older (7.8% of territory residents) reported having experienced at least one sexual or physical assault in the 12 months preceding the survey. This proportion was identical for women and men (Table 1).
Among the two types of assault, physical assault was more frequently reported by both women (5.5%) and men (7.2%). Sexual assault was reported slightly less often, especially among men. Specifically, 3.6% of women reported having been sexually assaulted in the 12 months preceding the survey, a proportion six times higher than that for men (0.6%).
Single youth, LGBTQ2+ people and people with disabilities are at higher risk of assault
As was the case for victimization since the age of 15, certain people were more likely to have experienced criminal victimization in the 12 months preceding the survey. For example, youth aged 15 to 24 were roughly three times more likely than people aged 45 and older to report having been victims of physical or sexual assault in the 12 months preceding the survey (13.9% compared with 4.3%). These proportions were relatively similar for both women (14.6% compared with 3.7%) and men (13.1% compared with 4.9%). Similarly, single individuals, many of whom are also youth, were also about three times more likely than people who are married or in a common-law relationship to have been physically or sexually assaulted (14.0% compared with 4.8%) (Table 5).
Although this trend was observed for both physical and sexual assault, the difference between youth or single people on the one hand and people aged 45 or older or people who are married or in a common-law relationship on the other hand was slightly bigger for sexual assault. For example, in the territories, women aged 15 to 24 were nearly six times more likely than women aged 45 or older to report having been victims of sexual assault in the 12 months preceding the survey (7.7% versus 1.4%). This trend was also observed among single women, who were five times more likely than married women or women in a common-law relationship to report having been victims of sexual assault (7.9% versus 1.7%).
As with victimization since the age of 15, those, especially women, with physical or mental disabilities were more likely than those without disabilities to have been victims of assault in the 12 months preceding the survey. Specifically, 12.5% of women with a disability had been physically or sexually assaulted, compared with 4.6% of women without disabilities. This gap was observed for both physical and sexual assault. For example, among women with physical or mental disabilities, 8.8% were physically assaulted and 5.8% were sexually assaulted. In comparison, these proportions were 3.3% and 2.1%, respectively, among women with no disability.
Similarly, LGBTQ2+ people reported having experienced an assault at about twice the rate of their non-LGBTQ2+ counterparts (16.9% versus 7.5%). However, when different factors were considered (see Text box 2), being LGBTQ2+ was not associated with a greater likelihood of having been physically or sexually assaulted. As such, the higher victimization seen among LGBTQ2+ individuals may be partly linked to other characteristics, such as many LGBTQ2+ people being young or single—two population groups that are more likely to report having been victims of assault.
Experiencing harsh parenting and alcohol or drug use are associated with higher proportions of victimization
Experiencing harsh parenting was associated with a higher likelihood of respondents reporting having been victims of assault since the age of 15, and this was also the case for having been victims of assault in the 12 months preceding the survey (9.8% compared with 3.7% of people who had not experienced harsh parenting). These proportions were almost identical for women and men. The same trend was also observed for both types of assault. For example, 6.5% of women who experienced harsh parenting reported having been physically assaulted in the 12 months preceding the survey, compared with 3.4% of women who did not experience harsh parenting (Table 5).
Binge drinking—having had, on the same occasion, at least five drinks for men or four drinks for women—and cannabis or illicit drug use were also associated with higher proportions of criminal victimization.
Specifically, women (15.6%) and men (13.9%) living in the territories who reported binge drinking at least once a month were about three times more likely to report having been assaulted at least once than women (5.3%) and men (4.5%) who reported binge drinking less than once a month. This trend was observed for both physical and sexual assaults.
Similarly, women (26.9%) and men (31.5%) who had used illicit drugs in the 12 months preceding the survey reported having been victims of physical or sexual assault in higher proportions than women (7.2%) and men (6.3%) who had not used drugs.
As previously mentioned, it is difficult to establish a causal link using SSPPS data between alcohol or drug use and the increased risk of victimization. The association between victimization and alcohol and drug use remains even when other available factors such as age, marital status or history of harsh parenting are taken into account (see Text box 2). However, alcohol and drug use can sometimes follow victimization, rather than preceding it.
For example, people who had been assaulted and who had used alcohol or drugs were asked whether their use was a way to cope with the impact of victimization. About one in seven victims (14%) reported that alcohol or drug use was a way for them to cope with their victimization experienced in the 12 months preceding the survey. This proportion was relatively similar for women (17%) and men (13%). It was also similar regardless the type of assault experienced. For example, 28% of women victims of physical assault and 19% of women victims of sexual assault said their alcohol or drug use was a way to cope with the impact of the assault.Note
Start of text box 2
Text box 2
Multivariate analysis of the characteristics associated with the risk of
criminal victimization among women and men in the territories
While it is useful and relevant to determine the overall prevalence in some groups, it is also essential to recognize the intersections of many aspects of a person’s identity and the impact that these intersections can have on the risk of being victimized. In particular, some characteristics are closely related, such as age and student status, and it is important to understand which individual characteristics have the greatest impact on the level of risk to which a person is exposed. To this end, separate logistic regression models were created to identify characteristics that continued to have an impact on the risk of assault after controlling for the effect of other factors (Model 1; Model 2; Model 3).
After the main factors of interest were taken into account, the following six factors remained significantly linked with the probability of experiencing assault: age (the risk diminishing with each additional year), being single, having a physical or mental disability, having experienced harsh parenting, binge drinking at least once a month, and using illicit drugs.
| Selected characteristics | Total (Model 1) | Women (Model 2) | Men (Model 3) | ||||||
|---|---|---|---|---|---|---|---|---|---|
| Odds ratio | 95% confidence interval | Odds ratio | 95% confidence interval | Odds ratio | 95% confidence interval | ||||
| from | to | from | to | from | to | ||||
| Age | 0.98Note ** | 0.97 | 0.99 | 0.98Note ** | 0.96 | 0.99 | 0.98Note ** | 0.96 | 0.99 |
| Marital status | |||||||||
| Married, common-law, separated, divorced, widowed | Reference | Note ...: not applicable | Note ...: not applicable | Reference | Note ...: not applicable | Note ...: not applicable | ns | ns | ns |
| Single, never married | 2.04Note ** | 1.34 | 3.12 | 2.27Note ** | 1.30 | 3.97 | ns | ns | ns |
| Disability | |||||||||
| Person without a disability | Reference | Note ...: not applicable | Note ...: not applicable | Reference | Note ...: not applicable | Note ...: not applicable | ns | ns | ns |
| Person with a disability | 1.73Note ** | 1.17 | 2.54 | 2.42Note ** | 1.35 | 4.34 | ns | ns | ns |
| Experienced harsh parenting | |||||||||
| Never | Reference | Note ...: not applicable | Note ...: not applicable | Reference | Note ...: not applicable | Note ...: not applicable | Reference | Note ...: not applicable | Note ...: not applicable |
| At least once | 2.63Note ** | 1.47 | 4.68 | 2.05Note * | 1.07 | 3.93 | 2.89Note * | 1.14 | 7.28 |
| Binge drinking in the 12 months preceding the survey | |||||||||
| Never or less than once a month | Reference | Note ...: not applicable | Note ...: not applicable | Reference | Note ...: not applicable | Note ...: not applicable | Reference | Note ...: not applicable | Note ...: not applicable |
| At least once a month | 2.36Note *** | 1.69 | 3.29 | 2.49Note *** | 1.51 | 4.11 | 2.43Note ** | 1.42 | 4.17 |
| Illicit drug use | |||||||||
| Never | Reference | Note ...: not applicable | Note ...: not applicable | ns | ns | ns | Reference | Note ...: not applicable | Note ...: not applicable |
| At least once | 2.25Note ** | 1.22 | 4.14 | ns | ns | ns | 3.48Note ** | 1.59 | 7.62 |
|
... not applicable ns not significant, removed from model
Source: Statistics Canada, Survey of Safety in Public and Private Spaces. |
|||||||||
The characteristics associated with increased likelihood of having been assaulted were very similar for women and men. For example, for both women and men, age, harsh parenting practices and binge drinking were associated with an increased risk of victimization. However, illicit drug use was not a factor for women, while disability was not a factor for men.
End of text box 2
Characteristics of incidents experienced in the 12 months preceding the survey
As part of the SSPPS, follow-up questions were asked about physical or sexual assault that had occurred in the 12 months preceding the survey. For those who had experienced violence more than once, details were sought about the most serious incident. Territory residents who participated in the survey were also asked about key details of the most serious incident, such as the impact on the victim, the location of the incident, the presence of weapons, whether it was reported to police and the characteristics of the offender.
Women are most often physically assaulted in a private residence, while men are most often assaulted in the street or another public place
The characteristics of physical assault incidents differ slightly depending on whether the victim is a woman or a man. For example, women most often reported that the most serious physical assault they experienced had occurred in or around a private residence (43%). Other common places included the street or another public place (23%), or a commercial or institutional establishment (19%). By comparison, men most often reported that the most serious physical assault they experienced had occurred in the street or another public place (50%) (Table 6).
However, the places where sexual assault occurred seemed to be more diversified. Roughly one-quarter (27%) of women who had been sexually assaulted said that the most serious incident had occurred in a private residence, while about as many (30%) said that it had occurred at a commercial or institutional establishment.
Generally, the location of the most serious incident was not the victim’s workplace. Specifically, 78% of women victims and 84% of men victims of physical assault, as well as 84% of women victims of sexual assault, reported that the incident had not occurred in the workplace.
Most of the time, the perpetrator is a man acting alone
Many previous analyses have already well documented the fact that the majority of crimes are committed by men, and most often by a person acting alone (Cotter and Savage 2019; Perreault and Simpson 2016; Perreault 2015). SSPPS data from the territories support this, as 87% of women and 79% of men who had been physically assaulted and 86% of women who had been sexually assaulted reported that the most serious incident was committed by a person acting alone.
In addition, 81% of men who had been physically assaulted reported that the perpetrator of the most serious incident was a man. This proportion was somewhat lower among women who had been physically assaulted, but the majority of victims reported that the most serious physical assault was committed by one or more men (60%). As for women victims of sexual assault, the vast majority reported they had been assaulted by a man (Table 6).
Most women who have been physically assaulted know the perpetrator
Probably related to the fact that physical assaults against women often occur in private places, women were generally more likely to identify someone they knew as the perpetrator of the most serious assault. This was the case even though assault involving spouses or intimate partners was excluded from this analysis.
Women who had been physically assaulted by someone other than an intimate partner reported in relatively similar proportions that the perpetrator was a friend, neighbour or acquaintance (23%); family member (21%); or someone else they knew (21%). About one-third (36%) of women who had been sexually assaulted said that the perpetrator was a friend, neighbour or acquaintance. In contrast, roughly one-third (34%) of women who had been physically assaulted and 42% of women who had been sexually assaulted reported that the perpetrator of the most serious assault was a stranger or someone they knew by sight only. Lastly, men who had been physically assaulted most often said that the perpetrator was a stranger or known by sight only (53%) (Table 6).
In many cases, victims felt that the most serious assault they had experienced in the 12 months preceding the survey could be related to the perpetrator’s alcohol or drug use. This was particularly the case for men who had been physically assaulted, three-quarters (75%) of whom considered the incident related to the offender’s alcohol or drug use. Women who had been physically (49%) or sexually assaulted (46%) were also relatively likely to believe that the assault was linked to the perpetrator’s alcohol or drug use.
The majority of incidents do not involve a weapon or injuries
Physical assault in the territories in 2018 rarely involved a weapon or injuries. Specifically, 28% of women and 34% of men who had been physically assaulted reported the presence of a weapon in the most serious incident. For women who had been sexually assaulted, most (88%) indicated that no weapons were present (Table 6).
These proportions were similar in terms of injuries. About one-third of women (34%) and men (35%) who had been physically assaulted reported having been injured as a result of the most serious physical assault. For women who had been sexually assaulted, 86% said they had not sustained injuries. It is important to remember that questions about the characteristics of incidents were asked for only the most serious physical or sexual assault. Therefore, the proportions of incidents involving a weapon or injuries could potentially be slightly lower if all assaults, including the least serious, had been taken into account.
Most incidents are not reported to police and few victims seek for victim services
Victimization surveys such as the GSS have repeatedly shown that only a small proportion of criminal victimization incidents are reported to police (Cotter and Savage 2019; Perreault and Simpson 2016; Perreault 2015). Data from the SSPPS in the territories confirm this result. Overall, just over one in eight victims of sexual assault (13%) had reported the most serious assault to police. In terms of physical assault, 39% of women and 32% of men said that the most serious incident had been reported to police (Table 6).
However, as with the data on injuries or the presence of a weapon, these proportions may slightly overestimate the actual proportions of assaults that are reported to police. Respondents were asked only about the most serious incident, which may be more likely to have been reported to police than less serious incidents.
In addition to being able to turn to police, people who are assaulted may sometimes seek help from specialized services.Note About one in seven women who had been sexually assaulted (15%) and one in five women who had been physically assaulted (23%) reported having sought help from victim services. For victims who had not used those services, the vast majority said they had not used them because they considered the incident too minor or did not feel they needed them (71% of women and 80 % of men who had been physically assaulted).Note
While relatively few victims of assault turn to police or victim services, many confide in the people around them. About half of women (52%) and men (49%) had talked to a family member about their physical assault, and similar proportions had talked about it to a friend (44% of women, 48% of men). Also, 43% of women and 31% of men who had been physically assaulted reported the most serious incident to another person, such as a doctor, nurse, lawyer, elder, priest or other person (Chart 2).
Chart 2 start

Data table for Chart 2
| Victim’s gender | Physical assault | Sexual assault | ||||||
|---|---|---|---|---|---|---|---|---|
| Talked to someone | Family | Friends | Other | Talked to someone | Family | Friends | Other | |
| percent | ||||||||
| Women | 94 | 52 | 44 | 43 | 82 | 36 | 64 | 27 |
| Men | 88 | 49 | 48 | 31 | Note F: too unreliable to be published | Note F: too unreliable to be published | Note F: too unreliable to be published | Note F: too unreliable to be published |
| Confidence interval | ||||||||
| Women | 6 | 15 | 13 | 14 | 14 | 15 | 17 | 12 |
| Men | 10 | 13 | 15 | 12 | 0 | 0 | 0 | 0 |
|
F too unreliable to be published Note: Excludes intimate partner violence; those results will be published at a later date. Respondents could give more than one answer. When an individual had been the victim of more than one assault, they were asked to provide details only for the most serious physical assault and the most serious sexual assault. Percentage calculations include missing or unspecified responses, but these data are not shown unless they represent 5% or more of the total responses. None of the differences between men and women shown in this chart are statistically significant (p < 0.05). Source: Statistics Canada, Survey of Safety in Public and Private Spaces. |
||||||||
Chart 2 end
The majority (82%) of women victims of sexual assault also talked to someone about the most serious incident. However, while women victims of physical assault turned to family members, friends and other people in similar proportions, women who experienced sexual assault were most likely to turn to a friend (64%). In comparison, 36% of women victims of sexual assault talked to a family member and 27% talked to another person.
One in five victims of sexual assault is blamed
The term “secondary victimization” is sometimes used for the criticisms aimed at victims or the fact that they are made to feel responsible for their own victimization. A lack of support for victims or criticism can lead victims to blame themselves and therefore remain silent rather than confide in others, report the incident or seek help. Victim-blaming can have many negative emotional impacts on victims, such as increased distrust of others, anxiety or depression (Harber et al. 2015).
In total, one in five women who had been sexually assaulted (20%) reported that someone had made them feel responsible for their own victimization. This proportion was 29% among women who had been physically assaulted and 16% among men who had been physically assaulted (Table 6).
Women who have been assaulted are generally more likely than men to report emotional impacts
The majority of victims reported having experienced emotional or psychological impacts as a result of the most serious assault. Generally, women were either equally likely as or more likely than men to report any of the impacts listed. For example, 63% of women said that the assault had made them more fearful or cautious, compared with 36% of men. Similarly, 42% of women reported that the assault had had a negative impact on their self-esteem, compared with 17% of men (Chart 3).Note
Chart 3 start

Data table for Chart 3
| Type of consequence | WomenData tables Note † | Men | Confidence interval | ||
|---|---|---|---|---|---|
| percent | WomenData tables Note † | Men | |||
| After the incident, felt... | Annoyed, shock, hurt, disappointed, lack of trust in others | 71 | 49Note * | 11 | 13 |
| Fearful, cautious, afraid for their children | 63 | 36Note * | 12 | 12 | |
| Upset, confused | 49 | 43 | 13 | 15 | |
| Angry | 59 | 47 | 10 | 11 | |
| Victimized, lowered self-esteem, problems relating to men or women | 42 | 17Note * | 10 | 10 | |
| Ashamed, guilty, sleeping problems, anxiety, depression | 39 | 20Note * | 11 | 10 | |
| In the month preceding the survey... | Had nightmares about the incident | 20 | 8Note * | 10 | 5 |
| Tried hard not to think about it and went out of their way to avoid situations that reminded them of it | 38 | 16Note * | 12 | 9 | |
| Felt on guard or was easily startled | 30 | 19 | 10 | 9 | |
| Felt numb or detached from others, activities | 26 | 8Note * | 11 | 6 | |
| Possible post-traumatic stress disorderData tables Note 1 | 16 | 7 | 9 | 5 | |
Source: Statistics Canada, Survey of Safety in Public and Private Spaces. |
|||||
Chart 3 end
Although women are more likely than men to experience emotional or psychological impacts as a result of their victimization, there does not appear to be a difference based on type of assault. Women who had been physically assaulted were just as likely as women who had been sexually assaulted to report having experienced emotional or psychological impacts following the most serious incident (Chart 4).
Chart 4 start

Data table for Chart 4
| Type of consequence | Physical assault | Sexual assault | Confidence interval | ||
|---|---|---|---|---|---|
| percent | Physical assault | Sexual assault | |||
| Because of the incident, felt... | Annoyed, shock, hurt, disappointed, lack of trust in others | 65 | 76 | 15 | 14 |
| Fearful, cautious, afraid for their children | 66 | 57 | 16 | 16 | |
| Upset, confused | 46 | 49 | 17 | 15 | |
| Angry | 63 | 50 | 13 | 16 | |
| Victimized, lowered self-esteem, problems relating to men or women | 37 | 44 | 13 | 15 | |
| Ashamed, guilty, sleeping problems, anxiety, depression | 45 | 30 | 14 | 14 | |
| In the month preceding the survey... | Had nightmares about the incident | 21 | Note F: too unreliable to be published | 13 | 0 |
| Tried hard not to think about it and went out of their way to avoid situations that reminded them of it | 44 | 28 | 15 | 14 | |
| Felt on guard or was easily startled | 34 | 23 | 14 | 13 | |
| Felt numb or detached from others, activities | 26 | 22 | 15 | 13 | |
| Possible post-traumatic stress disorderData tables Note 1 | 18 | Note F: too unreliable to be published | 12 | 0 | |
F too unreliable to be published
Source: Statistics Canada, Survey of Safety in Public and Private Spaces. |
|||||
Chart 4 end
While everyone should feel free and safe in their daily activities, and although victims are not responsible for their victimization, some victims do change or modify their routine or limit their activities following an assault in order to feel safe again (Ullman et al. 2018). Some victims may also change their routine in order to avoid situations that may remind them of the assault (e.g. avoid the location where the assault took place). As such, just over one-third (36%) of women victims of physical assault and just over one-quarter (27%) of women who were sexually assaulted said that the most serious incident had prompted them to avoid certain people or situations. Similar proportions (33% of women victims of physical assault, 30% of women victims of sexual assault) reported now avoiding certain places because of the assault (chart 5).
Chart 5 start

Data table for Chart 5
| Change in behaviour | Physical assault | Sexual assault | Confidence interval | |
|---|---|---|---|---|
| percent | Physical assault | Sexual assault | ||
| Avoiding certain places | 33 | 30 | 15 | 14 |
| Changing routine to avoid certain people or situations | 36 | 27 | 16 | 13 |
| Becoming withdrawn from social events or activities you typically enjoy | 21 | 17 | 13 | 11 |
| Staying home in order to avoid similar experiences | 19 | 25 | 14 | 14 |
| Did not change behaviour at all | 40 | 45 | 13 | 15 |
|
Note: Excludes intimate partner violence; those results will be published at a later date. Respondents could give more than one answer. When an individual had been the victim of more than one assault, they were asked to provide details only for the most serious physical assault and the most serious sexual assault. Percentage calculations include missing or unspecified responses, but these data are not shown unless they represent 5% or more of the total responses. Source: Statistics Canada, Survey of Safety in Public and Private Spaces. |
||||
Chart 5 end
Among the other behavioural changes mentioned, 19% of physically assaulted women and 25% of sexually assaulted women reported staying at home to avoid further abuse; whereas 21% of physically assaulted women and 17% of sexually assaulted women reported withdrawing from certain social activities. Lastly, 14% of all women who experienced a physical or sexual assault reported now carrying something to defend themselves and 13% reported changing the way they present themselves in public.
Perceptions and attitudes of territory residents about gender expression and gender-based violence
In addition to measuring gender-based violence and other unwanted experiences, the SSPPS had the aim of identifying and monitoring general trends in the perceptions and attitudes of people living in the territories about gender-based violence and, more generally, gender equality.
Gender-based violence is rooted in social structures and systems, and this can contribute to creating and perpetuating gender inequality and gender-based violence (Jewkes et al. 2014; Fleming et al. 2015). Therefore, examining attitudes and beliefs is important for preventing and addressing gender-based violence. These attitudes and beliefs about gender equality and gender-based violence can help better understand whether some behaviours are perceived to be acceptable or normal in the general population. Their analysis could help shed light on the areas where social norms and attitudes need improvement.
Moreover, public opinion does have some influence on public policy (Burstein 2003). Therefore, the SSPPS included eight statements, adapted from a variety of instruments, to measure the perceptions and attitudes of Canadians, including residents of the territories, about gender-based violence and gender equality in Canada.
The majority of territory residents support gender equality
In the SSPPS, several questions were asked to measure perceptions of and attitudes toward gender equality. Residents of the territories were asked to what extent they agreed with the following statements:
- People should be able to express their gender however they choose.
- If a family member of mine came out as transgender, I would not be able to support them.
- Same-sex and opposite-sex couples should have the same rights to adopt children.
- There are significant obstacles that make it harder for women to get ahead than men.
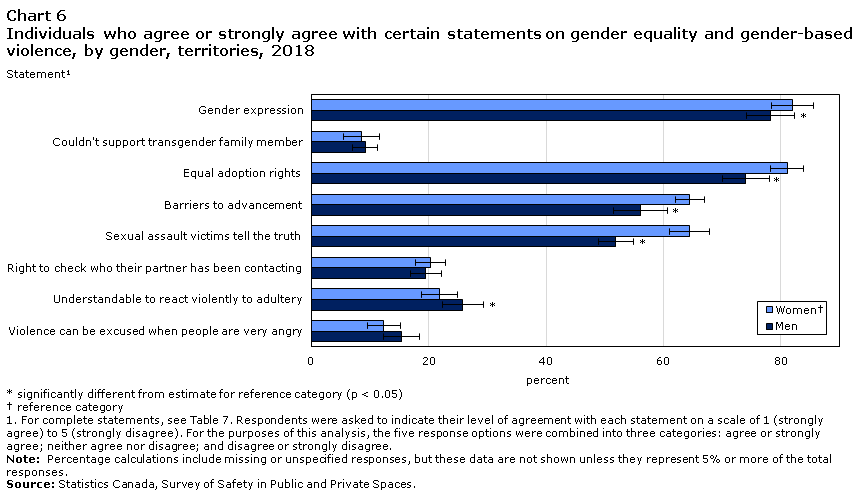
An analysis of provincial SSPPS data showed that the majority of Canadians, both women and men, support gender equality (Cotter and Savage 2019). SSPPS data for the territories were similar. About four in five women (82%) and a relatively similar proportion of men (78%) agreed or strongly agreed with the statement that people should be able to express their gender however they choose.
Similarly, territory residents also agreed that same-sex couples should have the same adoption rights as everyone else (81% of women and 74% of men). Moreover, few women and men (9% each) said they would be unable to support a family member who came out as transgender (Chart 6).
Chart 6 start
Data table for Chart 6
| Gender | StatementData tables Note 1 | |||||||
|---|---|---|---|---|---|---|---|---|
| Gender expression | Couldn't support transgender family member | Equal adoption rights | Barriers to advancement | Sexual assault victims tell the truth | Right to check who their partner has been contacting | Understandable to react violently to adultery | Violence can be excused when people are very angry | |
| percent | ||||||||
| WomenData tables Note † | 82 | 9 | 81 | 65 | 64 | 20 | 22 | 12 |
| Men | 78Note * | 9 | 74Note * | 56Note * | 52Note * | 20 | 26Note * | 15 |
| Confidence interval | ||||||||
| WomenData tables Note † | 4 | 3 | 3 | 2 | 3 | 3 | 3 | 3 |
| Men | 4 | 2 | 4 | 5 | 3 | 3 | 3 | 3 |
Source: Statistics Canada, Survey of Safety in Public and Private Spaces. |
||||||||
Chart 6 end
In contrast, compared with the other statements, territory residents were somewhat less likely to agree with the statement that there are significant obstacles that make it harder for women to get ahead than men. However, women (65%) were somewhat more likely to agree with this statement than men (56%).
Most territory residents condemn gender-based violence
Other statements in the SSPPS addressed perceptions of and attitudes toward gender-based violence more specifically. In particular, residents of the territories were asked to what extent they agreed with the following statements:
- People who report sexual assault are almost always telling the truth.
- People have the right to check who their partner has been calling or texting at all times.
- It is understandable that someone would react violently if they suspect their partner of having an affair.
- Violence between partners can be excused if people get so angry they lose control.
Overall, most territory residents disapproved of controlling and violent behaviours between spouses in some circumstances. For example, 59% of women and 57% of men disagreed with the statement that a person has the right to check who their partner has been calling or texting (Table 7).
Furthermore, a majority of territory residents objected to the statement that it is understandable that someone would react violently if they suspect their partner of having an affair. However, women (63%) were slightly more likely than men (57%) to disagree with this statement.
The statement that drew the strongest disapproval from territory residents was that violence between partners can be excused if people get so angry they lose control. Nearly 8 in 10 women (79%) and just over 7 in 10 men (73%) said that they disagreed or strongly disagreed with this statement.
The majority of women and just over half of men believe that sexual assault victims are almost always telling the truth
Some myths about sexual assault promote or bolster the idea that women can use sexual assault accusations as a way to retaliate against certain men, to hide the existence of an affair, or because they had consensual sexual relations that they regretted afterwards (Johnson 2017). Instead of accurately reflecting the reported cases of sexual assault, these beliefs can be detrimental because they can have negative effects on victims who report an assault and can discourage them from reporting the incident to authorities or from getting help, either officially from victim services, health care providers or the criminal justice system, or informally by confiding in friends or family members who can provide them with emotional support (Johnson 2012).
According to SSPPS data from the territories, women (64%) were significantly more likely than men (52%) to agree or strongly agree with the statement that people who report sexual assault are almost always telling the truth (Chart 5, Table 7). In fact, this was the statement that showed the greatest difference between men and women. It should be noted that 25% of women and 31% of men neither agreed nor disagreed with this statement, proportions that are higher than for any other statement in the SSPPS.
Besides the significant difference in perceptions by gender, little variation was seen in perceptions about victims of sexual assault by the other sociodemographic characteristics (Table 8).
In all the territories, the majority of residents are in favour of gender equality and disapprove of gender-based violence
In general, perceptions in favour of gender equality and against gender-based violence are observed in every territory. Only the statement about there being significant obstacles that make it harder for women to get ahead than men failed to receive support from at least half of Nunavut residents (46%) (Chart 7). One-third (33%) of residents in that territory said that they neither agreed nor disagreed with this statement.
Chart 7 start

Data table for Chart 7
| Territories | StatementData tables Note 1 | |||||||
|---|---|---|---|---|---|---|---|---|
| Gender expression | Couldn't support transgender family member | Equal adoption rights | Barriers to advancement | Sexual assault victims tell the truth | Right to check who their partner has been contacting | Understandable to react violently to adultery | Violence can be excused when people are very angry | |
| percent | ||||||||
| Yukon | 86Data tables Note 4 | 6Data tables Note 4 | 81Data tables Note 4 | 65Data tables Note 4 | 56 | 15Data tables Note 4 | 19Data tables Note 4 | 6Data tables Note 3 Data tables Note 4 |
| Northwest Territories | 85Data tables Note 4 | 8Data tables Note 4 | 83Data tables Note 4 | 67Data tables Note 4 | 60 | 18Data tables Note 4 | 23Data tables Note 4 | 11Data tables Note 2 Data tables Note 4 |
| Nunavut | 67Data tables Note 2 Data tables Note 3 | 13Data tables Note 2 Data tables Note 3 | 66Data tables Note 2 Data tables Note 3 | 46Data tables Note 2 Data tables Note 3 | 58Data tables Note 2 Data tables Note 3 | 28Data tables Note 2 Data tables Note 3 | 31Data tables Note 2 Data tables Note 3 | 27Data tables Note 2 Data tables Note 3 |
| Confidence interval | ||||||||
| Yukon | 2 | 5 | 4 | 5 | 3 | 2 | 3 | 2 |
| Northwest Territories | 4 | 2 | 4 | 4 | 5 | 3 | 4 | 3 |
| Nunavut | 11 | 5 | 8 | 4 | 4 | 4 | 7 | 6 |
Source: Statistics Canada, Survey of Safety in Public and Private Spaces. |
||||||||
Chart 7 end
Although the majority of people in all territories are in favour of gender equality and against gender-based violence, there are still some differences in opinions and attitudes between the territories. Generally speaking, residents of Yukon and the Northwest Territories were slightly more in agreement than Nunavut residents with the statements in favour of gender equality. They were also a bit more likely to disagree with the statements on gender-based violence (Chart 7, Table 8).
However, these differences appear to reflect more the attitudes and opinions of people living in Nunavut’s smaller communities. The attitudes and opinions expressed by residents of Iqaluit—Nunavut’s capital—were generally very similar to those expressed by residents of Whitehorse or Yellowknife, the other two territory capitals.
Young women are more in favour of gender equality
Overall, women seem to have more open attitudes than men toward gender equality and diversity. However, some women are more open than others, especially younger women. For example, women aged 15 to 24 were, on average, more likely than women aged 55 or older to strongly agree with the statements that people should be able to express their gender however they choose or that same-sex couples should have the same adoption rights. Among men, the trend was slightly different: men aged 35 to 44 generally had the most open attitudes about gender equality and diversity (Table 8).
In addition, young people—women and men alike—were more likely to disapprove of gender-based violence. Only the statement that victims of sexual assault are almost always telling the truth received a similar level of agreement across the different age groups.
Openness to gender equality and disapproval of gender-based violence increase with level of education
Attitudes in favour of gender equality and diversity and those against gender-based violence vary widely by level of education. Overall, the higher a person’s level of education, the more likely they were to agree with the statements in favour of gender equality and to object to gender-based violence. This trend is observed in both men and women, for each of the eight statements.
In addition, having a university degree was one of the few socioeconomic characteristics associated with a higher proportion of people stating that they agreed with the statement that victims of sexual assault are almost always telling the truth (Table 8).
Territory residents who experienced harsh parenting or childhood violence are more likely to disapprove of gender-based violence
A number of studies have shown that experiences of violence or harsh parenting during childhood may be linked to violence in adulthood (Augustyn et al. 2019; Myers et al. 2018; Widom and Maxfield 2001). This link may differ by gender: men who experienced violence or harsh parenting in their childhood are thought to be more likely to perpetrate gender-based violence in adulthood, whereas women are believed to be at higher risk of experiencing it (Fulu et al. 2017).
Although measuring the perpetration of violence is beyond the scope of the SSPPS, it can be helpful to better understand the connections between experiences of violence in childhood and the attitudes and beliefs at the root of gender-based violence. On average, both women and men who experienced harsh parenting or violence as a child are mostly opposed to gender-based violence. Specifically, residents of the territories who had experienced harsh parenting were more likely to disagree with the statement that violence between partners can be excused if people get so angry they lose control (Table 8).
Summary
This Juristat article presents the initial results from the Survey of Safety in Public and Private Spaces (SSPPS) conducted in the territories in 2018 on the prevalence of physical and sexual assault that occurred in a context other than an intimate partner relationship in the 12 months preceding the survey, and since the age of 15. In the SSPPS, territory residents had to state the degree to which they agreed or disagreed with a number of statements. These results enable the attitudes and beliefs at the root of gender-based violence to be measured.
Similar proportions of women and men living in the territories had experienced criminal victimization since the age of 15 or in the 12 months preceding the survey. Similar to the results of traditional victimization surveys such as the General Social Survey, women were more likely than men to report having been victims of sexual assault, while the opposite was true for physical assault.
LGBTQ2+ women and women with a physical or mental disability were more likely than other women or than men with the same characteristics to have been victims of sexual assault in their lifetime.
Compared with territory residents who had not been victims of physical or sexual assault since the age of 15, women and men who had been victims were more likely to report poor mental health, problematic alcohol use, cannabis use and past homelessness.
The majority of victims of physical assault in the 12 months preceding the survey said that the perpetrator was a man. While men victims of physical assault were mostly assaulted by one or more strangers, most women were assaulted by one or more people they knew.
Overall, the majority of territory residents appear to be in favour of gender equality and disapprove of gender-based violence. However, in general, women were slightly more likely than men to have attitudes in favour of gender equality and against gender-based violence.
As the data continue to be analyzed, the SSPPS will provide important information on gender-based violence, inappropriate sexual behaviour, and people’s attitudes toward violence and gender equality in Canadian society.
Detailed data tables
Survey description
In 2018, Statistics Canada conducted the first cycle of the Survey of Safety in Public and Private Spaces (SSPPS). The purpose of the survey is to collect information on Canadians’ experiences of unwanted sexual behaviours in public spaces, at work, online, as well as experiences with physical and sexual assaults and violence in their intimate partner relationships.
The target population for the SSPPS is the Canadian population aged 15 and over, living in the provinces and territories. Canadians residing in institutions are not included. Once a household was contacted, an individual 15 years or older was randomly selected to respond to the survey.
In the territories, data collection took place from July to December 2018 inclusively. Responses were obtained by self-administered online questionnaire or by interviewer-administered in-person questionnaire. Respondents were able to respond in the official language of their choice. According to 2016 Census, 2% of territories residents indicated they had no knowledge of at least one official language. This proportion varied from 0.4% in Yukon to 5.7% in Nunavut.
The sample size for the 3 territories was 2,597 respondents. The overall response rate was 73.2%. Non-respondents included people who refused to participate, could not be reached, or could not speak English or French. Respondents in the sample were weighted so that their responses represent the non-institutionalized population aged 15 and older living in the three territories.
Methods for multivariate analysis
The influence of a factor is indicated by the odds ratio, which should be read in relation to the reference category. For this report, three regressions separately model the probability for all territories residents, women and men of having experienced sexual assault or physical assault in the past 12 months. An odds ratio greater than 1 indicates that the characteristic increases the odds for the variable of interest and an odds ratio lower than 1 indicates that the odds decreases. For example, the logistic regression analysis in Model 1 shows that, all things being equal, those living with a disability are more likely than those with no disability to experience an assault, the ratio between the odds for those with a disability and the odds of those with no disability (reference category) being 1.73.
All of the variables in Table 5 were considered (except for experiencing unwanted sexual behaviour in a public space, as this variable overlaps the dependent variable, and as such is driven by similar factors) in the initial analysis. Only variables that proved significant in the multivariate analysis were retained in the final models presented in this report.
Data limitations
As with any household survey, there are some data limitations. The results are based on a sample and are therefore subject to sampling errors. Somewhat different results might have been obtained if the entire population had been surveyed.
For the quality of estimates, the lower and upper bounds of the confidence intervals are presented. Confidence intervals should be interpreted as follows: If the survey were repeated many times, then 95% of the time (or 19 times out of 20), the confidence interval would cover the true population value.
References
Andersen, J.P., Hughes, T.L., Zou, C. and S.C. Wilsnack. 2014. “Lifetime victimization and physical health outcomes among lesbian and heterosexual women.” PLoS One. Vol. 9, no. 7.
Augustyn, M.B., Thornberry, T.P., and K.L. Henry. 2019. “The reproduction of child maltreatment: An examination of adolescent problem behavior, substance use, and precocious transitions in the link between victimization and perpetration.” Development and Psychopathology. Vol. 31, no. 1. p. 53-71.
Beauchamp, D. 2008. “Sexual orientation and victimization, 2004.” Canadian Centre for Justice Statistics Profile Series. Statistics Canada Catalogue no. 85F0033M, no. 16.
Boyce, J. 2016. “Victimization of Aboriginal people in Canada, 2014.” Juristat. Statistics Canada Catalogue no. 85-002-X.
Brassard, R., Montminy, L., Bergeron, A.-S. and I. Sosa-Santchez. 2015. “Application of intersectional analysis to data on domestic violence against Aboriginal women living in remote communities in the province of Quebec.” Aboriginal Policy Studies. Vol. 4, no. 1. p. 3-23.
Brennan, S. 2011. “Violent victimization of Aboriginal women in the Canadian provinces, 2009.” Juristat. Statistics Canada Catalogue no. 85-002-X.
Burczycka, M. and S. Conroy. 2017. “Family violence in Canada: A statistical profile, 2015.” Juristat. Statistics Canada Catalogue no. 85-002-X.
Burczycka, M. 2018. “Stalking in Canada, 2014.” Family Violence in Canada: A Statistical Profile. Juristat. Statistics Canada Catalogue no. 85-002-X.
Burstein, P. 2003. “The impact of public opinion on public policy: A review and an agenda.” Political Research Quarterly. Vol. 56, no. 1. p. 29-40.
Conroy, S. and A. Cotter. 2017. “Self-reported sexual assault in Canada, 2014.” Juristat. Statistics Canada Catalogue no. 85-002-X.
Conroy, S. 2018. “Police-reported violence against girls and young women in Canada, 2017.” Juristat. Statistics Canada Catalogue no. 85-002-X.
Cotter, A. and L. Savage. 2019. “Gender-based violence and unwanted sexual behaviour in Canada, 2018: Initial findings from the Survey of Safety in Public and Private Spaces.” Juristat. Statistics Canada Catalogue no. 85-002-X.
Crenshaw, K. 1994. "Mapping the margins: Intersectionality, identity politics, and violence against women of color". In: M. Albertson Fineman, R. Mykitiuk, (Eds). The Public Nature of Private Violence. Routledge, New York.
Desai, S. and L.E. Saltzman. 2001. “Measurement issues for violence against women.” In C.M. Renzetti, J.L. Edleson and R. Kennedy Bergen (Eds). Sourcebook on Violence Against Women. Thousand Oaks, California.
Elias, B. Mignone, J., Hall, M., Hong, S. P., Hart, L. and J. Sareen. 2012. “Trauma and suicide behaviour histories among a Canadian indigenous population: An empirical exploration of the potential role of Canada's residential school system.” Social Science & Medicine. Vol. 74, no. 10. p. 1560-1569.
Firestone, M., Tyndall, M. and B. Fischer. 2015. “Substance use and related harms among Aboriginal people in Canada: A comprehensive review.” Journal of Health Care for the Poor and Underserved. Vol. 26, no. 4.
Fleming, P.J., Gruskin, S., Rojo, F. and S.L. Dworkin. 2015. “Men’s violence against women and men are inter-related: Recommendations for simultaneous intervention.” Social Science and Medicine. Vol. 146. p. 249-256.
Fulu, E., Miedema, S., Roselli, T., McCook, S., Chan, K.L., Haardörfer, R., Jewkes, R. and UN Multi-country Study on Men and Violence Study Team. 2017. “Pathways between childhood trauma, intimate partner violence, and harsh parenting: Findings from the UN Multi-country Study on Men and Violence in Asia and the Pacific.” The Lancet Global Health. Vol. 5, no. 5. p. e512-e522.
Glasner, T. and V. van der Wander. 2007. “Applications of calendar instruments in social surveys: A review.” Quality and Quantity. Vol. 43. p. 333-349.
Harber, K.D., Podolski, P. and C.H. Williams. 2015. “Emotional disclosure and victim-blaming.” Emotion. Vol. 15. p. 1-12.
Hughes, T.L., Johnson, T.P., Steffen, A.D., Wilsnack, S.C. and B. Everett. 2014. “Lifetime victimization, hazardous drinking, and depression among heterosexual and sexual minority women.” LGBT Health. Vol. 1, no. 3.
Jaffray, B. 2020. “Experiences of violent victimization and unwanted sexual behaviours among gay, lesbian, bisexual and other sexual minority people, and the transgender population, in Canada, 2018.” Juristat. Statistics Canada Catalogue no. 85-002-X.
Jewkes, R., Flood, M.G. and J. Lang. 2014. “From work with men and boys to changes of social norms and reduction of inequities in gender relations: A conceptual shift in prevention of violence against women and girls.” Lancet. Vol. 385, no. 9977. p. 1580-1589.
Johnson, H. 2017. “Why doesn’t she just report it? Apprehensions and contradictions for women who report sexual violence to the police.” Canadian Journal of Women and the Law. Vol. 29, no. 1. p. 36-59.
Johnson, H. 2012. “Limits of a criminal justice response: Trends in police and court processing of sexual assault.” In E.A. Sheehy (Ed.). Sexual Assault in Canada: Law, Legal Practice and Women’s Activism. Ottawa, Ontario. University of Ottawa. p. 613-634.
Missing and murdered Indigenous women and girls. 2019. Reclaiming Power and Place: The Final Report of the National Inquiry into Missing and Murdered Indigenous Women and Girls. (accessed on July 6th, 2020).
Moreau, G. 2019. “Police-reported crime statistics, 2018.” Juristat. Statistics Canada Catalogue no. 85-002-X.
Myers, W., Lloyd, K., Turanovic, J.J. and T.C. Pratt. 2018. “Revisiting a criminological classic: The cycle of violence.” Journal of Contemporary Criminal Justice. Vol. 34, no. 3. p. 266-286.
Perreault, S. 2020. “Gender-based violence: Unwanted sexual behaviours in Canada’s territories, 2018.” Juristat. Statistics Canada Catalogue no. 85-002-X.
Perreault, S. and L. Simpson. 2016. “Criminal victimization in the territories, 2014.” Juristat. Statistics Canada Catalogue no. 85-002-X.
Perreault, S. 2015. “Criminal victimization in Canada, 2014.” Juristat. Statistics Canada Catalogue no. 85-002-X.
Perreault, S. 2011. “Violent victimization of Aboriginal people in the Canadian provinces, 2009.” Juristat. Statistics Canada Catalogue no. 85-002-X.
Prins, A., Ouimette P., Kimberling R., Cameron R.P., Hugelshofer D.S., Shaw-Hegwer J., Thraikill A., Gusman F.D. and J.I. Sheikh. 2003. “The Primary Care PTSD screen (PC-PTSD): Development and operating characteristics.” Primary Care Psychiatry. Vol. 9, no. 1. p. 9-14.
Rotenberg, C. 2019. “Police-reported violent crimes against young women and girls in Canada’s Provincial North and Territories, 2017.” Juristat. Statistics Canada Catalogue no. 85-002-X.
Simpson, L. 2018. “Violent victimization of lesbians, gays and bisexuals in Canada, 2014.” Juristat. Statistics Canada Catalogue no. 85-002-X.
Sutton, J.E. 2010. “A review of the life-events calendar method for criminological research.” Journal of Criminal Justice. Vol. 38, no. 5. p. 1038-1044.
Ullman, S., Lorenz, K. and E. O’Callaghan. 2018. “Risk avoidance strategies after sexual assault: A dyadic study of survivors and informal support providers.” Victims and offenders. Vol. 13, no. 6, p. 814 -833.
United Nations Office of the High Commissioner for Human Rights. 2019. Report of the Special Rapporteur on Violence Against Women, Its Causes and Consequences – Visit to Canada. Report no. A/HRC/41/42/Add.1.
Widom, C.S. and M.G. Maxfield. 2001. “An update on the ‘Cycle of Violence.’” Research in Brief. National Institute of Justice, U.S. Department of Justice.
Williams, J. 2019. Intersections Between Violence and Health Promotion Among Indigenous Women Living in Canada. (Thesis) University of Ottawa
Women and Gender Equality Canada. 2020. About Gender-Based Violence.
Yoshima, M. and B. Gillepsie. 2002. “Age-adjustment and recall bias in the analysis of domestic violence data.” Journal of Family Violence. Vol. 17, no. 3, p 199-221.
- Date modified: