
Gender-based violence: Unwanted sexual behaviours in Canada’s territories, 2018

Archived Content
Information identified as archived is provided for reference, research or recordkeeping purposes. It is not subject to the Government of Canada Web Standards and has not been altered or updated since it was archived. Please "contact us" to request a format other than those available.
by Samuel Perreault, Canadian Centre for Justice and Community Safety Statistics
Highlights
- Gender-based violence—defined as violence committed against someone based on their gender identity, gender expression or perceived gender—encompasses a range of behaviours, not all of which meet the threshold of criminal behaviour. Three aspects of gender-based violence were examined in this report using data from the Survey of Safety in Public and Private Spaces (SSPPS): unwanted sexual behaviour in public, unwanted sexual behaviour online and unwanted sexual behaviour in the workplace.
- Women are more likely than men to experience gender-based violence. In the territories, just over one-third (35%) of women and 16% of men experienced unwanted sexual behaviour in public. In addition, 31% of women and 16% of men experienced unwanted sexual behaviour in the workplace, and nearly one-quarter (24%) of women and 16% of men who have used the Internet were targets of unwanted behaviour online.
- Some individuals who identify with more than one minority or marginalized group were among the most likely to be the target of gender-based violence. For example, nearly two-thirds (62%) of LGBTQ2+ people living with a disability experienced inappropriate sexual behaviour in 2018. By comparison, this was the case for 43% of LGBTQ2+ people with no disability, 33% of those with a disability who were not LGBTQ2+, and 20% of non-LGBTQ2+ individuals who had no disability.
- People who are targets of repeated instances of gender-based violence were more likely to experience negative consequences. For example, 41% of women and 42% of men who had been targets of multiple instances of unwanted sexual behaviours in a public space said that they now avoid certain people or situations, compared with 24% of women and 9% of men who experienced these behaviours once or twice. Those who experienced multiple unwanted sexual behaviours in public spaces were also more likely to rate their mental health as poor or fair and to have contemplated suicide.
- For both women and men who experienced unwanted sexual behaviour in a public space and unwanted sexual behaviour online, the perpetrator was most often a man acting alone.
- Women who experienced unwanted sexual behaviour in a public space were more likely to have been targeted by a stranger (70%). Among men, the opposite was true: most often, a person known to them was responsible for unwanted sexual behaviour.
Canada recognizes the right to equality and the right to live in security for all. However, many people in Canada experience certain forms of violence because of their gender,Note how they express that gender identity or how it is perceived (Women and Gender Equality Canada 2020). Women, LGBTQ2+ peopleNote and various minority groups are most likely to be victims of sexual assault (Conroy 2018; Simpson 2018; Perreault 2015). These same population groups are also at increased risk of criminal harassment (Burczycka 2018a). These types of violence can have a number of negative consequences on the victims, including physical, psychological and economic impacts.
However, the violence that some people experience as a result of their gender or gender identity is not limited to criminal acts (Benoît et al. 2015). Certain behaviours that do not meet the threshold of a criminal act can nevertheless have significant negative consequences for those who experience them, in addition to contributing to the perpetuation of discriminatory stereotypes. For example, unwanted sexual attention or close contact, or inappropriate sexual comments received in person or online, can negatively affect a person’s sense of security or limit their activities (Bastomski and Smith 2017).
The risk of violent behaviour is not the same for every person across the country. For example, previous studies have shown that women and girls living in the territories experience a disproportionate number of violent crimes (Rotenberg 2019; Perreault and Simpson 2016). Several studies have also highlighted the increased risk of victimization among First Nations, Métis and InuitNote women, who account for a significant proportionNote of women in the territories (Boyce 2016; Brennan 2011a; Perreault 2011). Furthermore, the final report of the National Inquiry into Missing and Murdered Indigenous Women and Girls revealed that persistent and deliberate human and Indigenous rights violations and abuses are the root causes behind Canada’s staggering rates of violence against Indigenous women, girls and 2SLGBTQQIA people (Missing and Murdered Indigenous Women and Girls 2019).
In addition to an increased risk of victimization, victims of violence in remote or isolated areas face additional challenges due to their geographic location. A report of the Special Rapporteur on violence against women, its causes and consequences identified various contextual elements that exacerbate the issues of violence faced by women and young girls in the territories, including easy access to weapons, little access to legal services, limited public transit and daycare services, economic difficulties and poverty, little access to services for women (e.g. women shelters, mental health services, etc.), barriers to maintaining the confidentiality of reports of abuse as well as social, cultural and psychological isolation (United Nations Office of the High-Commissioner for Human Rights 2019).
In 2018, Statistics Canada conducted the Survey of Safety in Public and Private Spaces (SSPPS), with the goal of collecting data to deepen our knowledge of gender-based violence in Canada.Note The SSPPS is part of Canada’s Strategy to Prevent and Address Gender-Based Violence,Note and provides the government with the relevant, timely and representative data required to implement the strategy.
Measuring gender-based violence can be complex. Those experiencing violence and those perpetrating it may not perceive its root causes and motivations, which can be rooted in a culture that perpetuates gender inequalities. SSPPS respondents were therefore invited to share their experiences and the contextual elements around them to enable an analysis of these events from the perspective of gender-based violence. Unlike previous victimization surveys that were generally limited to recent criminal acts, the SSPPS makes it possible to measure the entire continuum of gender-based violence, by including violent victimization experiences throughout peoples’ lives, their experiences of unwanted sexual behaviours and online victimization, as well as their attitudes regarding certain stereotypes.
In addition to the present report, Statistics Canada’s Canadian Centre for Justice Statistics and Community Safety also released a report outlining the first results of the SSPPS for the provinces specifically (Cotter and Savage 2019). The present report complements this earlier report by presenting the first results of the SSPPS for the territories, with a focus on unwanted sexual behaviours in public spaces, unwanted behaviours online and unwanted sexual behaviours in the workplace. Results are based on responses from more than 2,500 persons living in the territories, who were each assigned a weight so as to be representative of the entire territories population 15 years of age and older. This article takes a gender-based approach by comparing results between genders and, where possible, taking the intersection of various other characteristics into account. A separate report specific to the territories, which focusses on residents’ experiences with sexual and physical assaults, will be released in the near future.
Unwanted sexual behaviour in public spaces in the territories
As mentioned, gender-based violence encompasses an array of behaviours that do not necessarily reach the threshold of a criminal act, but which nevertheless compromise peoples’ feelings of safety in daily life and which can have serious repercussions for those who experience them (Benoit et al. 2015). These behaviours include inappropriate sexual behaviour in public spaces.
The SSPPS measured several types of unwanted sexual behaviour in public spaces, namely unwanted touching (including physical contact or getting too close in a sexual way), indecent exposure, unwanted comments that the individual does not look or act like a man or woman is supposed to act, unwanted comments regarding sexual orientation or assumed sexual orientation, as well as unwanted sexual attention (including comments, whistles, and suggestive looks, gestures or body language).
In the context of the SSPPS, a public space is defined as a “place to which the public has access with little or no restrictions” (e.g., cafes, streets, shopping malls, public transit, bars, and restaurants).Note In addition, respondents were asked to report only those incidents where they felt threatened or uncomfortable.
Although these behaviours may sometimes be perceived as lacking the same degree of seriousness as sexual assault, these behaviours stem from social norms, structures and beliefs that are similar to those which underlie sexual assault—these all being forms of gender-based violence (Bastomski and Smith 2017; Mellgren et al. 2018).
Start of text box 1
Text box 1
Gender-based violence and the Criminal Code
Most victimization surveys are designed to measure criminal victimization—that is, victimization based on acts defined in the Criminal Code. For its part, the purpose of the SSPPS was to measure the nature and extent of gender-based violence experienced by Canadians. This violence can involve different behaviours that can have negative consequences for those being targeted, but may not reach the threshold of a criminal act.
However, it should be noted that given specific contexts, circumstances and aspects, the majority of the behaviours measured by the SSPPS can potentially reach the threshold of a criminal act. Certain sections of the Criminal Code are particularly relevant to gender-based violence, including but not limited to:
- Sexual assault
- Physical assault, including threats
- Non-consensual publication of intimate images
- Exposure, voyeurism and indecency
- Sexual offences against minors (e.g., child pornography, sexual interference, etc.)
- Criminal harassment and indecent or harassing communications
For example, although one person getting uncomfortably close to another is not necessarily criminal, it could be considered a criminal act if the age of the victim falls within a certain range (i.e., sexual offences against minors), if sexual touching occurs (i.e., sexual assault), if the victim feels threatened or if the behaviour is repeated (i.e., threats or criminal harassment) or if force is threatened or used (i.e., assault).
In addition, even when they do not meet the threshold of an act punishable under the Criminal Code, many of these behaviours may contravene other federal or provincial laws, policies or directives or that are specific to a given institution or workplace. For instance, the Canada Labour Code and the Canadian Human Rights Act include provisions on sexual harassment.
End of text box 1
More than one-third of women living in the territories experienced unwanted sexual behaviour in a public space in the last year
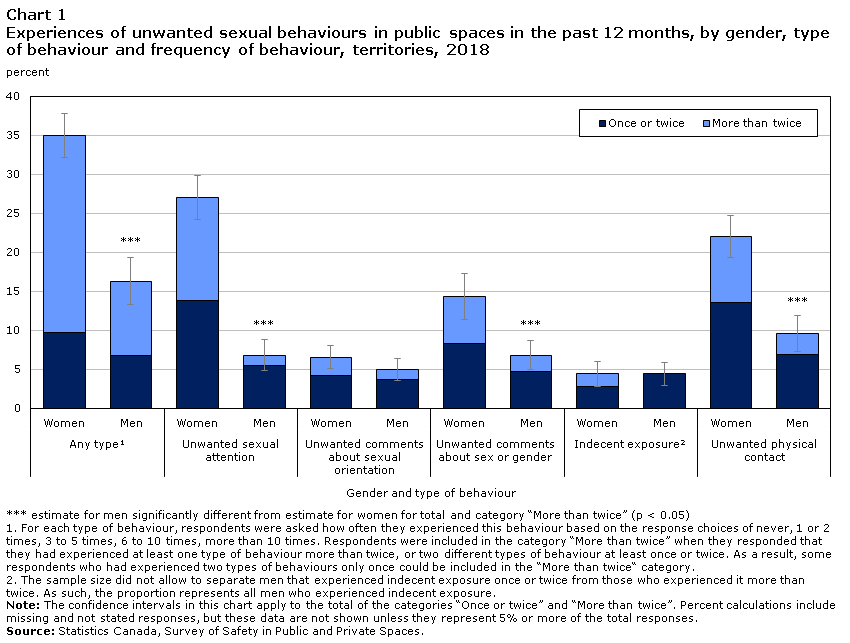
One-quarter (25%) of territories residents aged 15 or older (nearly 24,000 people) reported being, at least once in the 12-month period preceding the survey, the target of unwanted sexual behaviour in a public space that made them feel threaten or uncomfortable. Women experienced a disproportionate share of unwanted sexual behaviour in public spaces: more than one-third (35%) reported having experienced at least one type of unwanted sexual behaviour, more than twice the proportion reported by men (16%) (Table 1; Chart 1).Note
Chart 1 start
Data table for Chart 1
| Once or twice | More than twice | Standard error "Once or twice" | Standard error "More than twice" | ||
|---|---|---|---|---|---|
| percent | |||||
| Any typeData table Note 1 | Women | 9.7 | 25.2 | 2.9 | 1.5 |
| Men | 6.8 | 9.5 | 3.0 | 1.5Note *** | |
| Unwanted sexual attention | Women | 13.8 | 13.2 | 2.8 | 1.4 |
| Men | 5.4 | 1.4 | 2.0 | 1.0Note *** | |
| Unwanted comments about sexual orientation | Women | 4.2 | 2.4 | 1.5 | 0.8 |
| Men | 3.7 | 1.3 | 1.4 | 0.7 | |
| Unwanted comments about sex or gender | Women | 8.3 | 6.1 | 3.0 | 1.5 |
| Men | 4.8 | 2.0 | 1.8 | 0.9Note *** | |
| Indecent exposureData table Note 2 | Women | 2.8 | 1.6 | 1.6 | 0.8 |
| Men | 4.4 | 1.5 | 0.8 | ||
| Unwanted physical contact | Women | 13.6 | 8.4 | 2.6 | 1.3 |
| Men | 6.9 | 2.7 | 2.3 | 1.2Note *** | |
Source: Statistics Canada, Survey of Safety in Public and Private Spaces. |
|||||
Chart 1 end
Overall, the most common unwanted sexual behaviour was unwanted sexual attention, reported by 17% of territories residents (27% of women and 7% of men). Following this was unwanted touching (22% of women and 10% of men) and unwanted comments regarding the person’s gender (14% of women and 7% of men) (Table 1; Chart 1).
One-quarter of women in the territories experienced unwanted sexual behaviour in a public space on several occasions
Although the majority of women did not experience any unwanted sexual behaviour, those who did were generally repeatedly targeted. One-quarter of women in the territories reported being the target of unwanted sexual behaviour in a public space more than twice, representing almost three-quarters (72%) of women who had experienced at least one unwanted sexual behaviour (Chart 1).
Like women, men who had been the target of unwanted sexual behaviour in a public space had typically been targeted several times, although the corresponding proportions were lower: 1 in 10 men (10%) were the target of repeated unwanted sexual behaviour, representing 58% of all men who reported being the target of at least one instance of unwanted sexual behaviour in a public place.
Although many unwanted behaviours do not reach the threshold of a criminal act, the fact remains that repeated exposure can have particularly harmful effects on the people who have been targeted. Of note, sexual harassment or inappropriate sexual behaviour, given their generally higher frequency, can have a cumulative negative effect on the individuals who are subjected to it (Fileborn and Vera-Gray 2017).
Women in Nunavut less likely to experience unwanted sexual behaviour in a public space than women in Yukon or the Northwest Territories
It is generally accepted that unwanted sexual behaviours are rooted in the same social structures and systems in which sexual assaults are based (Bastomski and Smith 2017; Mellgren et al. 2018). As such, we may expect that if one of these forms of gender-based violence is prevalent in a given place, the other will be, as well. Therefore, a relatively high incidence of inappropriate sexual behaviour could be expected in regions with higher rates of sexual assault.
SSPPS findings about Nunavut, specifically, seem to challenge this assumption. According to 2018 police-reported data, the highest sexual assault rate in the territories was recorded in Nunavut, where it was nearly six times the national average (Moreau 2019). Despite this, the SSPPS data show that Nunavut is the least likely territory for women to be targets of unwanted sexual behaviour in a public space. One-quarter (25%) of women in Nunavut reported having experienced at least one unwanted sexual behaviour in a public space in 2018, compared to 41% of Yukon women and 38% of Northwest Territories women. The trend was similar for men: 11% of Nunavut men reported being the target of unwanted sexual behaviour, compared with 18% in the Northwest TerritoriesNote (Chart 2).
Chart 2 start

Data table for Chart 2
| Men | Standard error "Men" | Women | Standard error "Women" | |
|---|---|---|---|---|
| percent | ||||
| All territoriesData table Note † | 16.3 | 3.0 | 34.9 | 2.9 |
| Yukon | 19.0 | 6.6 | 40.6 | 4.2 |
| Whitehorse | 18.1 | 5.4 | 42.0Note * | 5.6 |
| Other Yukon communities | 21.0 | 19.8 | 37.1 | 8.8 |
| Northwest Territories | 18.0 | 3.9 | 37.7 | 6.0 |
| Yellowknife | 18.1 | 5.7 | 45.7Note * | 7.5 |
| Other NWT communities | 18.0 | 5.3 | 31.0 | 8.8 |
| Nunavut | 11.0Note * | 5.2 | 24.5Note * | 3.6 |
| Iqaluit | 16.8 | 7.6 | 43.5 | 9.0 |
| Rankin Inlet | 20.3 | 13.3 | 34.1 | 14.3 |
| Other Nunavut communities | 7.4Note * | 7.0 | 16.5Note * | 3.8 |
Source: Statistics Canada, Survey of Safety in Public and Private Spaces. |
||||
Chart 2 end
In their analysis of unwanted sexual behaviours in the Canadian provinces, Cotter and Savage (2019) found that women and men living in the core of larger cities reported having experienced unwanted sexual behaviours at a higher rate than their counterparts in the suburbs and rural areas. They speculated that urban cores have more public spaces, with more people, higher population density and a greater degree of anonymity, which could provide more opportunities for such behaviours to occur.
The higher prevalence of unwanted sexual behaviour in urban cores may in part explain the lower proportions of unwanted sexual behaviour in Nunavut. Compared to other territories, Nunavut’s population is more dispersed in smaller communities. In Yukon and the Northwest Territories, the population is concentrated in their capital cities. Whitehorse, the capital of Yukon, had a population of 28,225 at the time of the 2016 Census, representing 79% of the Yukon population. For its part, Yellowknife, the capital of the Northwest Territories, had a population of 19,569 (47% of the territory’s population). In contrast, Iqaluit, the capital of Nunavut, had a population of 7,082, which is less than 20% of the territory’s population.
As was the case in the provinces, the proportions of people who experienced unwanted sexual behaviour in public spaces in the territories were generally higher in larger cities. For example, the proportion of women who experienced such behaviours in Iqaluit was very similar to the corresponding proportions in Yellowknife and Whitehorse, confirming that lower rates recorded in Nunavut may partially be explained by the lower proportion of the territory’s population living in the capital (Chart 2).
However, in other Nunavut communities, the proportion of women who reported experiencing unwanted sexual behaviours was still lower than that recorded outside the capital cities in the other territories. As such, other factors may also partially explain the lower prevalence of unwanted sexual behaviours in public spaces in Nunavut. For example, studies have noted that the history of violence resulting from colonization and residential schools may have led to some normalization of violence among Inuit women, who represent the vast majority of Nunavut women outside of Iqaluit (Brassard et al. 2015; Williams 2019). Therefore, there could be under-reporting of some inappropriate sexual behaviours, in cases where those who experienced them may not have fully perceived their threatening or violent nature, especially in the less serious instances.
Young single women are most likely to have been the target of inappropriate sexual behaviour in a public space
Overall, women living in the territories are more likely than men to have been subjected to inappropriate sexual behaviour in a public space—but it was young women, aged 15 to 34, who most often reported these experiences. About half of women aged 15 to 24 (48%) and 25 to 34 (50%) were the target of at least one unwanted sexual behaviour in a public space in the 12 months preceding the survey. By comparison this was the case of 21% of women aged 55 to 64 and 7% of women aged 65 and over. The age structure was similar for men, although the corresponding proportions were consistently lower than for women (Table 2).
The same kind of variation was observed with respect to marital status. Almost half (48%) of single women and nearly one-quarter of single men (24%) were subjected to unwanted sexual behaviour in a public place in the 12 months preceding the survey. Among married or common-law individuals, these proportions were 30% of women and 11% of men. While some of these differences may be due to age—a large proportion of singles are young—singles were nonetheless at greater risk of unwanted behaviour, even when taking age into account.
Fewer Indigenous women than non-Indigenous women reported having experienced unwanted sexual behaviour in a public space
First Nations, Métis and Inuit make up about half of the territories’ residents. In Nunavut, this proportion is higher than 80%. Although not focussing on gender-based violence specifically, several studies have found that Indigenous women were at greater risk than non-Indigenous women of being subjected to physical or sexual assault, including in the territories (Perreault and Simpson 2016; Boyce 2016). These higher victimization rates may in part be attributable to various factors related to colonization, including cultural suppression, physical displacement and economic deprivation (Firestone et al. 2015); as well as intergenerational trauma resulting from experiences of neglect and abuse in the residential school system (Elias et al. 2012).
In the provinces, higher proportions of Indigenous people than non-Indigenous people reported being the target of inappropriate sexual behaviour: 40% of Indigenous women and 20% of Indigenous men, compared with 31% of non-Indigenous women and 13% of non-Indigenous men. The report found however that when other factors were taken into account, Indigenous people were no longer at higher risk of experiencing unwanted sexual behaviours in a public space, with the exception of Métis men (Cotter and Savage 2019).
In contrast, the situation is slightly different in the territories. Overall, 29% of Indigenous women in the territories were the target of at least one inappropriate sexual behaviour in a public space in 2018. The corresponding proportion among non-Indigenous women was 41% (Table 2).
This difference was mainly attributable to the relatively low proportion (22%) of Inuit women reporting being the target of unwanted sexual behaviour, particularly outside major urban centres. On the other hand, the proportion of First Nation women (39%) and Métis women (41%) who reported having experienced unwanted sexual behaviours in a public space were very similar to that recorded among non-Indigenous women (41%) and in the provinces. Similarly there were no statistically significant difference between First Nations men (28%), Métis men (24%) and non-Indigenous men (15%) who reported having experienced unwanted sexual behaviours in a public space.
Probably because they have more public spaces with a higher volume and density of people, the prevalence of inappropriate sexual behaviour in a public place is generally higher in urban areas (Cotter and Savage 2019). Also, urban areas may have a higher degree of anonymity compared with rural areas, where people are more likely to know one another and familiarity or interconnectedness may dissuade certain behaviours. Incidentally, 70% of women in the territories who experienced unwanted sexual behaviours in a public space indicated that the perpetrator was a stranger or someone known by sight only.
However 83%Note of Inuit women live outside the territorial capitals, generally in communities with a relatively small population size. By comparison, this is the case with 28%Note of non-Indigenous women, which could partially explain the lower proportion of Inuit women who reported having experienced unwanted sexual behaviours in a public space. Across the capitals, there were similar proportions of Indigenous women, including Inuit women, and non-Indigenous women who reported having experienced at least one form of inappropriate sexual behaviour in a public place. As mentioned earlier, some studies have highlighted a normalization of violence among some Inuit women (Brassard et al. 2015; Williams 2019), which could have contributed to an under-reporting of some inappropriate sexual behaviours, especially in cases where the violent or threatening nature might have been less clear.
LGBTQ2+ individuals living in the territories and those with disabilities are more likely to experience unwanted behaviours in public
Several studies, including ones that use SSPPS data from the provinces, found that LGBTQ2+ individuals were more likely to be targets of harassment or inappropriate sexual behaviours in public places (Jaffray 2020; Cotter and Savage 2019). The SSPPS data collected in the territories confirm this trend, with nearly two-thirds (61%) of LGBTQ2+ women experiencing inappropriate sexual behaviour in 2018, compared with one-third (34%) of non-LGBTQ2+ women. Among LGBTQ2+ men, just over a third (36%) experienced such behaviours, compared with 16% of non-LGBTQ2+ men (Table 2).
Similarly, studies have shown a higher risk of victimization or harassment among people with physical or mental disabilities (Cotter and Savage 2019; Cotter 2018; Burczycka 2018a; Burczycka 2018b; Perreault 2009). Data from the SSPPS in the territories also reflect these results; persons with disabilities were more likely to report being the target of unwanted sexual behaviour in a public space—and particularly, to report being the target on several occasions. Overall, 45% of women with disabilities reported being the subject of at least one incident, but 36% had been the subject of multiple incidents. For women without disabilities, these proportions were 28% and 18% respectively. The pattern was also similar for men (Table 2).
In addition, nearly two-thirds (62%) of LGBTQ2+ people living with a disability experienced inappropriate sexual behaviour in a public space in 2018. By comparison, this was the case for 43%Note Note of LGBTQ2+ people with no disability, 33% of those with a disability who were not LGBTQ2+, and 20% of non-LGBTQ2+ individuals who had no disability.
These results support the theory that a greater risk of experiencing different forms of violence, including sexual unwanted behaviours, exists for those identifying with several minority groups or identities given the interaction of multiple systems of oppression and discrimination that affect them (Crenshaw 1994).
In most cases, men are the perpetrators of unwanted sexual behaviour in a public space
Additional information about the circumstances of the most serious incident of unwanted sexual behaviour was collected from SSPPS respondents who experienced at least one such behaviour in a public space.Note Both men and women generally reported that only one person was responsible for the behaviour, 81% of the time.
The vast majority (93%) of women who experienced unwanted sexual behaviour indicated that the personNote behind the most serious behaviour was a man. Men who had experienced unwanted sexual behaviour in a public space also most often identified the perpetrator as a man (56%). However, while only 3% of women who experienced unwanted behaviour reported that a woman was responsible, this proportion was 32% among men (Table 3).
Women more likely to have been targeted by a stranger
Women are much more likely than men to have been targeted by a stranger during the most serious unwanted sexual behaviour. Seven out of ten (70%) women who had experienced at least one unwanted sexual behaviour in a public space indicated that the person who initiated the most serious incident was a stranger. Men, too, were often targeted by a stranger, but in a much smaller proportion—less than half (46%). In contrast, men identified a friend, acquaintance or neighbour as the perpetrator of the most serious incident they experienced more often than women (34% of cases compared with 19% of women) (Table 3).
Of note, when the perpetrator was a stranger, it was most likely to be a man, especially when the targeted person was also a man. As such, 66% of men who experienced an unwanted sexual behaviour in a public space perpetrated by a stranger reported that person was a man. In comparison, men were behind 47% of incidents perpetrated by a non-stranger person, such as a family member, a friend, an acquaintance or a colleague. Among women, a man was behind the unwanted sexual behaviour in the vast majority of cases, no matter the relationship with the person behind the behaviour.
Both men and women indicated that they believed that the most serious incident they experienced could be associated with alcohol or drug use by the perpetrator (63% of women, 59% of men). Despite this, less than a quarter of those who experienced unwanted sexual behaviour in a public space reported that the most serious incident occurred in a restaurant or bar (20% of women, 25% of men). Most often, it occurred on the street, in a park, in a parking lot or on public transit (43% of women, 32% of men).
Unwanted sexual behaviour in public spaces often has negative consequences on the targeted person
A number of studies have shown that unwanted sexual behaviour in public can lead to negative consequences for those who experienced it. In particular, people who are targets of unwanted sexual behaviour may experience a decrease in their sense of safety and may change their habits to avoid experiencing negative experiences again (Fisher et al. 2017; Gardner et al. 2017). These reactions can limit their ability to fully participate in society and to use public spaces; this is particularly the case for women, who are more often the target of these behaviours (Bastomski and Smith 2017; Kearl 2010).
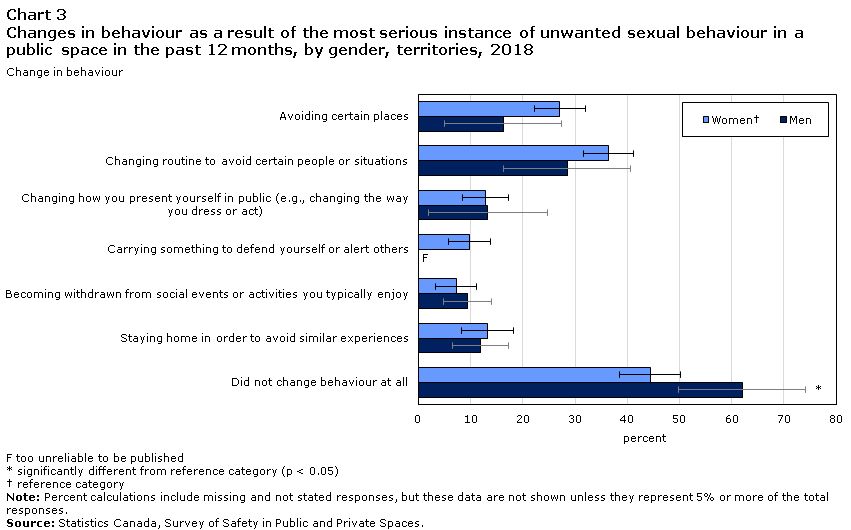
About half of women (54%) and just over one-third of men (35%) who experienced unwanted sexual behaviours in a public space reported they changed their habits or behaviours in some way as a consequence of the most serious incident of unwanted sexual behaviour in a public space. Avoiding people or situations was the most commonly reported behavioural change for both women (36%) and men (28%) who had experienced unwanted sexual behaviour in a public space. Many also said that the most serious incident led them to avoid certain places (27% of women, 16% of men) or to change the way they presented themselves in public (13% of both women and men). In contrast, 44% of women and 62% of men indicated that the most serious incident had not changed their behaviour at allNote (Chart 3).
Chart 3 start
Data table for Chart 3
| Men | Standard error "Men" | WomenData table Note † | Standard error "Women" | |
|---|---|---|---|---|
| percent | ||||
| Avoiding certain places | 16.2 | 11.2 | 27.1 | 4.8 |
| Changing routine to avoid certain people or situations | 28.5 | 12.1 | 36.4 | 4.8 |
| Changing how you present yourself in public (e.g., changing the way you dress or act) | 13.3 | 11.3 | 12.8 | 4.5 |
| Carrying something to defend yourself or alert others | Note F: too unreliable to be published | 9.8 | 4.0 | |
| Becoming withdrawn from social events or activities you typically enjoy | 9.4 | 4.7 | 7.2 | 3.9 |
| Staying home in order to avoid similar experiences | 11.9 | 5.4 | 13.3 | 5.0 |
| Did not change behaviour at all | 62.0Note * | 12.2 | 44.4 | 5.9 |
F too unreliable to be published
Source: Statistics Canada, Survey of Safety in Public and Private Spaces. |
||||
Chart 3 end
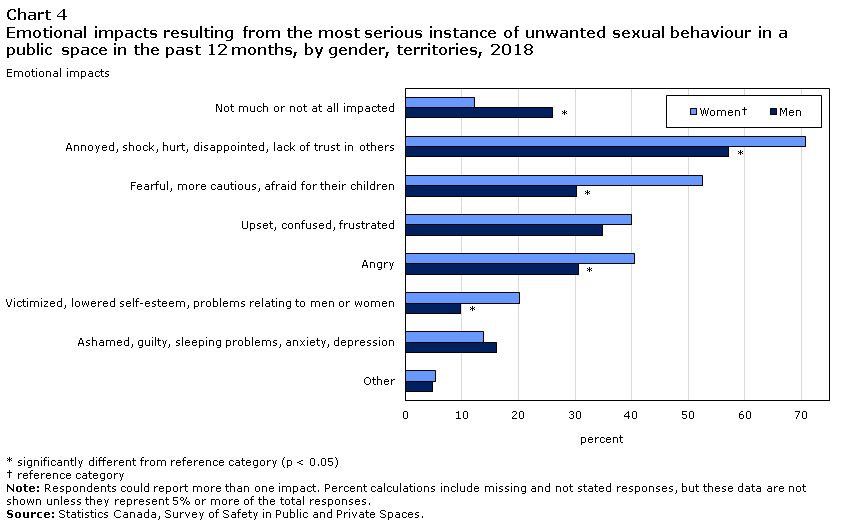
In addition to behavioural changes, individuals who experience unwanted sexual behaviour can also experience negative emotional impacts. The majority of those who were targets of unwanted sexual behaviour in a public space reported negative emotional reactions following the most serious incident (89% of women and 76% of men). In contrast, one in eight women (12%) and one in four men (26%) reported that the most serious incident they had experienced affected them only slightly or not at allNote (Chart 4).
Chart 4 start
Data table for Chart 4
| Men | Standard error "Men" | WomenData table Note † | Standard error "Women" | |
|---|---|---|---|---|
| percent | ||||
| Not much or not at all impacted | 26.0Note * | 8.5 | 12.2 | 3.8 |
| Annoyed, shock, hurt, disappointed, lack of trust in others | 57.1Note * | 10.9 | 70.7 | 4.9 |
| Fearful, more cautious, afraid for their children | 30.2Note * | 11.6 | 52.5 | 6.1 |
| Upset, confused, frustrated | 34.9 | 12.6 | 39.9 | 4.6 |
| Angry | 30.5Note * | 7.5 | 40.6 | 4.7 |
| Victimized, lowered self-esteem, problems relating to men or women | 9.8Note * | 4.6 | 20.2 | 4.8 |
| Ashamed, guilty, sleeping problems, anxiety, depression | 16.0 | 11.0 | 13.7 | 5.1 |
| Other | 4.8 | 3.8 | 5.3 | 2.1 |
Source: Statistics Canada, Survey of Safety in Public and Private Spaces. |
||||
Chart 4 end
Repeated experiences of unwanted sexual behaviour leads to more negative consequences
Some individuals, particularly women, reported having experienced unwanted sexual behaviour in a public place several times in the 12 months preceding the survey. However, even though a single incident can have negative consequences for those who experience it, the cumulative effect of repeated cases of such behaviours can have even more consequences (Fileborn and Vera-Gray 2017).
Those who experienced multiple unwanted sexual behaviours during the year were most likely to say that the most serious incident affected them emotionally or had led them to change their behaviour. For example, 59% of women and 42% of men who experienced multiple unwanted behaviours in a public space indicated that the most serious incident had made them more fearful or cautious. By comparison, this proportion was 35% and 14%, respectively, among women and men who reported being the target of one or two unwanted sexual behaviours (Chart 5).
Chart 5 start

Data table for Chart 5
| Men | Women | |||||||
|---|---|---|---|---|---|---|---|---|
| 1 or 2 incidentsData table Note † | Standard error "1 or 2 incidents" | More than 2 incidents | Standard error "More than 2 incidents" | 1 or 2 incidentsData table Note † | Standard error "1 or 2 incidents" | More than 2 incidents | Standard error "More than 2 incidents" | |
| percent | ||||||||
| Not much or not at all impacted | 37.5 | 13.1 | 17.8Note * | 8.9 | 22.9 | 8.3 | 8.1Note * | 3.8 |
| Annoyed, shock, hurt, disappointed, lack of trust in others | 42.7Note ** | 12.1 | 67.3Note * | 13.0 | 64.5 | 9.1 | 73.0 | 5.8 |
| Fearful, more cautious, afraid for their children | 13.9Note ** | 9.2 | 41.8Note *** | 17.1 | 34.9 | 9.4 | 59.3Note * | 6.9 |
| Upset, confused, frustrated | Note F: too unreliable to be published | 0.0 | 50.6 | 16.8 | 30.1 | 9.0 | 43.7Note * | 5.9 |
| Angry | 26.2 | 13.2 | 33.7Note ** | 9.6 | 28.7 | 8.8 | 45.1Note * | 5.5 |
| Victimized, lowered self-esteem, problems relating to men or women | Note F: too unreliable to be published | 0.0 | 9.4Note ** | 6.3 | 10.0 | 4.7 | 24.1Note * | 6.5 |
| Ashamed, guilty, sleeping problems, anxiety, depression | Note F: too unreliable to be published | 0.0 | 25.6 | 17.7 | Note F: too unreliable to be published | 0.0 | 17.8 | 6.8 |
F too unreliable to be published
Source: Statistics Canada, Survey of Safety in Public and Private Spaces. |
||||||||
Chart 5 end
Similarly, 41% of women and 42% of men who experienced multiple unwanted behaviours indicated that the most serious incident had led them to avoid certain people or situations. Among those who were targets of one or two unwanted sexual behaviours in a public place, this proportion was 24% of women and 9% of men.
In addition to reporting having experienced emotional repercussions or having changed their behaviour as a result of the most serious incident, those who experienced inappropriate sexual behaviour in public—specifically those who were the subject of several incidents—were also more likely to exhibit a certain amount of psychological distress. It should be noted, however, that psychological distress cannot be linked directly to inappropriate sexual behaviour. In some cases, distress may have preceded the unwanted behaviour; although even in such cases, unwanted behaviour may have intensified the pre-existing distress.
About one-third (35%) of women and 20% of men who experienced multiple incidents of inappropriate sexual behaviour in a public space rated their state of mental health as poor or fair, compared with 21% of women and 17% of men who experienced one or two unwanted behaviours, and 12% of women and 9% of men who were not subjected to such behaviours.
When asked about their general level of satisfaction with life, women who experienced inappropriate sexual behaviour in public several times were less likely to say they were very satisfiedNote than women who had experienced one or two unwanted sexual behaviours and those who had not experienced any such behaviours (20% compared with 36% and 46%, respectively).
In addition, 39% of women and 40% of men who experienced multiple unwanted sexual behaviours in public spaces stated that they had seriously contemplated suicide at some point in their lives, compared with 25% of women and 30% of men who experienced one or two sexual behaviours, and 24% of women and 21% of men who did not experience any unwanted sexual behaviour in public.
It should be noted that suicide rates are relatively high in the territories. A recent study also found that the suicide rate among Inuit was nine times higher than among non-Indigenous people (Kumar and Tjepkema 2019). The study cited a variety of possible causes, including, but not limited to, the consequences of colonization, community breakdown, marginalization, intergenerational transmission of trauma, lack of mental health services, poverty or low levels of education. Experiences of gender-based violence could therefore be added to these factors.
According to the SSPPS, in the territories one-third (33%) of Indigenous people (34% of Indigenous women and 31% of Indigenous men) have ever seriously contemplated suicide, compared with 18% of non-Indigenous people (21% of women and 16% of men). Among Indigenous people who experienced multiple unwanted sexual behaviours in public spaces, this proportion climbed to 51% (50% of women and 52% of men). In comparison, these proportions were 31% and 22%, respectively, among non-Indigenous women and men.
Unwanted behaviours online in the territories
Online harassment and violence are recognized as an emerging form of gender-based violence (Lewis et al. 2017). As in public spaces, everyone should have the freedom to use online spaces without feeling threatened or uncomfortable because of their gender, gender identity or sexual orientation. The SSPPS included questions about some negative online experiences, including through the use of smartphones or cellphones.
As is the case with inappropriate sexual behaviours in public spaces, some inappropriate behaviours online do not reach the threshold of a criminal act—i.e., an act punishable under the Criminal Code—and are therefore not taken into account in other surveys on crime and victimization. As people spend more and more time online, it is important to measure the nature and extent of certain inappropriate behaviours and their impact on residents of all gender identities in the territories.
It should be noted that the estimates presented in the next section are based on those who used the Internet in the 12 months preceding the survey. Internet access in the territories can vary by community. For example, one-quarter (25%) of territories residents living outside the capital cities reported not using the Internet over the last year, compared with 6% of capital city residents.
One in five Internet users in the territories experienced unwanted behaviour online in the 12 months preceding the survey
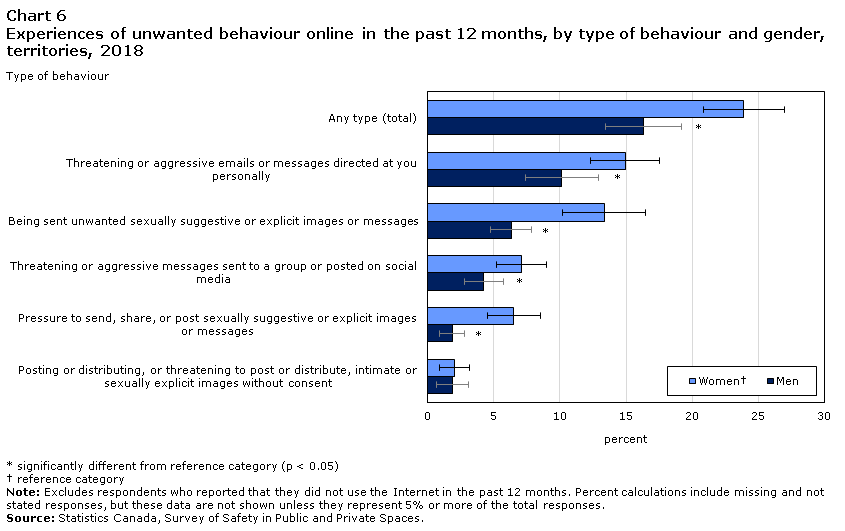
Of all Internet users in the territories, one in five (20%) reported being the target of one of the unwanted online behaviours measured by the SSPPS.Note The most common behaviours cited by respondents were receiving threatening or aggressive emails or messages directed at them (13%), as well as receiving unwanted sexually suggestive or explicit images or messages (10%). In contrast, relatively few (2%) reported that someone had published or threatened to publish intimate or sexually explicit images without their consent. Notably, this online behaviour could probably be considered the most serious as measured by the SSPPS, since it would meet the threshold for a criminal act in most cases (Table 1).
Similar to inappropriate sexual behaviour in public spaces, women in the territories were more likely than men to have been the target of unwanted behaviour online in 2018. Nearly one-quarter (24%) of women were targets of at least one of the unwanted behaviours measured by the SSPPS, compared with about one in six men (16%). The biggest difference was in the receiving of unwanted sexually suggestive or explicit images or messages (13% of women and 6% of men) (Table 1; Chart 6).
Chart 6 start
Data table for Chart 6
| Men | Standard error "Men" | WomenData table Note † | Standard error "Women" | |
|---|---|---|---|---|
| percent | ||||
| Any type (total) | 16.3Note * | 2.9 | 23.9 | 3.1 |
| Threatening or aggressive emails or messages directed at you personally | 10.2Note * | 2.8 | 14.9 | 2.6 |
| Being sent unwanted sexually suggestive or explicit images or messages | 6.3Note * | 1.6 | 13.3 | 3.1 |
| Threatening or aggressive messages sent to a group or posted on social media | 4.3Note * | 1.5 | 7.1 | 1.9 |
| Pressure to send, share, or post sexually suggestive or explicit images or messages | 1.9Note * | 1.0 | 6.5 | 2.0 |
| Posting or distributing, or threatening to post or distribute, intimate or sexually explicit images without consent | 1.9 | 1.2 | 2.0 | 1.1 |
Source: Statistics Canada, Survey of Safety in Public and Private Spaces. |
||||
Chart 6 end
Also, as was the case for unwanted behaviour in a public place, women were more likely to have experienced unwanted behaviour online multiple times, i.e., more than twice in the 12 months preceding the survey. Overall, just over one in six women (17%) experienced multiple instances of unwanted behaviours online, compared with 10% of men.
Young single women are more likely to experience unwanted behaviour online
Similar to what was observed for inappropriate sexual behaviour in public spaces, young women were more likely to report being subjected to unwanted behaviour online. One-third (33%) of women aged 15 to 24 were targets of such behaviours, while the proportion among women aged 25 to 34 was slightly lower (29%). By comparison, just under one in five (19%) men aged 15 to 34 and one in ten (11%) women aged 65 and over reported being the subject of unwanted behaviours online. However, there was much less variation by age among men than among women (Table 2).
Moreover, the proportions of single women who reported being subjected to unwanted behaviours were also relatively high. Overall, nearly 4 in 10 (38%) single women were targets of unwanted behaviour online, compared with 21% of single men and 15% of married or common-law women.
LGBTQ2+ people, people with disabilities and Métis women more often the target of unwanted behaviours online
As was the case for inappropriate sexual behaviour in public spaces, LGBTQ2+ people were more likely than their non-LGBTQ2+ counterparts to have experienced unwanted behaviour online in 2018. For example, just over one in five (22%) non-LGBTQ2+ women reported being the target of unwanted behaviours online; this proportion was more than double among LGBTQ2+ women (52%) (Table 2).
Similarly, territories residents with physical or mental disabilities were roughly twice as likely as those without disabilities to report having experienced unwanted behaviour online. In 2018, 35% of women and 26% of men with disabilities reported being subjected to unwanted behaviour online at least once, compared with 16% of women without disabilities and 12% of men without disabilities (Table 2).
Métis women were also proportionally more likely than non-Indigenous women to report having experienced unwanted behaviours online (36% compared with 21%, respectively). In contrast, the proportion of First Nation women and Inuit women who reported having experienced unwanted behaviours online were relatively similar to that recorded among non-Indigenous women. Similarly, the proportions of Indigenous men who reported having experienced unwanted behaviours online were similar to the proportion reported by non-Indigenous men (Table 2).
As observed with inappropriate sexual behaviour in public spaces, individuals belonging to or identifying with multiple minority or marginalized groups or identities were particularly at risk of unwanted behaviour online. For example, more than two-thirds (68%) of LGBTQ2+ people with physical or mental disabilities were targets of unwanted behaviours online, compared with 14% of non-LGBTQ2+ people without disabilities. Similarly, 52%Note of Métis women with a disability and 43% of First Nations women with a disability were targets of unwanted behaviours online, compared with 12% of non-Indigenous men with no disability, which confirms the double disadvantage of having a disability and being part of a marginalized group noted in a previous study (Hahmann et al. 2019).
In the majority of cases, a man acting alone was responsible for the unwanted behaviour online
Just as with sexual behaviour in public spaces, the person behind the unwanted behaviour online was, in most cases, a man acting alone.
About 7 in 10 women (71%) and 6 in 10 men (59%) indicated that a single person was behind the unwanted behaviour online. Given that perpetrators of unwanted behaviours online benefit from a certain amount of anonymity, 13% of those who had experienced at least one unwanted behaviour online could not say how many people were responsible for the most serious incident (Table 4).
Among those who were able to identify the number of people behind the unwanted behaviour, the majority indicated that the person or persons behind the behaviour was a man (or men). This was the case for 63% of women. Although a majority of women identified a man (or men) as the perpetrator of the most serious incident of unwanted behaviour online, this proportion was significantly lower than that reported for inappropriate sexual behaviour in public spaces (93%).
The majority of people who experienced unwanted behaviours online reported experiencing negative emotional impacts
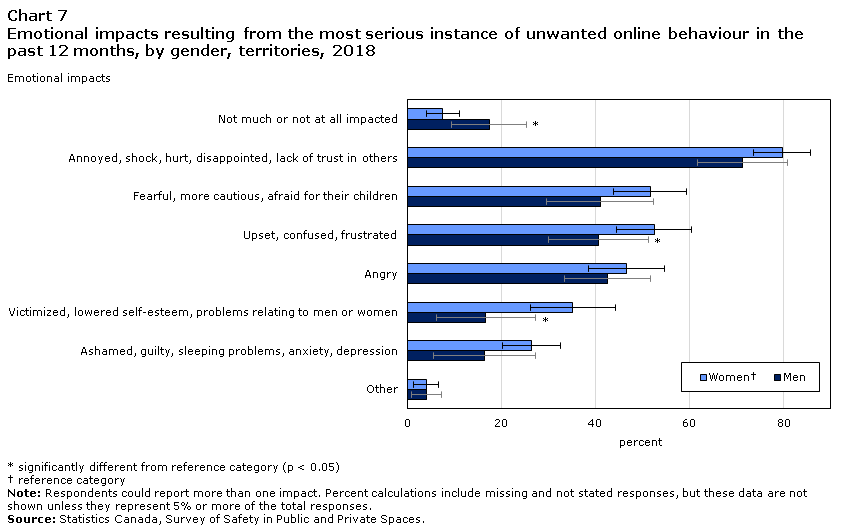
Even when they do not occur in the “physical” world, and even if they do not all reach the threshold of a criminal act, inappropriate online behaviour can nevertheless have negative consequences for those who experience it. Overall, relatively few people (8% of women and 17% of men) who experienced it reported having been affected little or not at all by the most serious incident (Chart 7).
Chart 7 start
Data table for Chart 7
| Men | Standard error "Men" | WomenData table Note † | Standard error "Women" | |
|---|---|---|---|---|
| percent | ||||
| Not much or not at all impacted | 17.3Note * | 8.0 | 7.5 | 3.6 |
| Annoyed, shock, hurt, disappointed, lack of trust in others | 71.2 | 9.7 | 79.6 | 6.1 |
| Fearful, more cautious, afraid for their children | 40.9 | 11.5 | 51.6 | 7.8 |
| Upset, confused, frustrated | 40.5Note * | 10.6 | 52.4 | 8.0 |
| Angry | 42.5 | 9.2 | 46.5 | 8.1 |
| Victimized, lowered self-esteem, problems relating to men or women | 16.6Note * | 10.5 | 35.2 | 9.1 |
| Ashamed, guilty, sleeping problems, anxiety, depression | 16.3 | 10.9 | 26.4 | 6.2 |
| Other | 4.0 | 3.2 | 3.9 | 2.6 |
Source: Statistics Canada, Survey of Safety in Public and Private Spaces. |
||||
Chart 7 end
The most frequently cited negative emotional reactions of those who experienced unwanted behaviours online were being annoyed, shocked, in disbelief, disappointed or less trusting of others (80% of women and 71% of men). Many also reported that the most serious incident made them more fearful or cautious (52% of women and 41% of men) or angry or frustrated (52% of women and 41% of men).
Majority of people who experienced unwanted behaviour online talked to someone about the most serious incident
Another indication that unwanted behaviour online has a negative impact is that the majority of people who have experienced it felt the need to talk to someone about the incident. Overall, women were more likely than men to talk to someone about the incident: 82% of women who experienced unwanted behaviour online confided in someone about the most serious incident. By comparison, this proportion was 57% among men (Chart 8).
Chart 8 start

Data table for Chart 8
| Men | Standard error "Men" | WomenData table Note † | Standard error "Women" | |
|---|---|---|---|---|
| percent | ||||
| Spoke to someone (total) | 56.9Note * | 10.4 | 82.1 | 5.3 |
| Friends | 31.9Note * | 9.2 | 56.4 | 7.7 |
| Family | 33.3Note * | 9.3 | 52.6 | 9.5 |
| Co-workers | 11.9 | 5.8 | 17.7 | 5.3 |
| Counsellor or psychologist | Note F: too unreliable to be published | Note F: too unreliable to be published | 14.2 | 5.5 |
| Friends online | Note F: too unreliable to be published | Note F: too unreliable to be published | 9.0 | 4.7 |
| Police | Note F: too unreliable to be published | Note F: too unreliable to be published | 10.6 | 5.6 |
| Service administrator or Internet service provider | Note F: too unreliable to be published | Note F: too unreliable to be published | 7.8 | 4.8 |
| Lawyer | Note F: too unreliable to be published | Note F: too unreliable to be published | 5.7 | 3.4 |
| Neighbours | Note F: too unreliable to be published | Note F: too unreliable to be published | 5.4 | 3.1 |
| Other | Note F: too unreliable to be published | Note F: too unreliable to be published | 5.1 | 2.9 |
| Did not talk to anyone | 40.3Note * | 10.4 | 17.5 | 5.3 |
F too unreliable to be published
Source: Statistics Canada, Survey of Safety in Public and Private Spaces. |
||||
Chart 8 end
In the majority of cases, those who experienced unwanted behaviour online discussed it with friends (56% of women, 32% of men) or family members (53% of women, 33% of men). Individuals who experienced unwanted behaviours online rarely turned to the police (11% of women) or to the site administrator or their Internet provider (8% of women).Note
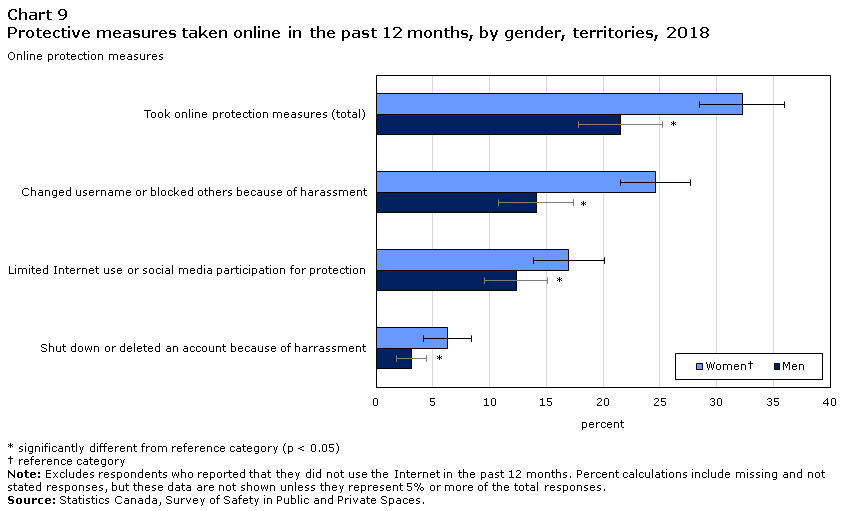
Many Internet users in the territories take steps to protect themselves from online harassment or unwanted behaviour
Previous studies have shown that women are generally more likely to take steps to protect themselves from criminal victimization (Perreault 2017; Brennan 2011b). The same pattern can also be seen with people protecting themselves against online harassment and unwanted behaviour. Overall, 32% of women and 22% of menNote reported that in the past 12 months, they took steps to protect themselves from harassment online (Chart 9).
Chart 9 start
Data table for Chart 9
| Online Protection Measures | Men | Standard error "Men" | WomenData table Note † | Standard error "Women" |
|---|---|---|---|---|
| percent | ||||
| Took online protection measures (total) | 21.5Note * | 3.7 | 32.2 | 3.8 |
| Changed username or blocked others because of harassment | 14.1Note * | 3.3 | 24.6 | 3.1 |
| Limited Internet use or social media participation for protection | 12.4Note * | 2.8 | 17.0 | 3.1 |
| Shut down or deleted an account because of harrassment | 3.1Note * | 1.3 | 6.3 | 2.1 |
Source: Statistics Canada, Survey of Safety in Public and Private Spaces. |
||||
Chart 9 end
Among the protective measures mentioned in the SSPPS, changing one’s username or blocking people due to harassment was most often mentioned (25% of women and 14% of men). Restricting their use of the Internet or participation on social media to protect themselves was also a frequently cited measure (17% of women and 12% of men). Less often, people deactivated or deleted an account due to harassment (6% of women and 3% of men).
Inappropriate sexual behaviour in the workplace in the territories
In addition to public and online spaces, the workplace is also an environment in which unwanted or inappropriate sexual behaviour can occur. Using a set of questions adapted from the Survey on Sexual Misconduct in the Canadian Armed Forces, SSPPS respondents were asked if they had witnessed or experienced certain sexual behaviours in the workplace or in a situation associated with work (such as an approved work-related event, celebration or training exercise).
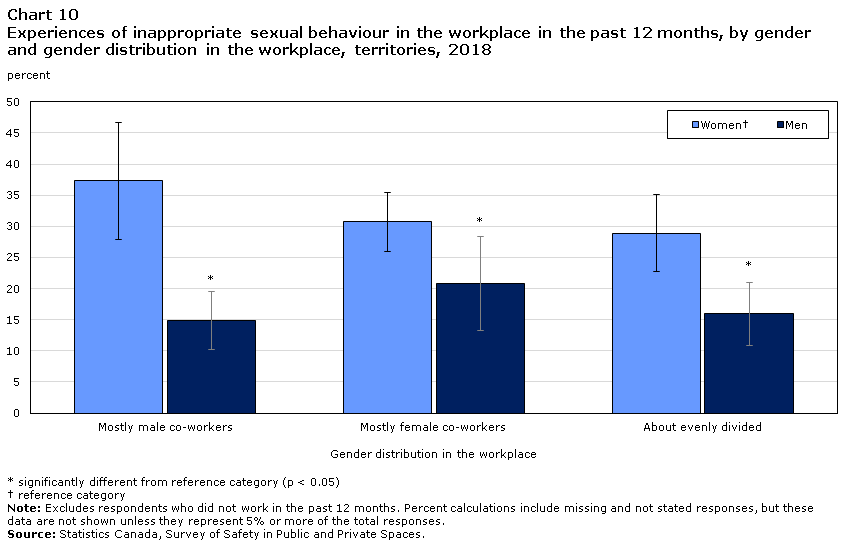
Women in the territories are twice as likely as men to have been the target of inappropriate sexual behaviour in the workplace
Overall, nearly one-third (31%) of women who were currently employed or had been employed at any time during the last year were directly targeted with at least one inappropriate sexual behaviour in the workplace. This was almost double what was reported among men (16%) (Table 1).
Moreover, 37% of women whose co-workers were mostly men reported being subjected to inappropriate sexual behaviour. Although this proportion is not significantly higher than among women in workplaces where most colleagues were women (31%) or in workplaces with gender parity (29%), it is significantly higher than the proportion among men in workplaces where most colleagues were men (15%) (Chart 10).
Chart 10 start
Data table for Chart 10
| WomenData table Note † | Standard error "Women" | Men | Standard error "Men" | |
|---|---|---|---|---|
| percent | ||||
| Mostly male co-workers | 37.3 | 9.5 | 14.9Note * | 4.7 |
| Mostly female co-workers | 30.7 | 4.8 | 20.8Note * | 7.6 |
| About evenly divided | 28.9 | 6.2 | 15.9Note * | 5.1 |
Source: Statistics Canada, Survey of Safety in Public and Private Spaces. |
||||
Chart 10 end
The most common inappropriate sexual behaviour in the workplace was inappropriate sexual jokes, which were experienced by 20% of women and 9% of men. As noted in other studies (Burczycka 2020; Cotter 2019), the biggest difference between men and women was observed for unwanted sexual attention (e.g., whistles, calls, suggestive looks, gestures or body language). About one in six women (17%) reported being subjected to such behaviour, compared with one in fifty men (2%) (Table 1).
People with disabilities and LGBTQ2+ people more commonly targeted with inappropriate sexual behaviour in the workplace, but Inuit women were less
Overall, the characteristics of those who more commonly experienced inappropriate sexual behaviour in the workplace were relatively similar to those who experienced other types of gender-based violence.
As with other types of inappropriate behaviour, LGBTQ2+ people were more likely to have been subjected to inappropriate sexual behaviour in the workplace. For example, 54% of LGBTQ2+ women were targets of such behaviours, compared with 29% of non-LGBTQ2+ women and 16% of non-LGBTQ2+ men (Table 2).
Individuals with disabilities, particularly women, were also more likely to have been targets of inappropriate sexual behaviour in the workplace. In 2018, 39% of women with disabilities in the territories experienced inappropriate sexual behaviour in the workplace, compared with 25% of women without disabilities. For men, in contrast, there were no differences between men with a disability and men with none (Table 2).
Contrary to what was observed for inappropriate sexual behaviour in public places and online, there was little difference by age, particularly among women. For example, among all women, the proportion of women reporting having been subjected to unwanted sexual behaviour in the workplace was between 30% and 39% in all age groups 15 to 54 (Table 2).
Lastly, as with inappropriate sexual behaviour in public places, Indigenous women in the territories were less likely to report being subjected to inappropriate sexual behaviour in the workplace than non-Indigenous women (24% versus 36%, respectively). This difference was mainly attributable to the relatively small proportion of Inuit women (13%) who reported being the target of unwanted behaviours in the workplace. First Nations women (40%) and Métis women (28%) reported having experienced sexual behaviours in the workplace in a proportion that was not statistically different from that reported by non-Indigenous women (36%) (Table 2). It may be possible that the relatively low proportion reported by Inuit women could be partly attributed to different nature of workplaces. It is also possible that a normalization of violence noted by certain studies (Brassard et al. 2015; Williams 2019) may have contributed to an under-reporting of some unwanted behaviours, especially the less serious ones.
Half of territories residents have experienced at least one form of inappropriate behaviour measured by the SSPPS
Although it likely does not cover all situations Canadians may face in terms of gender-based violence, the SSPPS does measure a large array of inappropriate sexual behaviours which can have negative consequences on the person who experiences them, even if they do not reach the threshold of a criminal act. Most importantly, they are part of a continuum of violence and inequality in which physical and sexual assault are also rooted (Bastomski and Smith 2017; Mellgren et al. 2018). Territories residents’ experiences of sexual and physical assaults will be examined in a separate report, to be publish at a later date.
When all the inappropriate behaviours and situations measured by the SSPPS are considered together—that is, those that occur in public spaces, online and in the workplace—data reveal that half of women (48%) in the territories experienced some form of unwanted behaviour during the year preceding the survey. Among men, this was true for about one-third (32%) (Table 2).
More importantly, the data show that it is often the same people who experience unwanted behaviours. In the majority of cases, those who reported being the subject of unwanted behaviour reported having it happen to them on several occasions. Similarly, those most at risk often reported being the subject of inappropriate behaviour in more than one situation, i.e., in public, online and in the workplace.
Overall, 7% of women and 2% of men in the territories experienced unwanted behaviours in all three situations measured by the SSPPS. However, 24% of LGBTQ2+ women experienced inappropriate behaviour in each of the three situations measured by the SSPPS. By comparison, this was the case for 1% of non-LGBTQ2+ men. Similarly, 15% of single women, 14% of women with disabilities, 13% of First Nations women and 13% of young women aged 15 to 24 experienced inappropriate behaviour in each three situations.
As mentioned earlier, the combination of such experiences has a particularly negative impact and consequences on those who are targeted. These behaviours, especially when they are frequent and present in multiple facets of life, also erode the sense of safety of the people who experience them, causing some to withdraw or not fully enjoy their daily activities and public spaces (Bastomski and Smith 2017; Kearl 2010).
Summary
This Juristat article presents the first results of the Survey of Safety in Public and Private Spaces (SSPPS) conducted in the territories in 2018, in order to provide information on unwanted sexual behaviours in public places, online and the workplace.
Traditional victimization surveys are mostly limited to measuring incidents of a criminal nature. Data collected through the SSPPS on unwanted behaviours in public, online and the workplace therefore fills an important statistical gap. While not all of these behaviours are necessarily criminal in nature, they can have a significantly adverse effect on the sense of safety and security, as well as the overall well-being of those who experience them. However, the nature and extent of these behaviours across Canada and the territories more specifically was previously unknown.
Data from the SSPPS reveal that many residents of the territories have experienced unwanted sexual behaviour, and that women are generally much more likely to be targeted than men. Just over one-third (35%) of women and 16% of men have experienced unwanted sexual behaviour in public. Similar proportions (31% and 16% respectively) had these experiences in the workplace. Nearly one-quarter (24%) of women and 16% of men who used the Internet were targets of unwanted behaviour online.
Certain people are subjected to repeated unwanted behaviour. The majority of women in the territories (65%) were not subjected to any unwanted sexual behaviour in a public place; however, 25% of women, or 72% of those who were subjected to at least one unwanted sexual behaviour in a public place, were repeatedly subjected to it. Similarly, 24% of LGBTQ2+ women, 15% of single women, 14% of women with a disability, 13% of First Nations women and 13% of young women aged 15 to 24 were subjected to inappropriate behaviours in each of the three situations measured by the SSPPS (in public, online and in the workplace). By comparison, this was the case for 2% of men overall.
Findings from the SSPPS confirm that the majority of people, and especially women, who experienced unwanted sexual behaviour, whether in a public place or online, felt emotional and psychological impacts. More precisely, only one in eight women (12%) and one in four men (26%) reported they had not been emotionally impacted by the most serious incident they experienced. Furthermore, a majority of those who experienced unwanted behaviour in a public place have changed certain habits as a result of the most serious incident, such as avoiding certain places or ceasing to participate in certain activities.
Individuals who experienced multiple behaviours were more likely to report experiencing impacts. They were also more likely to rate their mental health as poor or fair, or to have seriously considered suicide at some point in their lives. These results therefore appear to demonstrate the negative effect induced by multiple incidents, where each additional incident has the potential of increasing or intensifying an emotional and psychological vulnerability to subsequent incidents.
Detailed data tables
Survey description
In 2018, Statistics Canada conducted the first cycle of the Survey of Safety in Public and Private Spaces (SSPPS). The purpose of the survey is to collect information on Canadians’ experiences of unwanted sexual behaviours in public spaces, at work, online, as well as experiences with physical and sexual assaults and violence in their intimate partner relationships. Data on physical and sexual assaults and intimate partner violence will be analyzed in a separate report to be released later.
The target population for the SSPPS is the Canadian population aged 15 and over, living in the provinces and territories. Canadians residing in institutions are not included. Once a household was contacted, an individual 15 years or older was randomly selected to respond to the survey.
In the territories, data collection took place from July to December 2018 inclusively. Responses were obtained by self-administered online questionnaire or by interviewer-administered in-person questionnaire. Respondents were able to respond in the official language of their choice. According to 2016 Census, 2% of territories residents indicated they had no knowledge of at least one official language. This proportion varied from 0.4% in Yukon to 5.7% in Nunavut.
The sample size for the 3 territories was 2,597 respondents. The overall response rate was 73.2%. Non-respondents included people who refused to participate, could not be reached, or could not speak English or French. Respondents in the sample were weighted so that their responses represent the non-institutionalized Canadian population aged 15 and older.
Data limitations
As with any household survey, there are some data limitations. The results are based on a sample and are therefore subject to sampling errors. Somewhat different results might have been obtained if the entire population had been surveyed.
For the quality of estimates, the lower and upper bounds of the confidence intervals are presented. Confidence intervals should be interpreted as follows: If the survey were repeated many times, then 95% of the time (or 19 times out of 20), the confidence interval would cover the true population value.
References
Bastomski, S. and P. Smith. 2017. “Gender, fear, and public places: How negative interactions with strangers harm women.” Sex Roles. Vol. 76. p. 73-88.
Benoit, C., Shumka, L., Phillips, R., Kennedy, M. and L. Belle-Isle. 2015. Issue Brief: Sexual Violence Against Women in Canada. December. Status of Women Canada.
Boyce, J. 2016. "Victimization of Aboriginal people in Canada, 2014." Juristat. Statistics Canada Catalogue no. 85-002-X.
Brassard, R., Montminy, L., Bergeron, A.-S. and I. Sosa-Santchez. 2015. “Application of intersectional analysis to data on domestic violence against Aboriginal women living in remote communities in the province of Quebec”, Aboriginal Policy Studies. Vol. 4, no. 1. p. 3-23.
Brennan, S. 2011a. ”Violent victimization of Aboriginal women in the Canadian provinces, 2009.” Juristat. Statistics Canada Catalogue no. 85-002-X.
Brennan, S. 2011b. “Canadians' perceptions of personal safety and crime, 2009.” Juristat. Statistics Canada Catalogue no. 85-002-X.
Burczycka, M. 2018a. "Stalking in Canada, 2014." In Family violence in Canada: A statistical profile, 2017. Juristat. Statistics Canada Catalogue no. 85-002-X.
Burczycka, M. 2018b. “Violent victimization of Canadians with mental health-related disabilities, 2014.” Juristat. Statistics Canada Catalogue no. 85-002-X.
Burczycka, M. 2020. “Students’ experiences of unwanted sexualized behaviours and sexual assault at postsecondary schools in the Canadian provinces, 2019.” Juristat. Statistics Canada Catalogue no. 85-002-X.
Conroy, S. 2018. “Police-reported violence against girls and young women in Canada, 2017.” Juristat. Statistics Canada Catalogue no. 85-002-X.
Cotter A. and L. Savage. 2019. “Gender-based violence and unwanted sexual behaviour in Canada, 2018: Initial findings from the Survey of Safety in Public and Private Spaces.” Juristat. Statistics Canada Catalogue no. 85-002-X.
Cotter, A. 2019. Sexual Misconduct in the Canadian Armed Forces Regular Force, 2018. Statistics Canada Catalogue no. 85-603-X.
Cotter, A. 2018. "Violent victimization of women with disabilities, 2014.” Juristat. Statistics Canada Catalogue no. 85-002-X.
Crenshaw, K. 1994. "Mapping the margins: Intersectionality, identity politics, and violence against women of color". In: M. Albertson Fineman, R. Mykitiuk, (Eds). The Public Nature of Private Violence. Routledge, New York.
Elias, B. Mignone, J., Hall, M., Hong, S. P., Hart, L. and J. Sareen. 2012. “Trauma and suicide behaviour histories among a Canadian indigenous population: An empirical exploration of the potential role of Canada's residential school system.” Social Science & Medicine. Vol. 74, no. 10. p. 1560-1569.
Fileborn, B. and F. Vera-Gray. 2017. “I want to be able to walk the street without fear.” Feminist Legal Studies. Vol. 25, no. 2, p. 203-227.
Firestone, M., Tyndall, M. and B. Fischer. 2015. “Substance use and related harms among Aboriginal people in Canada: A comprehensive review.” Journal of Health Care for the Poor and Underserved. Vol. 26, no. 4.
Fisher, S., Lindner, D. and C.J. Ferguson. 2017. “The effects of exposure to catcalling on women’s state self-objectification and body image.” Current Psychology. October 2017. p. 1-8.
Gardner, N., Cui, J. and E. Coiacetto. 2017. “Harassment on public transport and its impacts on women’s travel behaviour.” Australian Planner. Vol. 54, no. 1. p. 8-15.
Hahmann, T., Badets, N. and J. Hughes. 2019. Indigenous People with Disabilities in Canada: First Nations people living 0ff Reserve, Métis and Inuit Aged 15 Years and Older. Statistics Canada Catalogue no. 89-653-X.
Jaffray, B. 2020 (To be released). “Experiences of violent victimization and unwanted sexual behaviours among sexual minority and transgender Canadians, 2018.” Juristat. Statistics Canada Catalogue no. 85-002-X.
Kearl, H. 2010. Stop Street Harassment: Making Public Places Safe and Welcoming for Women. ABC-CLIO (ed.) Santa Barbara.
Kumar, M.B. and M. Tjepkema. 2019. Suicide Among First Nations People, Métis and Inuit (2011-2016): Findings from the 2011 Canadian Census Health and Environment Cohort (CanCHEC). Statistics Canada Catalogue no. 99-011-X.
Lewis, R., Rowe, M. and C. Wiper. 2017. “Online abuse of feminists as an emerging form of violence against women and girls.” British Journal of Criminology. Vol. 57. p. 1462-1481.
Mellgren, C., Andersson, M. and A-K. Ivert. 2018. “’It happens all the time’: Women’s experiences and normalization of sexual harassment in public space.” Women & Criminal Justice. Vol. 28. p. 262-281.
Missing and Murdered Indigenous Women and Girls. 2019. Reclaiming Power and Place: The Final Report of the National Inquiry into Missing and Murdered Indigenous Women and Girls. (accessed on July 6th, 2020).
Moreau, G. 2019. “Police-reported crime statistics, 2018.” Juristat. Statistics Canada Catalogue no. 85-002-X.
Perreault, S. 2017. “Canadians’ perceptions of personal safety and crime, 2014.” Juristat. Statistics Canada Catalogue no. 85-002-X.
Perreault, S. and L. Simpson. 2016. “Criminal victimization in the territories, 2014.” Juristat. Statistics Canada Catalogue no. 85-002-X.
Perreault, S. 2015. "Criminal victimization in Canada, 2014." Juristat. Statistics Canada Catalogue no. 85-002-X.
Perreault, S. 2011. “Violent victimization of Aboriginal people in the Canadian provinces, 2009.” Juristat. Statistics Canada Catalogue no. 85-002-X.
Perreault, S. 2009. “Criminal Victimization and Health: A Profile of Victimization Among Persons with Activity Limitations or Other Health Problems.” Canadian Centre for Justice Statistics Profile Series. Statistics Canada Catalogue no. 85F0023M.
Rotenberg, C. 2019. “Police-reported violent crimes against young women and girls in Canada’s Provincial North and Territories, 2017.” Juristat. Statistics Canada Catalogue no. 85-002-X.
Simpson, L. 2018. "Violent victimization of lesbians, gays and bisexuals in Canada, 2014." Juristat. Statistics Canada Catalogue no. 85-002-X.
United Nations Office of the High-Commissioner for Human Rights. 2019. Report of the Special Rapporteur on Violence Against Women, Its Causes and Consequences – Visit To Canada. Report no. A/HRC/41/42/Add.1.
Women and Gender Equality Canada. 2018. About Gender-Based Violence. (accessed on July 6th, 2020).
Williams, J. 2019. Intersections Between Violence and Health Promotion Among Indigenous Women Living in Canada. (Thesis) University of Ottawa.
- Date modified: