
Measuring efficiency in the Canadian adult criminal court system: Criminal court workload and case processing indicators

Archived Content
Information identified as archived is provided for reference, research or recordkeeping purposes. It is not subject to the Government of Canada Web Standards and has not been altered or updated since it was archived. Please "contact us" to request a format other than those available.
by Maisie Karam, Jennifer Lukassen, Zoran Miladinovic, and Marnie Wallace
Highlights
- In the eight years leading up to the July 2016 R. v. Jordan Supreme Court of Canada decision, which established a presumptive ceiling of 18 months for provincial court cases without a preliminary inquiry, and 30 months otherwise, a variety of court processing and workload indicators increased at the national level: caseload, case processing times, the average age of open cases, and the number of court appearances per final decision. At the same time, there was a decrease in other indicators: case completion rates, and case initiations and completions.
- Since the Jordan decision, a number of court indicators showed a reversal in trend. Caseload, cases at risk of exceeding the time limits established in Jordan, and the number of active days per final decision decreased, while case completion rates increased.
- Case processing times have continued to increase since the Jordan decision. This, coupled with an increase in case completion rates suggests that the courts are making an effort to complete older cases, possibly as a response to the Jordan decision.
- The percentage of cases potentially at risk of exceeding the eventual limits set out by Jordan gradually rose over the past decade, reaching a peak of 9.5% in 2014/2015. By 2017/2018, a year after the decision, this percentage reached its lowest level in seven years, at 6.4%.
- Every province and territory had a lower percentage of cases potentially at risk of exceeding the ceiling in 2017/2018 than they did in the previous two years. The Northwest Territories (1.7%) and Prince Edward Island (1.8%) had the lowest percentage at-risk in 2017/2018; in contrast, Alberta (8.4%) and Nova Scotia (8.3%) had the highest.
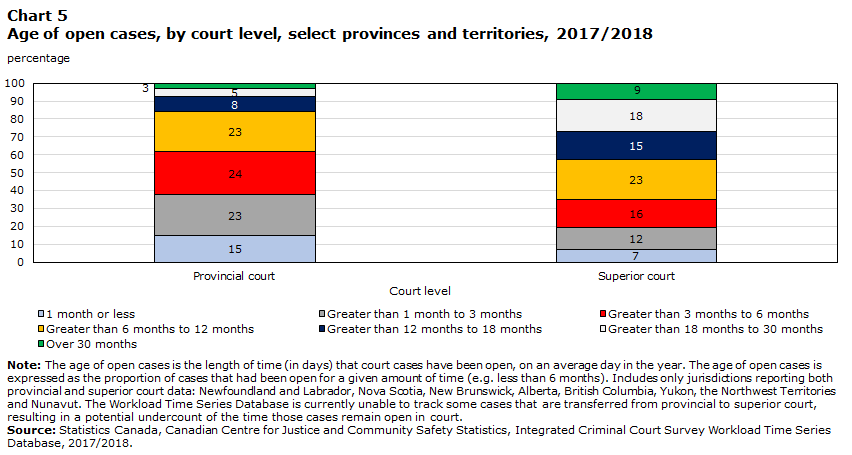
- On any given day in 2017/2018, the large majority (84%) of open cases in Canadian adult criminal courts were less than one year old. Furthermore, most (61%) were less than six months old. The age of open cases varies between the provinces and territories, with Prince Edward Island having the lowest percentage of opens cases over one year old, and Newfoundland and Labrador having the highest percentage.
- The number of cases both initiated and closed over the ten-year period 2008/2009 to 2017/2018 declined. There were notable declines in case initiations for Criminal Code traffic offences (such as impaired driving) and other federal statutes. Generally, the observed decreases were more pronounced in superior court than provincial court (-38% versus -12%).
- More court appearances occur for every final decision made by the court now when compared to ten years ago. In 2008/2009, there were 7.1 court appearances for every final decision. In 2014/2015, leading up to the Jordan decision, there were 8.0 and by 2017/2018, this number had increased to 8.5.
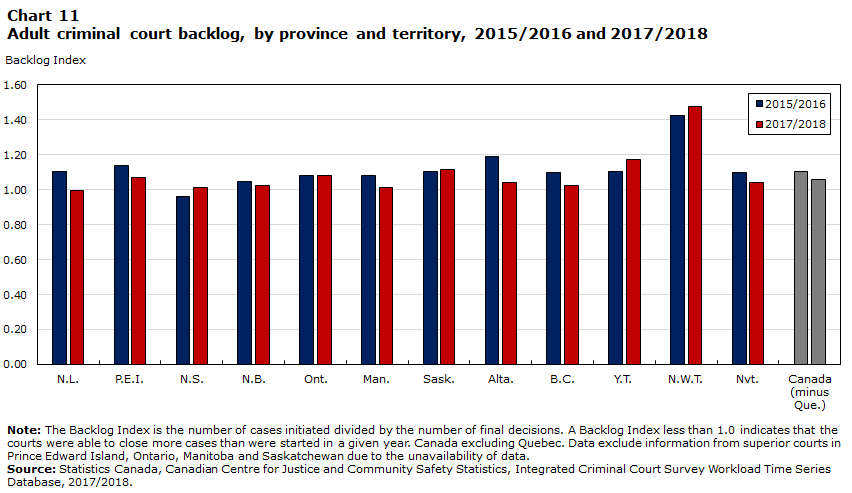
- The national adult criminal court Backlog Index, which measure a court’s ability to keep up with its incoming caseload, peaked at 1.11 in 2015/2016, just prior to the Jordan decision. In 2017/2018, it dropped to 1.06. It has decreased in most jurisdictions between 2015/2016 and 2017/2018. Alberta (1.19 to 1.04) and Newfoundland and Labrador (1.10 to 0.99) reported the largest drops. Conversely, the court Backlog Index in the Northwest Territories rose from 1.42 to 1.48, the highest in the country.
Introduction
The efficiency and effectiveness of the Canadian criminal justice system has been a key focus of national discussion in recent years. Despite recent declines in the crime rate and a decreasing number of completed court cases nationally, charges in Canadian criminal courts have been taking longer to complete over the past decade (Miladinovic 2019b). This apparent disconnect has resulted not only in the Supreme Court of Canada’s R. v. Jordan decision (see Text Box 2) which imposed a presumptive ceiling for completing criminal court cases beyond which the delay is considered unreasonable, but has also sparked renewed interest in improving and measuring the efficiency of the current criminal justice system.
The Department of Justice Canada undertook a criminal justice system review starting in 2015 and spanning a three-year period, in which stakeholders, partners and Canadians were consulted on their ideas regarding how to strengthen and modernize the criminal justice system (Department of Justice Canada 2019a). Throughout this review, participants highlighted a number of key concerns, including lengthy delays for a case to get to trial, long case processing times, and a court system that is overly occupied with relatively minor administration of justice offences.
Around the same time, the Standing Senate Committee on Legal and Constitutional Affairs was mandated to review the roles of the Government of Canada and Parliament in addressing court delays. In addition to releasing 50 recommendations, the final report, Delaying Justice is Denying Justice: an Urgent Need to Address Lengthy Court Delays in Canada (2017), identified a number of factors contributing to lengthy delays including a lack of robust case management, a shortage of judges, prosecutors and courtrooms, as well as the increasing complexity of criminal trials.
Lengthy trials and other delays in court case processing have a significant impact on both accused persons and victims, as the stress of waiting for a resolution is made worse by each adjournment. Further, lengthy and delayed criminal proceedings have an impact on the quality and reliability of evidence (Senate Canada 2017). Ongoing and repeated delays in the court system can also diminish public confidence in the criminal justice system, which is fundamental to its operation.
Recent attempts have been made to address the inefficiencies that have been identified, including the introduction of former Bill C-75 (An Act to amend the Criminal Code, the Youth Criminal Justice Act and to make consequential amendments to other Acts),Note which is intended to modernize the criminal justice system and reduce delays (Department of Justice Canada 2019b).
Historically, data from the Integrated Criminal Court Survey (ICCS) has focused on completed cases, allowing for a retrospective look at the work that has been completed by the courts. The national conversation on court efficiency, however, now requires the ability to analyze the full scope of work going on in the court system, including ongoing or active cases. The full extent of the challenges faced by the Canadian criminal justice system, as well as any future progress, can only be known through the ongoing measurement of various aspects of court workload and case processing.
This report introduces a series of new criminal court workload and case processing indicators (see Text Box 1) based on open cases in order to add to the ongoing conversation about the efficiency of criminal courts in Canada. The development of these new indicators was made possible because of strong collaborative partnerships with key stakeholders. The Canadian Centre for Justice and Community Safety Statistics (CCJCSS) at Statistics Canada would like to acknowledge those who shared in the growing interest to expand the standard ICCS indicators in order to address existing data gaps, in particular, the Sub-Committee on Court Statistics (CSI) for the Steering Committee on Justice Efficiencies and Access to the Justice System and the Heads of Court Administration, Court Statistics and Information Sub-Committee (HoCA CSI).
The analysis in this Juristat is divided into seven sections. The first looks at the inventory of open cases and addresses such questions as: how many court cases start in a given year, and how many are open at a given time? What do open cases look like? The second section begins to analyze the age of open cases. The third section focuses on at-risk cases, specifically how many are potentially at risk of being stayed due to unreasonable delays. The fourth section examines completion rates. An analysis of case processing times makes up the fifth section of the report. The sixth section focuses on court workload and attempts to answer questions concerning how much overall work goes into closing cases. The final section addresses court backlog and analyzes the courts’ ability to meet the demands of incoming cases. Throughout the report, trends are presented for the last 10-years, as well as by offence, province and territory, and court level where relevant.
In this Juristat, the Information case is used for all analysis. An Information is a formal document listing all of the offences with which an accused is charged. It can contain one charge or multiple charges; in some cases a single Information may also include multiple accused individuals. For the purpose of the workload and case processing indicators presented in this article, each Information case refers to the charge or charges listed against a single individual on a single Information. Please note, this Juristat excludes Quebec from the overall analysis due to the unavailability of trend data. For a detailed analysis of Quebec, see the Appendix.
Within the court system, offences against the administration of justice (such as breach of conditions, failure to appear, etc.) tend to arise during the course of an existing open case. New charges may be laid against an individual, often on a new Information,Note however the charges tend to proceed through the courts in conjunction with the original case. In order to avoid inflating Information–based case counts and the amount of time or unique appearances required to reach a final decision, Information cases comprised solely of administration of justice offences (AOJO) are excluded from the analysis in this report, unless explicitly stated otherwise. Refer to Text Box 3 for more information about offences against the administration of justice.
Start of text box 1
Text box 1
Workload and case processing indicators: Methodology, definitions and concepts
The Integrated Criminal Court Survey (ICCS) collects statistical information on adult criminal and youth court cases involving Criminal Code and other federal statute offences. The data presented in this Juristat are based on the adult criminal court portion of the survey.
Traditionally, data collected through the ICCS are organized into completed cases and provide information on work completed by the courts in relation to court outcomes (decisions and sentencing). In order to begin examining the full scope of work done by criminal courts in Canada, a new database, the ICCS Workload Time Series (WTS) Database, has been created using data collected via the ICCS but re-organized to allow for the analysis of open cases in addition to completed cases. The file contains a series of new indicators, developed in consultation with key stakeholders and calculated for three different time intervals: month, quarter, and fiscal year. For the purpose of this Juristat, the data concepts and results are presented for fiscal years (April 1 through March 31) only.
There are a number of key concepts relevant to the data contained within the WTS Database:
Information: An Information is a written document that is sworn under oath, typically by a police officer or Crown counsel, to a justice of the peace that alleges a person has committed a criminal offence. The laying of the Information initiates criminal proceedings against an accused. Multiple accused may be listed on a single Information.
Information case: An Information case combines all charges against a single accused that are laid under a single Information. In this Juristat, an Information case will simply be referred to as a case.
Open case: A case that is filed in court but has not yet received a final decision. Encompasses both active and pending cases.
Caseload: The average number of cases open on any given day in the year.
Initiated case: A case with a first appearance in that year.
Age of cases: The length of time (in days) that court cases have been open, on an average day in the year. It is expressed as the proportion of cases that had been open for a given amount of time (e.g. less than 6 months).
At-risk cases: The proportion of open cases that are potentially at risk of surpassing the presumptive limits set out in the Supreme Court of Canada’s R. v. Jordan decision (see Text Box 2), beyond which delays are considered unreasonable. Time limits for the completion of criminal cases are set out as follows: 18 months for cases tried in provincial court; and 30 months for cases tried in superior court or in provincial court following a preliminary inquiry.Note
Most laborious offence (MLO): Cases which include multiple charges have been assigned a representative offence based on the average number of court appearances required to resolve a case (based on adult criminal court data for all charges completed over the last 5 years). Generally, the offence type that takes the most number of appearances to resolve is selected as the representative offence for the case.
Closed case: A case in which all charges against an individual laid out on a single Information filed in the court have received a final decision (may also be referred to as a completed case).
Completion Rate: The number of final decisions divided by the number of cases initiated, expressed as a percentage. A completion rate below 100% indicates that the courts closed fewer cases during the year than were initiated. For the completion rate, cases where the outcome is unknown have been excluded from the analysis and this may result in an underestimation of the total number of final decisions.
Workload: Court workload can be thought of as the amount of activity performed, or actions taken, to process criminal court cases within a specific period of time (e.g., a year).
Case processing time: The median elapsed time (in days) from a first court appearance to final decision in the case; or the sentencing date for cases that result in a finding of guilt.
Active days per final decision: The number of open days per final decision within a specific time period (e.g., a year). A lower number of days per final decision suggests that the courts used fewer days to close cases and that they are closing cases faster. Monitoring changes over time for the number of active days compared with the final decisions made by the court can provide an indication of how quickly, overall, courts are doing the work required to reach the same number of decisions.
Backlog Index: The number of cases initiated divided by the number of final decisions (the inverse of the completion rate). A Backlog Index greater than 1.0 suggests courts were unable to close as many cases as were initiated, creating a backlog in cases. A Backlog Index less than 1.0 suggests that courts were able to close more cases than were initiated, and able to successfully clear away some of the existing backlog. For the Backlog Index, cases where the outcome is unknown have been excluded from the analysis and this may result in an underestimation of the total number of final decisions.
End of text box 1
Open cases
The following section will focus on open cases. Open cases are those that have been filed in the court, and encompass both active and pending cases. In this way, the number of open cases can be taken to represent the amount of work currently before the courts.
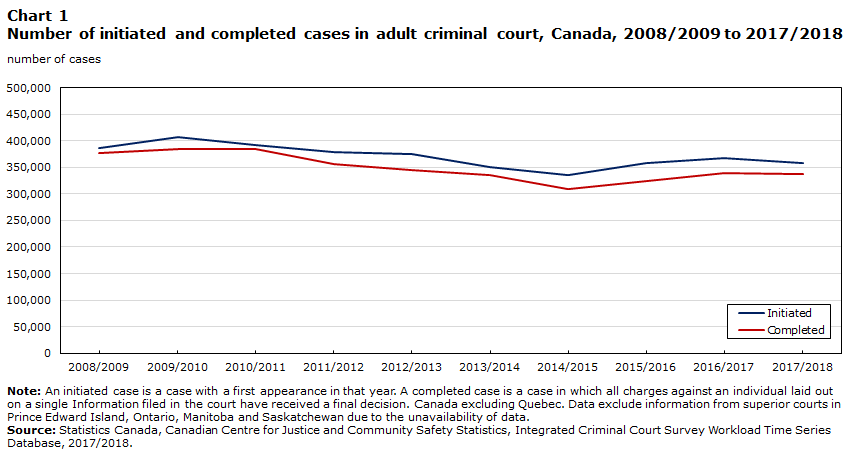
Fewer cases initiated and completed over the last decade
The number of cases initiated each year has generally decreased over time in Canada (Chart 1). Between 2008/2009 and 2017/2018, the number of initiated cases declined by about 7% (385,838 to 358,047). The number of charges initiated has followed a similar pattern to cases, however, it was higher in 2017/2018 than in 2008/2009 (793,882 versus 781,480).
There were fewer cases completed than initiated in every fiscal year over the same period. The gap between the number of initiated cases and the number of completed cases has generally increased over time. However, this gap has narrowed somewhat over the two most recent years (Chart 1).
Chart 1 start
Data table for Chart 1
| Case year | Initiated | Completed |
|---|---|---|
| number of cases | ||
| 2008/2009 | 385,838 | 376,038 |
| 2009/2010 | 407,667 | 383,506 |
| 2010/2011 | 391,028 | 383,590 |
| 2011/2012 | 378,150 | 355,624 |
| 2012/2013 | 375,445 | 344,913 |
| 2013/2014 | 350,259 | 334,955 |
| 2014/2015 | 335,358 | 308,672 |
| 2015/2016 | 358,495 | 324,123 |
| 2016/2017 | 366,756 | 339,030 |
| 2017/2018 | 358,047 | 338,073 |
|
Note: An initiated case is a case with a first appearance in that year. A completed case is a case in which all charges against an individual laid out on a single Information filed in the court have received a final decision. Canada excluding Quebec. Data exclude information from superior courts in Prince Edward Island, Ontario, Manitoba and Saskatchewan. Source: Statistics Canada, Canadian Centre for Justice and Community Safety Statistics, Integrated Criminal Court Survey Workload Time Series Database, 2017/2018. |
||
Chart 1 end
The decreases observed in the number of initiated cases can be partially attributed to a decline in the number of Criminal Code traffic offences (such as impaired driving) and other federal statutes. Between 2008/2009 and 2017/2018, the number of initiated cases in these offence groups decreased by 30% and 28%, respectively. The decline in Criminal Code traffic offences was driven largely by British Columbia. In 2010, British Columbia amended its provincial Motor Vehicle Act, with the result that some impaired driving incidents that would previously have been dealt with through the criminal courts were instead dealt with under provincial laws (Perreault 2016). The decline in other federal statute offences was driven to a moderate extent by a decrease in Controlled Drugs and Substances Act cases, including offences such as drug possession.
Of note, while the number of cases initiated has decreased in both provincial and superior courts over the past decade, the decrease was more pronounced in superior court than provincial court (-38% versus -12%, respectively).Note When making comparisons between provincial and superior court throughout this report, only those provinces or territories that report both levels of court are included. The provinces and territories are: Newfoundland and Labrador, Nova Scotia, New Brunswick, Alberta, British Columbia, Yukon, the Northwest Territories and Nunavut.
Among the provinces and territories, the majority (eight) saw a decline in cases initiated from 2008/2009 to 2017/2018. The largest decrease was observed in British Columbia (-33%). Four provinces saw an increase in cases initiated over this same period, with the largest being observed in Saskatchewan (+106%).
Start of text box 2
Text box 2
Trial within a reasonable time and the R. v. Jordan decision
The Canadian Charter of Rights and Freedoms forms part of the Constitution of Canada, laying out guarantees to certain rights and freedoms. Section 11(b) of the Charter states that an accused person charged with an offence has the right to be tried within a reasonable time.
While the Charter does not explicitly define what a reasonable time is, the courts have traditionally relied upon case law for guidance on the matter.
In July 2016, the Supreme Court of Canada released its R. v. Jordan decision (R. v. Jordan 2016). In its decision, the Supreme Court found that there were difficulties with the existing analytical framework in the case law in determining unreasonable delay. Additionally, it wrote of a “culture of complacency within the system towards delay.” It established a new framework for determining whether delay was reasonable. Under the new framework, the Supreme Court set out a presumptive ceiling beyond which delays are presumed to be unreasonable. This ceiling- between the date of charge and the actual or anticipated end of trial- is 18 months for cases tried in provincial court, and 30 months for cases tried in superior court. The 30 month ceiling also applies to cases tried in provincial court after a preliminary inquiry. Cases that exceed the presumptive ceiling are considered unreasonable, and a stay of proceedingsNote may result. Delay that is caused solely by the conduct of the defence is not counted. Delays that exceed the presumptive ceiling may be justified on the basis of exceptional circumstances, and it is the burden of the Crown to do so. Exceptional circumstances are those that are reasonably unforeseen or reasonably unavoidable, and cannot reasonably be remedied once they arise – For example, a catastrophic fire in the court house of a small community would be reasonably unforeseeable and not reasonably remedied. Delay resulting from such an event would qualify as an exceptional circumstance.
End of text box 2
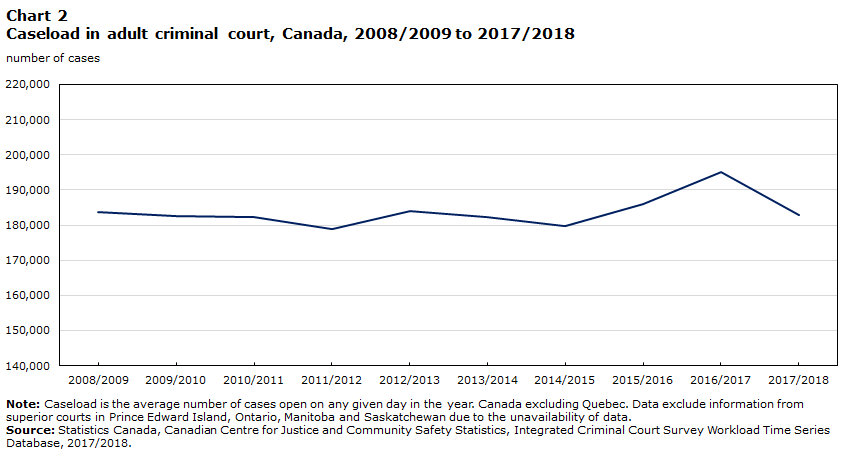
Increase in caseload in the years leading up to the Jordan decision, followed by a decline
Caseload, which can also be thought of as the average number of cases open on any given day in the time period, has varied over the period 2008/2009 to 2017/2018 in Canada (Chart 2). It stood at 183,698 cases in 2008/2009 and trended generally downward until reaching a low point (179,012) in 2011/2012. Following an increase in 2015/2016, the caseload being handled by Canadian courts reached its highest point (195,158 open cases) in 2016/2017. This is the same year that the Supreme Court of Canada released its R. v. Jordan decision. Criminal court caseload fell in the following year, down 6% to 182,910 (Chart 2).
Chart 2 start
Data table for Chart 2
| Case year | Caseload |
|---|---|
| number of cases | |
| 2008/2009 | 183,698 |
| 2009/2010 | 182,458 |
| 2010/2011 | 182,441 |
| 2011/2012 | 179,012 |
| 2012/2013 | 183,981 |
| 2013/2014 | 182,212 |
| 2014/2015 | 179,628 |
| 2015/2016 | 185,860 |
| 2016/2017 | 195,158 |
| 2017/2018 | 182,910 |
|
Note: Caseload is the average number of cases open on any given day in the year. Canada excluding Quebec. Data exclude information from superior courts in Prince Edward Island, Ontario, Manitoba and Saskatchewan due to the unavailability of data. Source: Statistics Canada, Canadian Centre for Justice and Community Safety Statistics, Integrated Criminal Court Survey Workload Time Series Database, 2017/2018. |
|
Chart 2 end
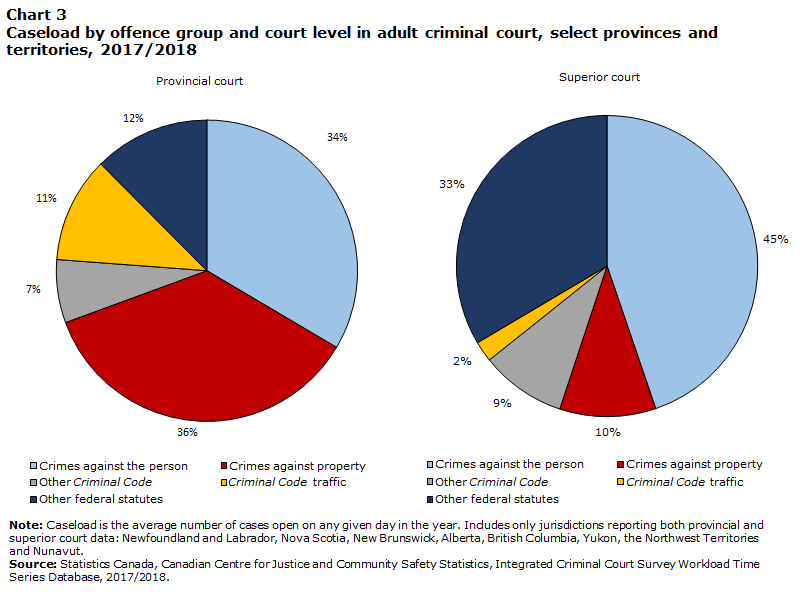
Crimes against the person account for a greater caseload in superior court
The types of cases handled by the courts differs by court level. Provincial court cases tend to have a more even distribution of offence types, with crimes against the person and crimes against property each making up roughly one-third of the caseload. In superior court, there are proportionately more crimes against the person (45%) and fewer crimes against property (10%) (Chart 3).
Chart 3 start
Data table for Chart 3
| Crimes against the person | Crimes against property | Other Criminal Code | Criminal Code traffic | Other federal statutes | ||||||
|---|---|---|---|---|---|---|---|---|---|---|
| number | percent | number | percent | number | percent | number | percent | number | percent | |
| Provincial court | 23,829 | 34 | 25,535 | 36 | 4,823 | 7 | 8,078 | 11 | 8,860 | 12 |
| Superior court | 1,385 | 45 | 320 | 10 | 285 | 9 | 69 | 2 | 1,037 | 33 |
|
Note: Caseload is the average number of cases open on any given day in the year. Includes only jurisdictions reporting both provincial and superior court data: Newfoundland and Labrador, Nova Scotia, New Brunswick, Alberta, British Columbia, Yukon, the Northwest Territories and Nunavut. Source: Statistics Canada, Canadian Centre for Justice and Community Safety Statistics, Integrated Criminal Court Survey Workload Time Series Database, 2017/2018. |
||||||||||
Chart 3 end
Overall, many case types have seen an increase in caseload over the decade 2008/2009 to 2017/2018. Cases involving crimes against property increased by 22% over this period. On the other hand, cases with Criminal Code traffic offences (such as impaired driving) decreased by 35%.
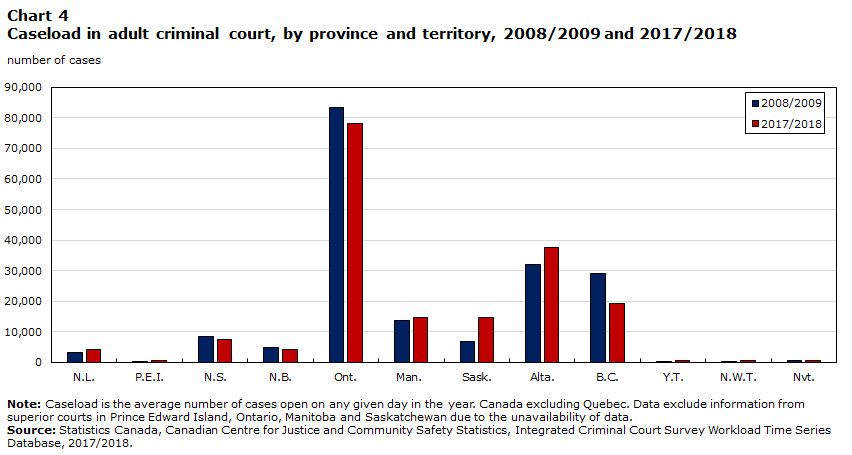
Caseload varies between jurisdictions and over time
Caseload varies within a jurisdiction over time as well as between jurisdictions. As expected, provinces and territories with larger populations also tend to have larger caseloads. Ontario, with the largest population, had the highest caseload for every year of the period 2008/2009 to 2017/2018. Nunavut, with the smallest population, nonetheless had a higher caseload than the other two territories and Prince Edward Island in most years (Chart 4).
Eight provinces and territories (Newfoundland and Labrador, Prince Edward Island, Manitoba, Saskatchewan, Alberta, Yukon, the Northwest Territories and Nunavut) had higher caseloads in 2017/2018 than they did in 2008/2009, with Saskatchewan showing the largest percent increase over this time (+112%). In contrast, four provinces and territories (Nova Scotia, New Brunswick, Ontario, and British Columbia) had lower caseloads in 2017/2018 than they did in 2008/2009. British Columbia had the largest decline, at -34% (Chart 4).
Chart 4 start
Data table for Chart 4
| N.L. | P.E.I. | N.S. | N.B. | Ont. | Man. | Sask. | Alta. | B.C. | Y.T. | N.W.T. | Nvt. | |
|---|---|---|---|---|---|---|---|---|---|---|---|---|
| number of cases | ||||||||||||
| 2008/2009 | 3,190 | 345 | 8,624 | 4,966 | 83,516 | 13,632 | 6,888 | 32,100 | 28,971 | 423 | 355 | 687 |
| 2017/2018 | 4,359 | 573 | 7,659 | 4,122 | 78,217 | 14,631 | 14,578 | 37,708 | 19,157 | 619 | 595 | 692 |
|
Note: Caseload is the average number of cases open on any given day in the year. Canada excluding Quebec. Data exclude information from superior courts in Prince Edward Island, Ontario, Manitoba and Saskatchewan due to the unavailability of data. Source: Statistics Canada, Canadian Centre for Justice and Community Safety Statistics, Integrated Criminal Court Survey Workload Time Series Database, 2017/2018. |
||||||||||||
Chart 4 end
Age of cases
Looking at the age of open casesNote within the court’s caseload can begin to inform issues of timeliness and delay within the criminal justice system.
The age of cases varies across jurisdictions
On any given day in 2017/2018, the majority of criminal court cases (84%) in Canada were less than one year old, a trend observed consistently over the past decade (Table 1). Among the provinces and territories, the age of cases have remained relatively consistent over time.
More specifically, on any given day in 2017/2018, more than half of cases were less than six months old in all jurisdictions (Table 1). Over the past 10 years, Prince Edward Island has consistently had the youngest caseload in the country. In 2017/2018, almost 3 in 10 cases (29%) in Prince Edward Island were less than one month old, in comparison to 12% in Newfoundland and Labrador, Nova Scotia and Manitoba. Further, almost two thirds of cases (62%) in Prince Edward Island were less than three months old, in contrast to 37% at the national level in 2017/2018.
Average age of cases is lower in provincial court
When looking only at jurisdictions reporting both provincial and superior court data, in 2017/2018, the average age of open cases was lower in provincial court than superior court. This pattern has been observed since 2008/2009, the first year of available data. On any given day in 2017/2018, more than 8 in 10 cases in provincial court were less than one year old (Chart 5). By comparison, almost 6 in 10 cases in superior court were open for the same length of time.
Chart 5 start
Data table for Chart 5
| Provincial court | Superior court | |
|---|---|---|
| percent | ||
| 1 month or less | 15 | 7 |
| Greater than 1 month to 3 months | 23 | 12 |
| Greater than 3 months to 6 months | 24 | 16 |
| Greater than 6 months to 12 months | 23 | 23 |
| Greater than 12 months to 18 months | 8 | 15 |
| Greater than 18 months to 30 months | 5 | 18 |
| Over 30 months | 3 | 9 |
|
Note: The age of open cases is the length of time (in days) that court cases have been open, on an average day in the year. The age of open cases is expressed as the proportion of cases that had been open for a given amount of time (e.g. less than 6 months). Includes only jurisdictions reporting both provincial and superior court data: Newfoundland and Labrador, Nova Scotia, New Brunswick, Alberta, British Columbia, Yukon, the Northwest Territories and Nunavut. The Workload Time Series Database is currently unable to track some cases that are transferred from provincial to superior court, resulting in a potential undercount of the time those cases remain open in court. Source: Statistics Canada, Canadian Centre for Justice and Community Safety Statistics, Integrated Criminal Court Survey Workload Time Series Database, 2017/2018. |
||
Chart 5 end
At-risk cases
In July 2016, the R. v. Jordan decision introduced a presumptive ceiling for completing criminal court cases in Canada of 18 months for cases tried in provincial court; and 30 months for cases tried in superior court or in provincial court following a preliminary inquiry. It is important to note that the ICCS is unable to determine if the time exceeding the presumptive ceiling is attributable to the Crown, the defence, or institutional delays. As such, cases exceeding those limits are referred to as potentially at-risk and represent the maximum proportion of cases which may be at risk of exceeding the presumptive limits.
Proportion of potentially at-risk cases lower in 2017/2018 than in 2014/2015
In Canada, there was a gradual increase in the proportion of cases potentially at risk of exceeding the eventual limits set out by R. v. Jordan beginning in 2011/2012 and reaching a peak of 9.5% in 2014/2015, two years prior to the release of the Jordan decision (Chart 6). In 2017/2018, the proportion of cases potentially at risk of exceeding the Jordan limits was at the lowest (6.4%) it had been since increases began in 2011/2012.
Chart 6 start

Data table for Chart 6
| percentage of at-risk cases | |
|---|---|
| 2008/2009 | 6.2 |
| 2009/2010 | 6.3 |
| 2010/2011 | 6.3 |
| 2011/2012 | 6.8 |
| 2012/2013 | 6.9 |
| 2013/2014 | 7.9 |
| 2014/2015 | 9.5 |
| 2015/2016 | 9.4 |
| 2016/2017 | 8.2 |
| 2017/2018 | 6.4 |
|
Note: At-risk cases refer to the proportion of open cases that are potentially at risk of surpassing the presumptive limits set out in the Supreme Court of Canada’s R. v. Jordan decision in July 2016 that set time limits for the completion of criminal cases, specifically: 18 months for cases tried in provincial court; and 30 months for cases tried in superior court or in provincial court following a preliminary inquiry. Canada excluding Quebec. Data exclude information from superior courts in Prince Edward Island, Ontario, Manitoba and Saskatchewan due to the unavailability of data. Source: Statistics Canada, Canadian Centre for Justice and Community Safety Statistics, Integrated Criminal Court Survey Workload Time Series Database, 2017/2018. |
|
Chart 6 end
There was a marked decrease in the proportion of at-risk cases among the provinces and territories since 2015/2016 (Table 2). In 2017/2018, the Northwest Territories had the lowest proportion of cases potentially at risk of surpassing Jordan (1.7%), followed by Prince Edward Island (1.8%). Notably, Prince Edward Island has consistently reported a low proportion of potentially at-risk cases. By contrast, Alberta (8.4%) had the most cases potentially at-risk in 2017/2018, followed by Nova Scotia (8.3%).
Impaired driving or fraud cases most likely to surpass Jordan limits; uttering threats least likely
The Workload Time Series Database is currently unable to track some cases that are transferred from provincial to superior court in certain jurisdictions, resulting in a potential undercount of the time those cases remain open in court. As such, this analysis excludes offence types that are more likely to be transferred to superior court and will examine the at-risk offences that often remain in provincial court. Caution should be used when making comparisons between different types of offences.
The types of cases that are at risk of exceeding the limits set out in the Jordan decision can be influenced by a variety of factors which can impact the length of time required to complete a case in court, including the seriousness or complexity of the offence. The cases most likely to be at risk of surpassing the presumptive ceiling established by the Jordan decision have remained relatively consistent over time. In 2017/2018, cases with an offenceNote of impaired driving (9.1%) or fraud (9.1%) had the highest proportion of cases surpassing the limits set out by the Jordan decision, followed by those with other drug offences (8.7%) (Table 3). Applying the Jordan limits historically, impaired driving and fraud cases would have also had the highest proportion of cases exceeding the presumptive ceiling in 2008/2009.
Similarly, the types of cases that were least likely to surpass the presumptive ceiling have also remained consistent over the past decade. In 2017/2018, overall, crimes against the person cases tended to be less likely to surpass the limits defined by the Jordan decision. Specifically, the cases that were least like to surpass Jordan included cases involving uttering threats (4.0%) or common assault (4.2%), as well as other crimes against personsNote (4.7%). Cases involving non-violent offences such as weapons (4.4%) were also less likely to surpass Jordan.
Completion rates
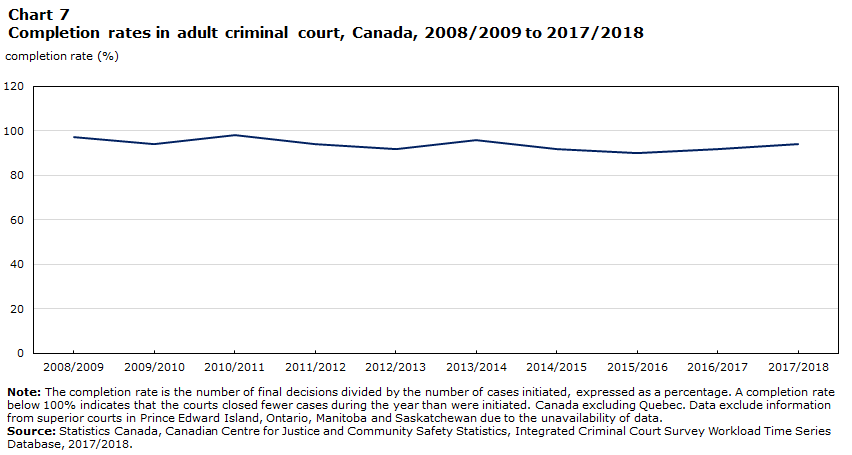
The completion rateNote is a measure that can indicate how efficiently courts are disposing the cases that are added to their caseload in a given time period. A completion rate below 100% indicates that the courts closed fewer cases during the year than were initiated, resulting in an increase in the case backlog.
Following a gradual decline, completion rates have been increasing
In the earlier part of the decade, completion rates for Canadian adult criminal courts were often above 94%. In 2014/2015, completion rates started to decline and by 2015/2016 they reached their lowest point at 90%. This means that about 10% of the court caseload was carried forward into the next year, placing added workload pressures on the courts.
In 2017/2018, the completion rate in adult criminal court was 94% overall, the second consecutive annual increase observed, and a return to the higher rates observed prior to the release of the Jordan decision in July 2016 (Chart 7).
Chart 7 start
Data table for Chart 7
| Completion rate (%) | |
|---|---|
| 2008/2009 | 97 |
| 2009/2010 | 94 |
| 2010/2011 | 98 |
| 2011/2012 | 94 |
| 2012/2013 | 92 |
| 2013/2014 | 96 |
| 2014/2015 | 92 |
| 2015/2016 | 90 |
| 2016/2017 | 92 |
| 2017/2018 | 94 |
|
Note: The completion rate is the number of final decisions divided by the number of cases initiated, expressed as a percentage. A completion rate below 100% indicates that the courts closed fewer cases during the year than were initiated. Canada excluding Quebec. Data exclude information from superior courts in Prince Edward Island, Ontario, Manitoba and Saskatchewan due to the unavailability of data. Source: Statistics Canada, Canadian Centre for Justice and Community Safety Statistics, Integrated Criminal Court Survey Workload Time Series Database, 2017/2018. |
|
Chart 7 end
Completion rates vary among the provinces and territories and by type of offence in the case
The completion rate for adult criminal court cases varies by province and territory. The completion rates in Newfoundland and Labrador (101%), Nova Scotia (99%) and Manitoba (99%) were among the highest in the country in 2017/2018, while the lowest completion rate was observed in the Northwest Territories (68%).
Variation in completion rates was also evident when examining them by type of offence in the case over time. Completion rates increased for many types of cases between 2008/2009 and 2017/2018. For example, completion rates for homicide and attempted murder cases both increased by seven percentage points (from 66% to 73% and 78% to 85%, respectively) and impaired driving cases increased by four percentage points, from 96% to 100%. In contrast, completion rates declined for cases involving sexual assault (down 15 percentage points) and break and enter (down nine percentage points) over the same time period. Interestingly, completion rates for virtually all case types have increased between 2015/2016 and 2017/2018 (Table 4).
Case processing times
Adult criminal court processing time is the amount of elapsed time (in days) it takes from an individual’s first court appearance to the final decision in their case; or the sentencing date for cases that result in a finding of guilt.
Case times continue to increase
The median amount of time taken to close a caseNote in adult criminal court in 2017/2018 was 121 days (around 4 months), a figure up slightly from the previous year. Case processing times in adult criminal court in Canada have been increasing from 2009/2010 to 2017/2018 and the current figure of 121 median days represents the longest number of days required to complete cases observed over the last decade (Chart 8).
Chart 8 start

Data table for Chart 8
| median length of cases (days) | |
|---|---|
| 2008/2009 | 102 |
| 2009/2010 | 97 |
| 2010/2011 | 99 |
| 2011/2012 | 99 |
| 2012/2013 | 99 |
| 2013/2014 | 106 |
| 2014/2015 | 107 |
| 2015/2016 | 111 |
| 2016/2017 | 120 |
| 2017/2018 | 121 |
|
Note: A closed case is a case in which all charges against an individual laid out on a single Information filed in the court have received a final decision. Case lengths are calculated based on the number of days it takes to complete a case, from first appearance to final decision or sentencing for cases with a guilty finding. The median is the point at which half of all cases had longer case lengths and half had shorter case lengths. Canada excluding Quebec. Data exclude information from superior courts in Prince Edward Island, Ontario, Manitoba and Saskatchewan due to the unavailability of data. Source: Statistics Canada, Canadian Centre for Justice and Community Safety Statistics, Integrated Criminal Court Survey Workload Time Series Database, 2017/2018. |
|
Chart 8 end
The observed increase in completion rates, combined with the longer case processing times in recent years may suggest that adult criminal courts have made a concerted effort to advance and close cases which have already been open for a long time, largely in response to Jordan.
Among the provinces and territories, the median length of time required to close a case in 2017/2018 ranged from a high of 175 days in Newfoundland and Labrador to a low of 43 days in the Northwest Territories. With the exception of Manitoba, Saskatchewan, and the Northwest Territories, the trend of a general increase in case processing times has been observed throughout the provinces and territories. Since 2008/2009, case processing times have been getting longer in Newfoundland and Labrador (+79 days), New Brunswick (+52 days) and Nova Scotia (+48 days) and shorter in both Saskatchewan (-22 days) and Manitoba (-1 day).
In 2017/2018, adult criminal court cases involving more serious types of offences required more time to reach completion. The longest median case times (over 200 days, or around 6.5 months) were observed in cases with: other drug offencesNote (218 days), sexual assault (247 days), other sexual offencesNote (258 days), attempted murder (259 days) and homicide (286 days) (Table 5). In comparison, cases involving theft (80 days) and disturbing the peace (63 days) offences were among those with the lowest median case times in 2017/2018.Note Similar results were observed in 2008/2009.
Workload
Court workload can be thought of as the amount of activity performed, or actions taken, to process criminal court cases within a specific period of time. Using data from the Integrated Criminal Court Survey Workload Time Series (ICCS WTS) Database, the amount of overall work undertaken by the courts throughout the year can be measured by examining how much work the courts are doing to reach the same number of decisions using the number of court appearances per final decision and the active days per final decision indicators.
More court appearances now required to close cases compared to a decade ago
The number of court appearances that occur compared with the final decisions made by the court is one measure that allows courts to quantify how much work is undertaken to process and close open cases in adult criminal court. In 2017/2018, the number of court appearances for every final decision was 8.5, up from 8.4 in 2016/2017. This number has increased over the past decade for all provinces and territories with the exception of Manitoba, and for cases from all crime categories.
For example, in 2017/2018 crimes against the person cases required 9.0 appearances per final decision, compared to 7.6 in 2008/2009 (Chart 9). The lowest number of court appearances for every final decision was observed for Criminal Code traffic offence cases in 2017/2018. However, similar to the overall trend, closed cases involving Criminal Code traffic offences also showed increases when compared to figures from 2008/2009 (6.4 versus 6.0, respectively).
Chart 9 start

Data table for Chart 9
| 2008/2009 | 2017/2018 | |
|---|---|---|
| number of appearances | ||
| Crimes against the person | 7.6 | 9.0 |
| Crimes against property | 6.6 | 8.3 |
| Other Criminal Code | 7.7 | 9.4 |
| Criminal Code traffic | 6.0 | 6.4 |
| Other federal statute | 7.8 | 9.3 |
| Total (minus AOJO-only) | 7.1 | 8.5 |
|
Note: Canada excluding Quebec. Data exclude information from superior courts in Prince Edward Island, Ontario, Manitoba and Saskatchewan due to the unavailability of data. Source: Statistics Canada, Canadian Centre for Justice and Community Safety Statistics, Integrated Criminal Court Survey Workload Time Series Database, 2017/2018. |
||
Chart 9 end
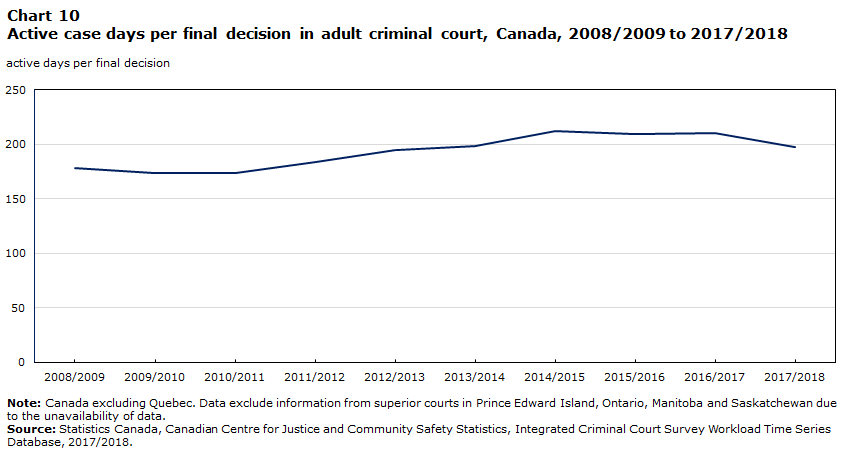
Courts are working faster in recent years
Another measure that allows courts to quantify how much overall work is undertaken by the courts throughout the year is the number of active days per final decision. This indicator measures how quickly the courts are closing their open cases and a lower number of active days used compared to final decisions signifies that the courts are closing cases faster (i.e., used fewer active days to close cases). It differs from case processing time in that it takes into account the number of days spent working on all cases, not just those reaching a final decision, and in that way can begin to assess if the courts have sped up or slowed down the pace at which they are closing cases. The two indicators are, however, related in that a decrease in the number of active days per final decision occurring in conjunction with a steady or declining caseload could reasonably be expected to result in a decrease in case processing time.
After peaking at 212 days in 2014/2015, the number of active case days per final decision in adult criminal court has started to decline, dropping to 197 days in 2017/2018 (Chart 10). Although the courts are closing cases quicker following the Jordan decision, they still require more open days to close cases when compared to 10 years ago.
Chart 10 start
Data table for Chart 10
| Active days per final decision | |
|---|---|
| 2008/2009 | 178 |
| 2009/2010 | 174 |
| 2010/2011 | 174 |
| 2011/2012 | 184 |
| 2012/2013 | 195 |
| 2013/2014 | 199 |
| 2014/2015 | 212 |
| 2015/2016 | 210 |
| 2016/2017 | 210 |
| 2017/2018 | 197 |
|
Note: Canada excluding Quebec. Data exclude information from superior courts in Prince Edward Island, Ontario, Manitoba and Saskatchewan due to the unavailability of data. Source: Statistics Canada, Canadian Centre for Justice and Community Safety Statistics, Integrated Criminal Court Survey Workload Time Series Database, 2017/2018. |
|
Chart 10 end
Court backlog
The Backlog IndexNote is a calculation used to measure a court’s ability to keep up with its incoming caseload. In other words, it measures its ability to close the same number of cases initiated during a given time period. A Backlog Index greater than 1.0 means that the courts were unable to close as many cases as were initiated, creating a backlog in cases. Alternatively, if the courts were able to successfully clear away some of their existing case backlog, the index value would be less than 1.0.
Court backlog improving in most jurisdictions and varies by type of offence in the case
In 2015/2016, just prior to the Jordan decision, the national adult criminal court Backlog Index peaked at 1.11 (Chart 11). Since that time court backlog has improved nationally and in most, but not all, jurisdictions. In 2017/2018, nationally, the court Backlog Index was 1.06, a decrease from 1.08 in 2016/2017. Among the provinces and territories that showed improvements since 2015/2016, the largest decline was observed for Alberta (1.19 to 1.04) followed by Newfoundland and Labrador (1.10 to 0.99). Beginning in 2011/2012, the highest court backlog has consistently been observed in the Northwest Territories, ranging from a low of 1.21 in 2011/2012 to a high of 1.48 in 2017/2018.
Chart 11 start
Data table for Chart 11
| 2015/2016 | 2017/2018 | |
|---|---|---|
| Backlog Index | ||
| N.L. | 1.10 | 0.99 |
| P.E.I. | 1.14 | 1.07 |
| N.S. | 0.96 | 1.01 |
| N.B. | 1.05 | 1.02 |
| Ont. | 1.08 | 1.08 |
| Man. | 1.08 | 1.01 |
| Sask. | 1.10 | 1.12 |
| Alta. | 1.19 | 1.04 |
| B.C. | 1.10 | 1.03 |
| Y.T. | 1.11 | 1.18 |
| N.W.T. | 1.42 | 1.48 |
| Nvt. | 1.10 | 1.04 |
| Canada (minus Que.) | 1.11 | 1.06 |
|
Note: The Backlog Index is the number of cases initiated divided by the number of final decisions. A Backlog Index less than 1.0 indicates that the courts were able to close more cases than were started in a given year. Canada excluding Quebec. Data exclude information from superior courts in Prince Edward Island, Ontario, Manitoba and Saskatchewan due to the unavailability of data. Source: Statistics Canada, Canadian Centre for Justice and Community Safety Statistics, Integrated Criminal Court Survey Workload Time Series Database, 2017/2018. |
||
Chart 11 end
Much like the other court processing indicators, court backlog varied among cases with different types of offencesNote over the past decade. Between 2008/2009 and 2017/2018, the court Backlog Index decreased the most for the following types of cases: homicide (-10%), attempted murder (-8%), residual Criminal Code (-5%), impaired driving (-4%), and other sexual offences (-1%). In contrast, over the same period, the Backlog Index increased the most for those cases involving sexual assault (+19%), break and enter (+10%), major assault (+8%), possession of stolen property (+7%) and weapons (+7%).
Start of text box 3
Text box 3
Administration of justice offences
Administration of justice offences (AOJO) are specific violations of the law that an accused can be charged with when they do not follow pre-trial conditions or sentences from a pre-existing offence, for example failure to appear in court, breach of a probation order and failure to comply with an order (Office of the Federal Ombudsman for Victims of Crime 2017). The amount of work required by the courts to resolve administration of justice offences has been identified as a factor contributing to court delays (Senate Canada 2017).
These types of offences often begin during the course of an existing case, and therefore, are generally processed by the courts in combination with pre-existing cases. Because of this, cases involving only offences against the administration of justice are excluded from the overall analysis presented in this Juristat to avoid overestimating the number of open cases and the amount of time to case completion.
An analysis of these excluded AOJO-only cases, however, can provide insight into the way they have changed over the past decade and their impact on overall court efficiency.
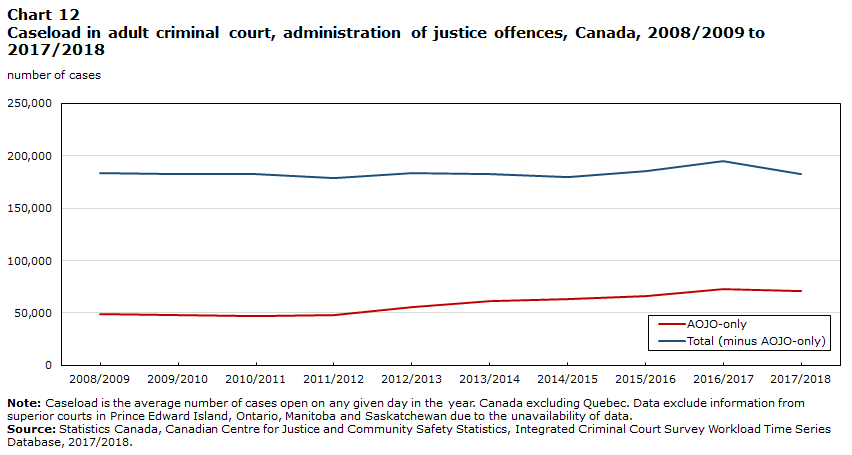
The caseload (i.e., the average number of cases open on any given day in the year) for cases comprised solely of offences against the administration of justice began to increase in 2011/2012, not recording any declines until 2017/2018 (-3%) (Chart 12). The administration of justice-only caseload was higher (+45%) in 2017/2018 when compared to 2008/2009.
In comparison, the total (minus AOJO-only) adult criminal court caseload had been relatively stable over the period from 2008/2009 to 2015/2016, the year prior to the release of the Jordan decision (Chart 12). Beginning in 2015/2016, there was a slight increase in these cases before declining in 2017/2018, to a figure less than 1% lower than a decade ago.
Chart 12 start
Data table for Chart 12
| AOJO-only | Total (minus AOJO-only) | |
|---|---|---|
| number of cases | ||
| 2008/2009 | 48,877 | 183,698 |
| 2009/2010 | 48,064 | 182,458 |
| 2010/2011 | 46,939 | 182,441 |
| 2011/2012 | 48,493 | 179,012 |
| 2012/2013 | 55,527 | 183,981 |
| 2013/2014 | 60,966 | 182,212 |
| 2014/2015 | 62,873 | 179,628 |
| 2015/2016 | 65,811 | 185,860 |
| 2016/2017 | 72,668 | 195,158 |
| 2017/2018 | 70,633 | 182,910 |
|
Note: Caseload is the average number of cases open on any given day in the year. Canada excluding Quebec. Data exclude information from superior courts in Prince Edward Island, Ontario, Manitoba and Saskatchewan due to the unavailability of data. Source: Statistics Canada, Canadian Centre for Justice and Community Safety Statistics, Integrated Criminal Court Survey Workload Time Series Database, 2017/2018. |
||
Chart 12 end
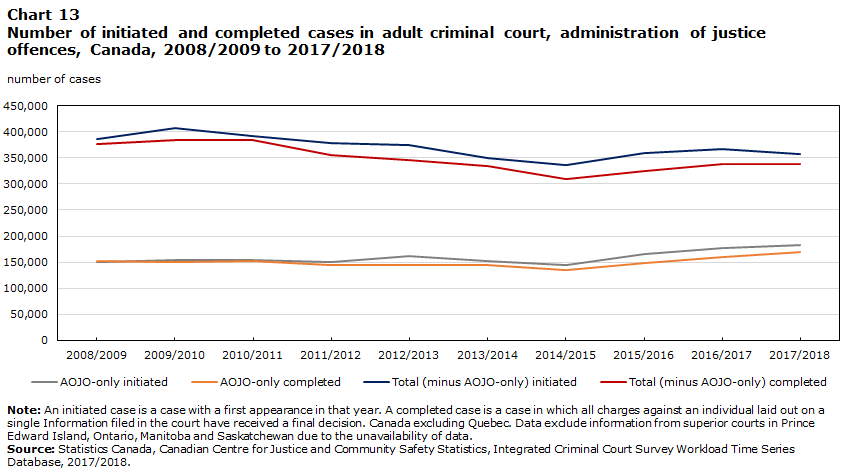
The trend of cases initiated and cases closed differs notably when comparing AOJO-only cases to the overall total (minus AOJO-only) trend. From 2008/2009 to 2014/2015, case initiations and completions generally declined overall (total minus AOJO-only) whereas AOJO-only initiations and completions remained relatively stable (Chart 13). Both types of cases recorded increases the following two years. In the most recent year of data (2017/2018) trends diverge again, with total (minus AOJO-only) cases recording a decline in case initiations and completions, whereas AOJO-only cases continued to increase. The result is that while the overall (total minus AOJO-only) case initiations and completions were lower in 2017/2018 than when the decade began (-7% and -10% respectively), AOJO-only initiated and completed cases were much higher in 2017/2018 than in 2008/2009 (+22% and +10%, respectively).
Chart 13 start
Data table for Chart 13
| AOJO-only initiated | AOJO-only completed | Total (minus AOJO-only) initiated | Total (minus AOJO-only) completed | |
|---|---|---|---|---|
| number of cases | ||||
| 2008/2009 | 149,730 | 152,891 | 385,838 | 376,038 |
| 2009/2010 | 154,640 | 150,012 | 407,667 | 383,506 |
| 2010/2011 | 153,590 | 152,383 | 391,028 | 383,590 |
| 2011/2012 | 151,029 | 144,414 | 378,150 | 355,624 |
| 2012/2013 | 162,267 | 144,680 | 375,445 | 344,913 |
| 2013/2014 | 152,952 | 145,139 | 350,259 | 334,955 |
| 2014/2015 | 143,942 | 135,005 | 335,358 | 308,672 |
| 2015/2016 | 165,302 | 148,063 | 358,495 | 324,123 |
| 2016/2017 | 177,790 | 160,084 | 366,756 | 339,030 |
| 2017/2018 | 182,411 | 168,464 | 358,047 | 338,073 |
|
Note: An initiated case is a case with a first appearance in that year. A completed case is a case in which all charges against an individual laid out on a single Information filed in the court have received a final decision. Canada excluding Quebec. Data exclude information from superior courts in Prince Edward Island, Ontario, Manitoba and Saskatchewan due to the unavailability of data. Source: Statistics Canada, Canadian Centre for Justice and Community Safety Statistics, Integrated Criminal Court Survey Workload Time Series Database, 2017/2018. |
||||
Chart 13 end
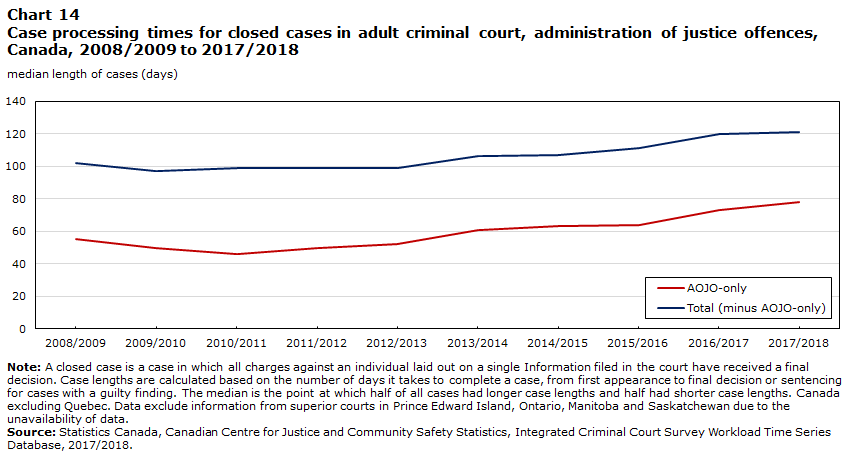
There is also a notable difference when comparing median case processing times for AOJO-only cases versus total minus AOJO-only cases. As stated earlier, administration of justice offences tend to occur during an existing court process, for example when an accused person fails to appear for a scheduled court date. New charges are often laid on a new Information, but processed in conjunction with the original ongoing case. Because of this, median case processing times for AOJO-only cases are much shorter than overall total (minus AOJO-only) cases (Chart 14).
The gap in case processing time between the two types of cases has narrowed over the past decade as the increase in median number of days to reach a final decision for AOJO-only cases has outpaced that for overall total minus AOJO-only cases (+42% and +19%, respectively).
Chart 14 start
Data table for Chart 14
| AOJO-only | Total (minus AOJO-only) | |
|---|---|---|
| median length of cases (days) | ||
| 2008/2009 | 55 | 102 |
| 2009/2010 | 50 | 97 |
| 2010/2011 | 46 | 99 |
| 2011/2012 | 50 | 99 |
| 2012/2013 | 52 | 99 |
| 2013/2014 | 61 | 106 |
| 2014/2015 | 63 | 107 |
| 2015/2016 | 64 | 111 |
| 2016/2017 | 73 | 120 |
| 2017/2018 | 78 | 121 |
|
Note: A closed case is a case in which all charges against an individual laid out on a single Information filed in the court have received a final decision. Case lengths are calculated based on the number of days it takes to complete a case, from first appearance to final decision or sentencing for cases with a guilty finding. The median is the point at which half of all cases had longer case lengths and half had shorter case lengths. Canada excluding Quebec. Data exclude information from superior courts in Prince Edward Island, Ontario, Manitoba and Saskatchewan due to the unavailability of data. Source: Statistics Canada, Canadian Centre for Justice and Community Safety Statistics, Integrated Criminal Court Survey Workload Time Series Database, 2017/2018. |
||
Chart 14 end
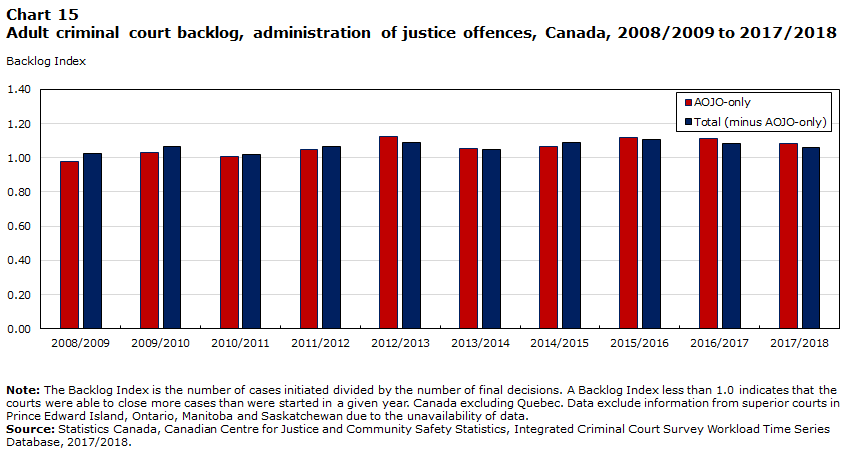
The fast pace of increases in caseload, case initiations, and case processing times for AOJO-only cases has resulted in a reduction in the courts’ ability to meet the demands of AOJO-only cases coming into the system. This is evidenced by an 11% higher Backlog Index value in 2017/2018 compared to a decade earlier (1.08 versus 0.98) (Chart 15). In comparison, the Backlog Index value for total (minus AOJO-only) cases increased only 3% over the period (1.03 in 2008/2009 compared to 1.06 in 2017/2018).
Chart 15 start
Data table for Chart 15
| AOJO-only | Total (minus AOJO-only) | |
|---|---|---|
| Backlog Index | ||
| 2008/2009 | 0.98 | 1.03 |
| 2009/2010 | 1.03 | 1.06 |
| 2010/2011 | 1.01 | 1.02 |
| 2011/2012 | 1.05 | 1.06 |
| 2012/2013 | 1.12 | 1.09 |
| 2013/2014 | 1.05 | 1.05 |
| 2014/2015 | 1.07 | 1.09 |
| 2015/2016 | 1.12 | 1.11 |
| 2016/2017 | 1.11 | 1.08 |
| 2017/2018 | 1.08 | 1.06 |
|
Note: The Backlog Index is the number of cases initiated divided by the number of final decisions. A Backlog Index less than 1.0 indicates that the courts were able to close more cases than were started in a given year. Canada excluding Quebec. Data exclude information from superior courts in Prince Edward Island, Ontario, Manitoba and Saskatchewan due to the unavailability of data. Source: Statistics Canada, Canadian Centre for Justice and Community Safety Statistics, Integrated Criminal Court Survey Workload Time Series Database, 2017/2018. |
||
Chart 15 end
End of text box 3
Summary
This Juristat introduced a series of new criminal court workload and case processing indicators based on open cases in order to address a series of questions related to the inventory of open cases, the age of open cases, cases at risk of potentially surpassing Jordan limits, completion rates, case processing times, workload, and finally, court backlog.
While the number of cases initiated each year has generally declined over the past decade, there continued to be more cases initiated than completed. Over the past two years, however, the gap between cases initiated and completed has demonstrated some narrowing. Nationally, there was an increase in criminal court caseload in the years prior to the release of the Jordan decision, peaking in 2016/2017. In 2017/2018, the caseload decreased slightly.
The majority of open criminal court cases (84%) in Canada were less than one year old, a trend observed consistently over the last ten years. Further, in all provinces and territories, more than half of open cases were less than six months old. On any given day in 2017/2018, among the provinces and territories reporting data for both levels of court, 84% of cases in provincial court were less than one year old, in comparison to 58% in superior court.
The R. v. Jordan decision established a presumptive ceiling for completing criminal court cases in Canada of 18 months for cases tried in provincial court; and 30 months for cases tried in superior court or in provincial court following a preliminary inquiry. The proportion of cases potentially at risk of exceeding these limits peaked at 9.5% in 2014/2015. By 2017/2018, the proportion of potentially at-risk cases was at its lowest point (6.4%) since 2010/2011. The types of cases that are potentially at risk of exceeding the Jordan limits have remained fairly consistent over time and include cases with an offence of impaired driving, fraud or other drug offences. By contrast, cases that are less likely to exceed the Jordan limit include uttering threats, common assault or other crimes against persons.
In Canada, in the earlier part of the decade, completion rates for adult criminal courts were often above 94% and in 2014/2015 they started to decline. However, since the release of the Jordan decision there has been an increase in completion rates. The completion rate varies by province and territory. Newfoundland and Labrador (101%), Nova Scotia (99%) and Manitoba (99%) were among the jurisdictions with the highest completion rates in the country in 2017/2018.
The median time to close a case in adult criminal court continued to increase in 2017/2018, reaching 121 median days, a figure that increased slightly from the previous year. Cases involving more serious types of offences, such other drug offences (218 days), sexual assault (247 days), other sexual offences (258 days), attempted murder (259 days) and homicide (286 days), were among the types of offences that had the longest median case times.
Regardless of geographical location or type of offence in the case, the number of court appearances that occurred for each final decision made by the court in 2017/2018 was higher than in previous years. The number has increased steadily over the past decade. While the number of active case days per final decision in adult criminal court is still higher than 10 years ago, it has started to decline following a peak at 212 days in 2014/2015, suggesting that the courts have been closing their open cases at a faster pace since Jordan.
The Backlog Index provides a measure of the courts’ ability to keep up with its workload. Nationally, court backlog peaked in 2015/2016 just prior to the release of the Jordan decision, and has fallen since that time in most jurisdictions.
This Juristat has presented analysis based on a series of new indicators looking at open cases before Canadian adult criminal courts in an effort to add to the national conversation about court efficiency in Canada.
Start of Appendix 1
Appendix 1
Criminal court workload and case processing in Quebec
Until recently, data from Quebec were reported using a previous version of the survey instrument, the Adult Criminal Court Survey (ACCS), rather than the Integrated Criminal Court Survey (ICCS), and were then converted to the ICCS National Data Requirements (NDR) during data processing. As a result, data for Quebec are not available on the ICCS Workload Time Series (WTS) Database until the 2015/2016 reference period and are therefore unavailable for inclusion in the overall analysis presented in this Juristat. However, the analysis of Quebec data can be carried out for the most recent three years (2015/2016 to 2017/2018) and the results are presented below.
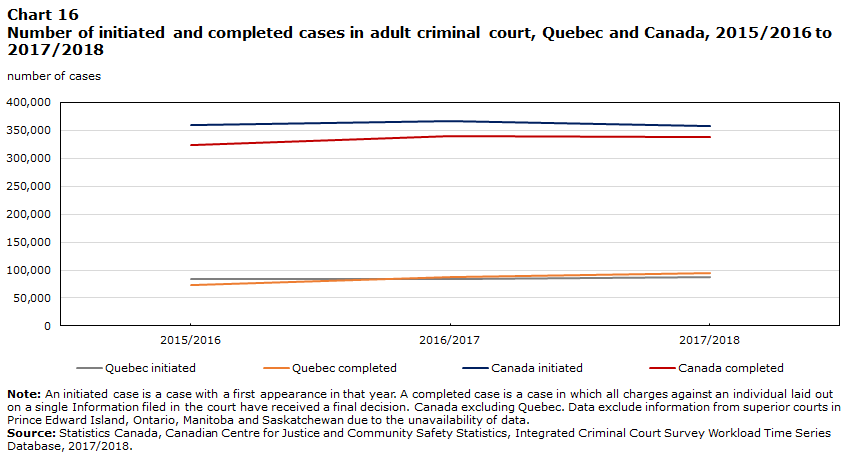
In Quebec, the number of cases initiated was relatively stable at approximately 85,000 in both 2015/2016 and 2016/2017 (Chart 16). During that same period, the number of completed cases in Quebec increased from 73,086 to 87,726. By 2017/2018, Quebec completed more cases than they initiated (95,196 versus 88,244). By comparison, both the number of cases initiated and completed in CanadaNote have generally declined.
Chart 16 start
Data table for Chart 16
| Quebec initiated | Quebec completed | Canada initiated | Canada completed | |
|---|---|---|---|---|
| number of cases | ||||
| 2015/2016 | 84,730 | 73,086 | 358,495 | 324,123 |
| 2016/2017 | 84,550 | 87,726 | 366,756 | 339,030 |
| 2017/2018 | 88,244 | 95,196 | 358,047 | 338,073 |
|
Note: An initiated case is a case with a first appearance in that year. A completed case is a case in which all charges against an individual laid out on a single Information filed in the court have received a final decision. Canada excluding Quebec. Data exclude information from superior courts in Prince Edward Island, Ontario, Manitoba and Saskatchewan due to the unavailability of data. Source: Statistics Canada, Canadian Centre for Justice and Community Safety Statistics, Integrated Criminal Court Survey Workload Time Series Database, 2017/2018. |
||||
Chart 16 end
Quebec’s caseload, or the average number of cases open on any given day, increased from 64,797 in 2015/2016 to 69,652 in 2016/2017. In 2017/2018, it reached its lowest point at 58,711, a marked decrease of -16% from the previous year.
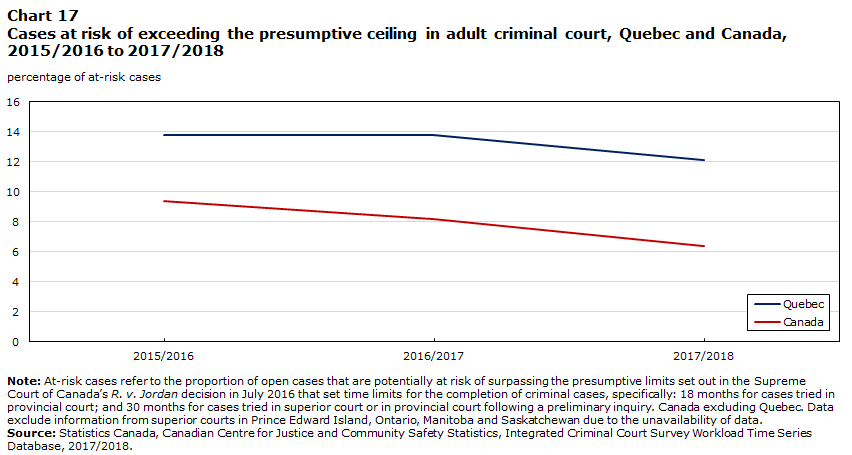
In Quebec, 72% of cases are less than one year old, in comparison to 84% nationally, demonstrating that Quebec has a higher proportion of older cases when compared to the national figure. The proportion of cases potentially at risk of exceeding Jordan in Quebec remained unchanged at 13.8% for 2015/2016 and 2016/2017 and declined slightly to 12.1% in 2017/2018, a figure double that of Canada’s 6.4% (Chart 17).
Chart 17 start
Data table for Chart 17
| Quebec | Canada | |
|---|---|---|
| percentage of at-risk cases | ||
| 2015/2016 | 13.8 | 9.4 |
| 2016/2017 | 13.8 | 8.2 |
| 2017/2018 | 12.1 | 6.4 |
|
Note: At-risk cases refer to the proportion of open cases that are potentially at risk of surpassing the presumptive limits set out in the Supreme Court of Canada’s R. v. Jordan decision in July 2016 that set time limits for the completion of criminal cases, specifically: 18 months for cases tried in provincial court; and 30 months for cases tried in superior court or in provincial court following a preliminary inquiry. Canada excluding Quebec. Data exclude information from superior courts in Prince Edward Island, Ontario, Manitoba and Saskatchewan due to the unavailability of data. Source: Statistics Canada, Canadian Centre for Justice and Community Safety Statistics, Integrated Criminal Court Survey Workload Time Series Database, 2017/2018. |
||
Chart 17 end
The median amount of time to close a case in Quebec increased from 185 days in 2015/2016 to 211 days in 2016/2017. In 2017/2018, case processing times declined to 190 days. Despite the decline, case processing times in Quebec are still above the national figures.
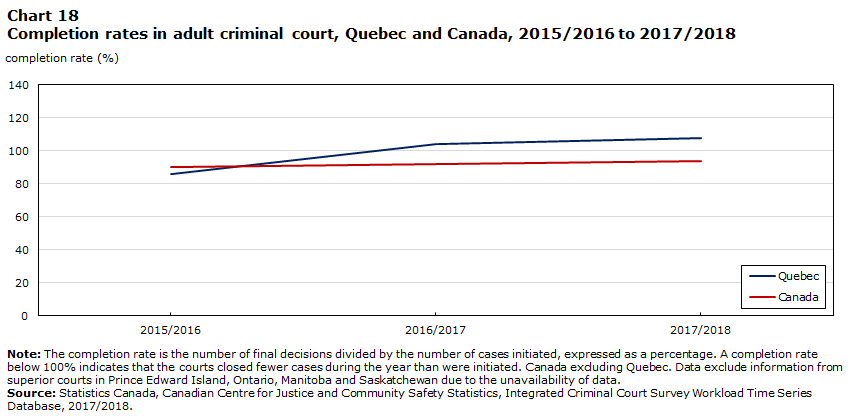
Quebec’s completion rate has increased from 2015/2016 to 2017/2018. In 2015/2016, Quebec’s completion rate was 86%, a figure lower than Canada’s 90% (Chart 18). The following year, Quebec’s completion rate increased to 104%, surpassing Canada’s figure of 92%. In 2017/2018, Quebec’s completion rate reached 108%, 13 percentage points higher than Canada’s that year.
Chart 18 start
Data table for Chart 18
| Quebec | Canada | |
|---|---|---|
| completion rate (%) | ||
| 2015/2016 | 86 | 90 |
| 2016/2017 | 104 | 92 |
| 2017/2018 | 108 | 94 |
|
Note: The completion rate is the number of final decisions divided by the number of cases initiated, expressed as a percentage. A completion rate below 100% indicates that the courts closed fewer cases during the year than were initiated. Canada excluding Quebec. Data exclude information from superior courts in Prince Edward Island, Ontario, Manitoba and Saskatchewan due to the unavailability of data. Source: Statistics Canada, Canadian Centre for Justice and Community Safety Statistics, Integrated Criminal Court Survey Workload Time Series Database, 2017/2018. |
||
Chart 18 end
The number of appearances that occurred for every final decision made by the court in Quebec has been declining since 2015/2016. Quebec reported 5.6 appearances per final decision in 2017/2018, down from 6.8 in 2015/2016 (Chart 19). In contrast, the number of appearances per final decision at the national level has increased over the same period (8.3 in 2015/2016 to 8.5 in 2017/2018).
Chart 19 start

Data table for Chart 19
| Quebec | Canada | |
|---|---|---|
| number of appearances | ||
| 2015/2016 | 6.8 | 8.3 |
| 2016/2017 | 6.1 | 8.4 |
| 2017/2018 | 5.6 | 8.5 |
|
Note: Canada excluding Quebec. Data exclude information from superior courts in Prince Edward Island, Ontario, Manitoba and Saskatchewan due to the unavailability of data. Source: Statistics Canada, Canadian Centre for Justice and Community Safety Statistics, Integrated Criminal Court Survey Workload Time Series Database, 2017/2018. |
||
Chart 19 end
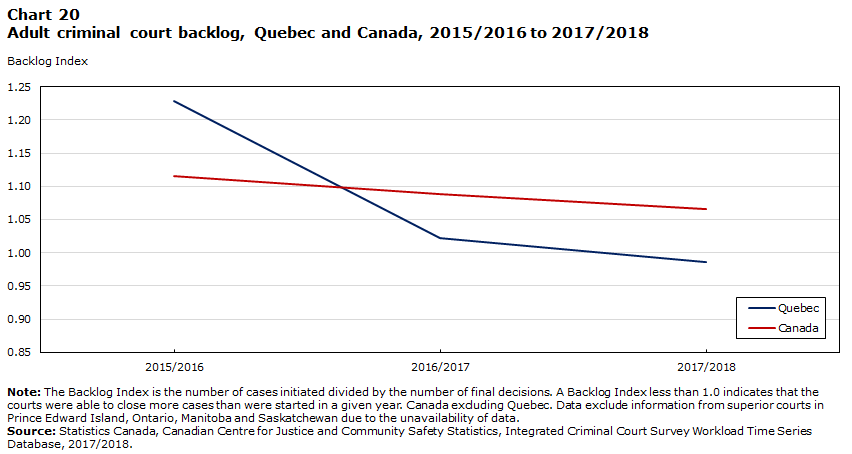
The backlog for Quebec courts has improved since 2015/2016. In 2015/2016, Quebec’s Backlog Index was 1.16, higher than Canada’s backlog measure at 1.11 (Chart 20). Following a decrease in 2016/2017, Quebec’s Backlog Index reached its lowest point at 0.93 in 2017/2018.
Chart 20 start
Data table for Chart 20
| Quebec | Canada | |
|---|---|---|
| Backlog Index | ||
| 2015/2016 | 1.16 | 1.11 |
| 2016/2017 | 0.96 | 1.08 |
| 2017/2018 | 0.93 | 1.06 |
|
Note: The Backlog Index is the number of cases initiated divided by the number of final decisions. A Backlog Index less than 1.0 indicates that the courts were able to close more cases than were started in a given year. Canada excluding Quebec. Data exclude information from superior courts in Prince Edward Island, Ontario, Manitoba and Saskatchewan due to the unavailability of data. Source: Statistics Canada, Canadian Centre for Justice and Community Safety Statistics, Integrated Criminal Court Survey Workload Time Series Database, 2017/2018. |
||
Chart 20 end
End of Appendix 1
Detailed data tables
Table 1 Age of cases in adult criminal court, by province and territory, 2017/2018
Table 4 Completion rates in adult criminal court cases, by type of offence, Canada, select years
Survey description
The Integrated Criminal Court Survey Workload Time Series (ICCS WTS) Database was created using data collected through the Integrated Criminal Court Survey (ICCS). The ICCS collects statistical information on adult criminal and youth court cases involving Criminal Code and other federal statute offences. Traditionally, data collected through the ICCS are organized into completed cases and provide information on work completed by the courts as well as court outcomes (decisions and sentencing).
In order to begin examining the full scope of work done by criminal courts in Canada, the ICCS WTS reorganizes the data from the adult component of the ICCS to allow for the analysis of open cases in addition to completed cases. It contains a series of new indicators, developed in consultation with key stakeholders and calculated within three different time intervals: month, quarter, and fiscal year. Data in the ICCS WTS allow for analysis by province/territory, court level, and offence starting in 2008/2009.
References
Department of Justice Canada. 2019a. “Transforming the criminal justice system.” (accessed October 21, 2019).
Department of Justice Canada. 2019b. “Legislative Background: An Act to amend the Criminal Code, the Youth Criminal Justice Act and to make consequential amendments to other Acts, as enacted (Bill C-75 in the 42nd Parliament).” (accessed December 19, 2019).
Department of Justice Canada. 2015. Canada’s Court System. Catalogue no. J2-128/2015E. (accessed November 6, 2019).
Miladinovic, Zoran. 2019a. “Adult criminal and youth court statistics in Canada, 2016/2017.” Juristat. Statistics Canada Catalogue no. 85-002-X.
Miladinovic, Zoran. 2019b. “Adult criminal and youth court statistics in Canada, 2017/2018.” Daily. Statistics Canada Catalogue no. 85-002-X.
Office of the Federal Ombudsman for Victims of Crime. 2017. “Administration of justice offences: Getting fair outcomes for victims in Canada’s criminal justice system.” (accessed October 24, 2019).
Perreault, Samuel. 2016. “Impaired driving in Canada, 2015.” Juristat. Statistics Canada Catalogue no. 85-002-X.
R. v. Jordan. 2016. SCC 27, [2016] 1 S.C.R. 631.
Senate Canada. 2017. “Delaying justice is denying justice: An urgent need to address lengthy court delays in Canada.” Final Report of the Standing Senate Committee on Legal and Constitutional Affairs. (accessed October 21, 2019).
- Date modified: