
Adult criminal courts in Canada: Workload and case processing indicators

Archived Content
Information identified as archived is provided for reference, research or recordkeeping purposes. It is not subject to the Government of Canada Web Standards and has not been altered or updated since it was archived. Please "contact us" to request a format other than those available.
Description: Adult criminal courts in Canada: Workload and case processing indicators
Adult criminal courts in Canada: Workload and case processing indicators
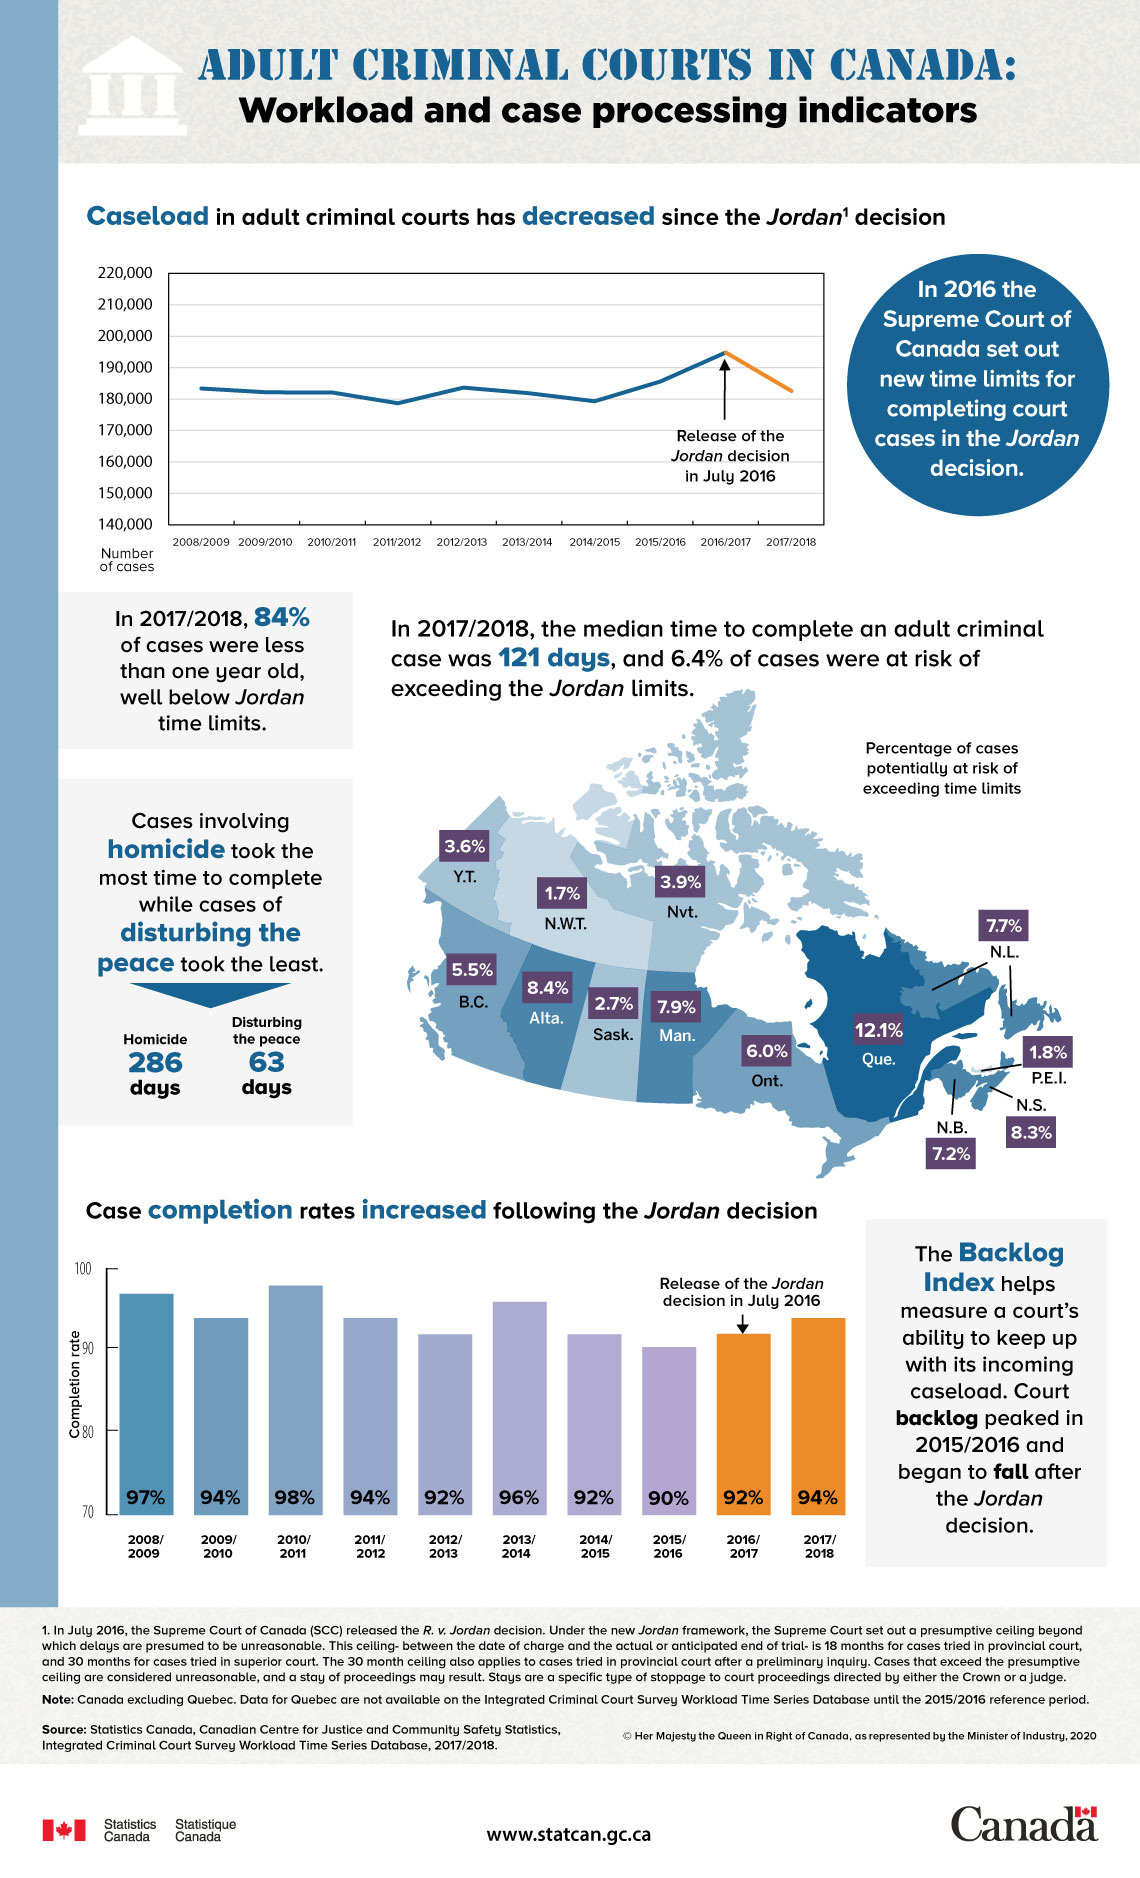
Caseload in adult criminal courts has decreased since the JordanNote 1 decision
| Fiscal year | Number of cases |
|---|---|
| 2008/2009 | 183,698 |
| 2009/2010 | 182,458 |
| 2010/2011 | 182,441 |
| 2011/2012 | 179,012 |
| 2012/2013 | 183,981 |
| 2013/2014 | 182,212 |
| 2014/2015 | 179,628 |
| 2015/2016 | 185,860 |
| 2016/2017 | 195,158 |
| 2017/2018 | 182,910 |
In 2016 the Supreme Court of Canada set out new time limits for completing court cases in the Jordan decision.
In 2017/2018, the median time to complete an adult criminal case was 121 days, and 6.4% of cases were at risk of exceeding the Jordan limits.
| Province/Territory | Percentage of cases potentially at risk of exceeding time limits |
|---|---|
| Newfoundland and Labrador | 7.7% |
| Prince Edward Island | 1.8% |
| Nova Scotia | 8.3% |
| New Brunswick | 7.2% |
| Quebec | 12.1% |
| Ontario | 6.0% |
| Manitoba | 7.9% |
| Saskatchewan | 2.7% |
| Alberta | 8.4% |
| British Columbia | 5.5% |
| Yukon | 3.6% |
| Northwest Territories | 1.7% |
| Nunavut | 3.9% |
In 2017/2018, 84% of cases were less than one year old, well below Jordan time limits.
Cases involving homicide took the most time to complete (286 days) while cases of disturbing the peace took the least (63 days).
Case completion rates increased following the Jordan decision
| Fiscal year | Completion rate |
|---|---|
| 2008/2009 | 97% |
| 2009/2010 | 94% |
| 2010/2011 | 98% |
| 2011/2012 | 94% |
| 2012/2013 | 92% |
| 2013/2014 | 96% |
| 2014/2015 | 92% |
| 2015/2016 | 90% |
| 2016/2017 | 92% |
| 2017/2018 | 94% |
The Backlog Index helps measure a court’s ability to keep up with its incoming caseload. Court backlog peaked in 2015/2016 and began to fall after the Jordan decision.
Note: Canada excluding Quebec. Data for Quebec are not available on the Integrated Criminal Court Survey Workload Time Series Database until the 2015/2016 reference period.
Source: Statistics Canada, Canadian Centre for Justice and Community Safety Statistics, Integrated Criminal Court Survey Workload Time Series Database, 2017/2018.
- Date modified: