
Police resources in Canada, 2013

Archived Content
Information identified as archived is provided for reference, research or recordkeeping purposes. It is not subject to the Government of Canada Web Standards and has not been altered or updated since it was archived. Please "contact us" to request a format other than those available.
By Hope Hutchins
[Highlights] [Full article in PDF]
- Introduction
- Continued decline in rate of police strength
- Trend in rate of police strength has not always followed the crime rate
- Manitoba had highest rate of police strength among provinces for second year
- Several provinces and territories with higher rates of police strength had higher Crime Severity Index and Violent Crime Severity Index values
- Thunder Bay and Winnipeg were CMAs with highest rates of police strength
- Long-term decrease in police officer to civilian ratio
- Clerical support largest group of civilians employed by police services
- Most police officer hires are recruit graduates
- Most departures were due to retirement
- Women in police services more likely to occupy civilian positions
- Growth in number of female officers continues
- Relative to similar countries, Canada has a notable proportion of female police officers
- More women in the higher ranks of policing
- Aboriginal persons and visible minorities
- Expenditures reached $13.5 billion in 2012
- Summary
- Survey descriptions
- Detailed data tables
- References
- Notes
Introduction
In a period of fiscal pressures coupled with growing policing responsibilities, discussions regarding the economics of policing are taking place. Contributing to these discussions are police services, the public sector, academics, the private sector, as well as the general public. The discussions seek to identify the nature of and reasons for police expenditures, as well as ways to reduce costs while continuing to meet police responsibilities regarding public safety (Public Safety Canada 2013).
Using data from the Police Administration Survey (see the “Survey descriptions” section for details), this Juristat article will focus on the most recent findings regarding the rate of police strength and police expenditures. The Police Administration Survey captures police-reported data on the number of police officers in Canada by rank and sex, as well as civilian employees, based on a snapshot date (which is May 15, 2013 for the most recent data). Data on hiring, departures, and eligibility to retire in this report are based on either the 2012 calendar year or the 2012/2013 fiscal year, depending on the police service.
Information from this survey is provided for Canada, the provinces and territories and census metropolitan areas (CMAs). In addition, this article provides information on workplace mobility within police services, including the hiring of and departures by police, and eligibility to retire. Finally, it summarizes data on the characteristics of police officers, including gender, age group, and Aboriginal and visible minority status1. To provide a more complete picture of the state of policing in Canada, the following contextual information are included: policing responsibilities and strategies within the economics of policing discussions; international data on police personnel and gender from the United Nations Office on Drugs and Crime (UNODC); and wage information from Statistics Canada’s Labour Force Survey (LFS).
Text Box 1
Policing responsibilities
In general, police officers are responsible for enforcing the law, preventing and reducing crime, assisting victims, maintaining order and responding to emergencies. In order to do so, police engage in a variety of tasks including responding to calls for service, initiating enforcement activities, and carrying out administrative duties. Calls for service do not necessarily pertain to violations of the Criminal Code. For example, citizens may contact police regarding by-law complaints, false alarms, reports of sick or injured persons or persons with mental health issues, intoxicated persons, traffic accidents, and reports of suspicious persons. In addition to these reactive activities, police officers initiate enforcement activities, such as drug investigations, neighbourhood patrols, stake-outs, stopping suspicious persons, and crowd or traffic control to ensure community safety. Finally, administrative duties include activities such as writing reports and attending and providing security in court (Burczycka 2013, Burczycka 2011).
The expectations and work environment of police are influenced by changes over time, such as an increased focus on terrorism, and technological developments. For example, since the attack on New York City on September 11, 2001, the role of policing at all levels has been expanded to include additional security responsibilities, such as working with public and private agencies with public safety functions to gather intelligence and predict security threats (Murphy 2007). Some municipalities have expressed concern that there is a lack of clarity about municipal police services’ role with respect to not only national security but other national or global issues such as organized crime, drugs, forensics, cybercrime, and border security. Municipal governments have indicated that this creates additional pressures upon their police services and resources as they also try to address local issues and make use of community resources to do so (Federation of Canadian Municipalities 2008).
Technological advances facilitate police work in a variety of areas, such as enforcement, investigations and records management, yet they also create a new kind of workload (Burczycka 2013). For instance, police can use social media as a source to gather information during an investigation. While these sources can provide strong evidence, it may also prove resource-intensive to, for instance, comb through hundreds or thousands of electronic files. Further, police can work with technology developers to facilitate interpretation of social media. An example of this is the police working with facial recognition software developers to identify rioters whose images were captured during the 2011 Vancouver hockey riot (Trottier 2012). On the other hand, technology can bring new challenges for police work by allowing for additional criminal opportunities, such as cybercrime.
End of text box.
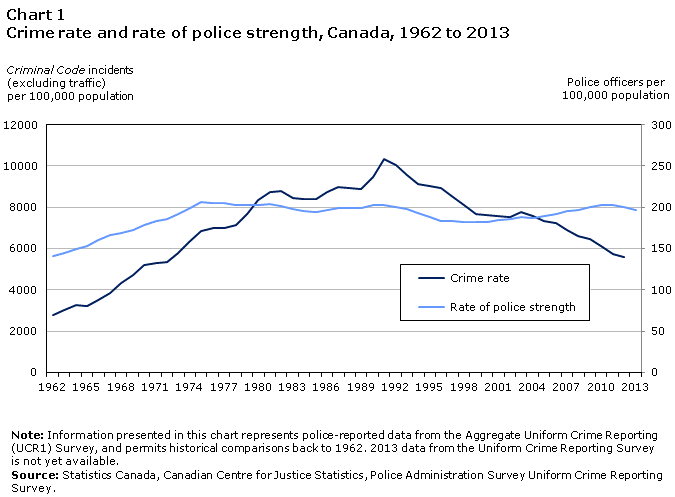
Continued decline in rate of police strength
There were 69,272 police officers in Canada on May 15, 2013, 233 fewer officers than in 2012. This represented a rate of police strength of 197 police officers per 100,000 population, a decrease of -1.5% from the previous year. This was the third annual consecutive decrease (Table 1).
Trend in rate of police strength has not always followed the crime rate
Long-term trends in the rate of police strength and the crime rate2 show that the two trends do not necessarily follow one another (Chart 1). Between the 1960s and the mid-1970s, both the rate of police strength and the crime rate increased. However, since the mid-1970s, the rate of police strength in Canada has remained relatively stable in comparison to the crime rate, which peaked in 1991 and then began falling. In 2012, the latest year for which data are available, the police-reported crime rate decreased by 3% from the previous year, marking the lowest rate since 1972 (Perreault 2013). Further research is required to determine if there is a relationship between the rate of police strength and the crime rate.
Text box 2
Canada had low rate of police strength in comparison to similar countries
According to the United Nations Office on Drugs and Crime (UNODC)1, Canada reported the fourth lowest rate of police strength in 20112, when compared with the 14 peer countries3 for which data were available. This placement has remained relatively consistent since 2003 (UNODC 2012b).
Of the peer countries, Italy has consistently had the highest rate of police strength per 100,000 population since 2003. In contrast, Finland and Norway have consistently had the lowest rates of police strength.
Compared to the United States, Canada’s rate of police strength has been consistently lower. In the nine years for which UNODC data are available, Canada’s average rate of police strength was 17% lower than that of the U.S.
Notes
- The UNODC collects data on the number of police at the national level from several member countries. These numbers include those in public agencies as of 31 December whose principal functions are the prevention, detection and investigation of crime and the apprehension of alleged offenders and should exclude support staff such as secretaries and clerks.
- The most recent data for these countries at the time this article was produced was available for 2003 to 2011.
- The Conference Board of Canada has established a group of 17 peer countries which are comparable in terms of income, population, and geographic land mass (Conference Board of Canada 2013).
| Peer countryNote 1 | Rate per 100,000 population | ||||||||
|---|---|---|---|---|---|---|---|---|---|
| 2003 | 2004 | 2005 | 2006 | 2007 | 2008 | 2009 | 2010 | 2011 | |
| Italy | 559.0 | 558.9 | 560.8 | 549.0 | 379.1 | 375.8 | 487.3 | 456.2 | 458.1 |
| Austria | Note ..: not available for a specific reference period | 331.2 | 329.3 | 321.8 | 320.4 | 319.2 | 318.1 | 328.1 | 328.2 |
| Ireland | 299.6 | 298.8 | 294.9 | 306.5 | 320.5 | 331.1 | 329.7 | 321.6 | 307.0 |
| Germany | 297.5 | 299.0 | 300.7 | 303.2 | 303.4 | 300.2 | 298.2 | 296.0 | 296.0 |
| France | Note ..: not available for a specific reference period | Note ..: not available for a specific reference period | Note ..: not available for a specific reference period | 319.3 | 316.9 | 312.6 | 306.2 | 299.1 | 292.4 |
| Australia | 222.7 | 223.2 | 221.5 | Note ..: not available for a specific reference period | 240.4 | 243.7 | 247.4 | 260.5 | 264.6 |
| Netherlands | 231.4 | 224.5 | 216.4 | 215.7 | 215.1 | 214.9 | 220.4 | 224.4 | 229.9 |
| United States | 227.9 | 229.8 | 226.8 | 228.1 | 231.5 | 232.3 | 229.7 | 227.1 | 223.1 |
| Sweden | 182.3 | 188.1 | 189.1 | 191.7 | 195.0 | 198.3 | 205.6 | 216.3 | 216.1 |
| Japan | Note ..: not available for a specific reference period | Note ..: not available for a specific reference period | 198.7 | 201.3 | 202.5 | 202.4 | 203.2 | 203.9 | 205.5 |
| Canada | 188.0 | 187.2 | 189.0 | 191.4 | 194.5 | 195.9 | 200.2 | 203.6 | 202.2 |
| Denmark | 192.3 | 194.1 | 195.9 | 201.4 | 198.0 | 195.4 | 196.3 | 199.7 | 195.0 |
| Norway | 176.9 | 178.1 | 161.9 | 160.8 | 158.1 | 157.0 | 158.2 | 157.4 | 158.0 |
| Finland | 159.1 | 157.8 | 157.1 | 157.8 | 154.2 | 154.1 | 155.5 | 152.1 | 151.9 |
| Belgium | 352.5 | 357.3 | 373.6 | 372.0 | 367.4 | 363.9 | 374.5 | 372.7 | Note ..: not available for a specific reference period |
| Switzerland | 207.4 | 210.2 | 221.8 | 222.9 | 215.4 | 215.6 | Note ..: not available for a specific reference period | Note ..: not available for a specific reference period | Note ..: not available for a specific reference period |
.. not available for a specific reference period
Source: United Nations Office on Drugs and Crime (UNODC), Criminal justice system resources, Total police personnel at the National Level. |
|||||||||
End of text box.
Text Box 3
Authorized strength greater than actual strength
While the concept of police strength refers to the actual number of officers on the survey snapshot date of May 15, 2013, the concept of authorized strength refers to the number of positions that police services are authorized to fill during the fiscal or calendar year as of May 15.1 More specifically, authorized police officer strength represents the number of police officer positions available throughout the year based on budget, whether or not these positions were filled on the snapshot date. By taking authorized strength into account, it is possible to have a fuller sense of police officer positions throughout the year.
In 2013, Canada’s authorized police strength was 71,621 positions, and the rate (204 per 100,000 population) decreased from the previous year (-1.5%). In 2013, authorized police strength was 3.4% greater than actual strength (69,272). Differences between these two figures can be explained by vacancies that are unfilled as of the snapshot date.
Note
- Positions counted under authorized strength are restricted to positions available to fully-sworn officers only. Positions occupied by cadets, recruits who have not yet graduated and trainees are counted as civilians in the Police Administration Survey.
End of text box.
Manitoba had highest rate of police strength among provinces for second year
The rate of police strength across the provinces in 2013 ranged from 160 police officers per 100,000 population in Prince Edward Island to 213 in Manitoba (Chart 2). This was the second year in a row that Manitoba had the highest rate of police strength among the provinces. Once again, Prince Edward Island had the lowest rate. Rates of police strength were much higher in the territories, with both the Yukon and Nunavut having a rate of 360 officers per 100,000 population and Northwest Territories having the highest rate of 441.
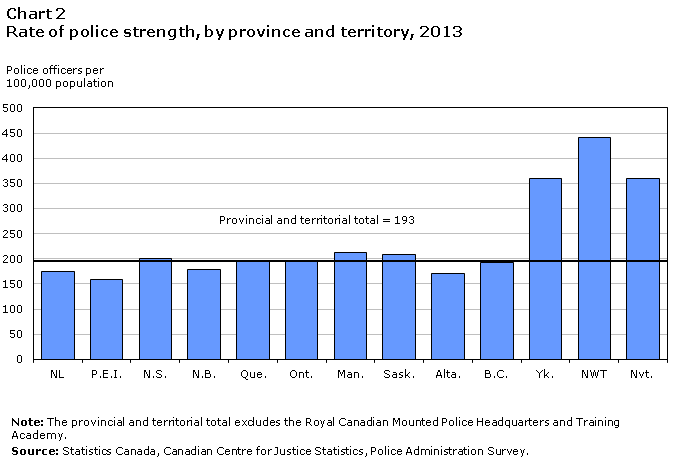
In comparison to the previous year, the rate of police strength declined in all provinces and territories, with the exception of Yukon and Nunavut3 (Table 2). More specifically, provinces had decreases ranging from less than -1% to less than -2%, with the exception of Prince Edward Island (-6.1%). The Northwest Territories reported a larger decrease (-3.3%) than most provinces.
Compared to 2003, rates of police strength were higher in most of the provinces and territories. These increases ranged from less than 1% in Prince Edward Island to 17.5% in Newfoundland and Labrador. In contrast, Nunavut (-12.9%) and the Yukon (-10.2%) had decreases.
Several provinces and territories with higher rates of police strength had higher Crime Severity Index and Violent Crime Severity Index values
Several of the provinces and territories with higher rates of police strength also had higher Crime Severity Index (CSI)4 and Violent CSI5 values (Table 3). More specifically, Manitoba, the province with the highest rate of police strength in 2013, had the second highest CSI and highest Violent CSI among the provinces. Saskatchewan, the province with the second highest rate of police strength in 2013, had the highest CSI and second highest Violent CSI among the provinces. In addition, the territories, which had the highest rates of police strength overall, also had the highest CSI and Violent CSI values.
Text box 4
Discussions regarding the economics of policing
Several strategies to address expanded policing responsibilities and fiscal restraint were discussed by police services and other stakeholders at the Summit on the Economics of Policing which took place in January 2013 (Public Safety Canada 2013). This Summit was organized around three pillars: efficiencies within police services, new models of community safety, and efficiencies within the justice system.
With respect to efficiencies within police services, some of the strategies discussed included: civilianization, privatization, and tiered policing. Civilianization refers to assigning civilians, that is employees who are not sworn police officers, to carry out support work traditionally carried out by a police officer. The duties assigned to civilians are those that do not require the specialized training and the authority of a police officer (Griffiths et al. 2006). In addition, the private security industry has the potential to increase policing capacity through tiered policing where private security personnel would work alongside sworn police officers to facilitate community safety on tasks not requiring specialized police training (Public Safety Canada 2013). However, there are some outstanding concerns such as the need for evidence to differentiate core police work from work that can be civilianized or outsourced (Public Safety Canada 2013) and the need to instate a mechanism to ensure the accountability of private police (Burbidge 2005).
The second pillar of the Summit on the Economics of Policing pertained to new models of community safety, which emphasized partnerships between the public sector, the private sector, and academia. One example of an integrated policing model is the partnership between the Halifax Regional Police and the Halifax District RCMP, which includes a joint management strategy and shared priorities in order to deliver programs. The partnership is also expanded to include community members, members of the private sector such as local businesses and members of the public sector such as universities, which help to promote public safety through advertising. Some involved in the economics of policing discussion pointed out the importance of pilot projects and studies and that implementing new models of policing will require monitoring and gathering of evidence to support the adoption of one model over another. Implementation would also need to consider the diverse needs of communities and the varying amounts of resources required to support individual community-based approaches (Public Safety Canada 2013).
Finally, the search for efficiencies is not limited to police services but also extends to the justice system as a whole. The system can require officers to engage in lengthy processes for search warrants, DNA testing, photo line-ups, court cases, and other policing duties. Some strategies include using technology such as online reporting and providing court testimony via video. Other strategies include the review of policies and procedures, such as reviewing and re-categorizing certain Criminal Code offences so they may be dealt with as regulatory violations (Public Safety Canada 2013).
End of text box.
Thunder Bay and Winnipeg were CMAs with highest rates of police strength
When comparing the rate of police strength and police-reported crime statistics from one CMA or police service to another, it should be noted that several factors may contribute to differences.6 These include differences in police services’ priorities, policies, procedures and enforcement practices, and availability of resources. For example, some police services may make greater use of municipal bylaws or provincial statutes for minor offences such as mischief and disturbing the peace. These infractions are not included in national police-reported crime statistics. Police-reported crime statistics can also be influenced by social and economic factors such as residents’ willingness to report incidents and their attitudes toward crime and risky behaviour, age demographics, economic conditions, neighbourhood characteristics, and the emergence of new technologies (Perreault 2013).
Looking at police strength at a more local level, rates in CMAs ranged from a low of 111 officers per 100,000 population in Moncton to a high of 189 in both Thunder Bay and Winnipeg (Chart 3, Table 4). Between 2012 and 2013, the rate of police strength decreased in approximately half of the CMAs, remained stable7 in approximately a third, and increased in the remainder. Decreases in rates were generally small and varied little, ranging from less than -1% in Kitchener-Cambridge-Waterloo, Sherbrooke, St. John's and Greater Sudbury, to approximately -3% in Winnipeg, Regina, Kingston, and Trois-Rivières. However, increases in rates varied more, ranging from less than 1% in Brantford to 11% in Kelowna.

Thunder Bay and Winnipeg, the census metropolitan areas with the highest rates of police strength, also had some of the highest CSI and Violent CSI values. The same was true for other CMAs, including Regina and Saskatoon. However, Kelowna, which had high CSI and Violent CSI values also had one of the lowest rates of police strength (125 officers per 100,000 population).
Long-term decrease in police officer to civilian ratio
Police services function with the assistance of civilian personnel. Civilians on police service payrolls are employed in such positions as clerks, dispatchers, managers, cadets, special constables8, security officers, school crossing guards, and by-law enforcement officers (see Text Box 4).
On May 15, 2013 there were 27,872 civilians employed by police services across Canada (Table 1)9, representing 29% of total personnel. Said differently, police services employed 2.5 police officers for every one civilian worker, a ratio that has remained steady since 2007. However, the police officer to civilian ratio has decreased since the 1960s, where ratios ranged between 4.6 and 4.1 officers for every civilian employee. In more recent years, the ratio was 2.9 in 1993 and 2.8 in 2003.
Clerical support largest group of civilians employed by police services
In 2013, most often civilian employees occupied clerical support (36%) or management/professional positions (33%), with the smallest group of civilians being Native Special Constables10 (less than 1%).
Most new police officer hires are recruit graduates
Information on hirings and departures of police officers, as well as on police officer characteristics, can assist in human resources planning for the policing community.
In 201211, over two-thirds (69%) of police officers hired in Canada were recruit graduates12, while the remainder were experienced officers13 (Table 5). For most provinces, the majority of those hired were recruit graduates, with the exception of New Brunswick and Quebec, where the opposite was true. In Manitoba, hires of recruit graduates and experienced officers were about evenly distributed.
Of those for whom information on years of service was available14, most police officers hired had relatively few years of service (Table 6). Of hired police officers, 86% had less than 5 years experience, 5% had 5 to less than 10 years, 4% had 10 to less than 15 years, and the remaining officers had 15 or more years of experience.
The most recent Police Administration Survey data show that the largest group among police officers eligible to retire were those who had 25 to less than 30 years of service (45%). The largest group among those who departed due to retirement were officers with 30 to less than 35 years of experience (46%) (Table 6).
Most departures were due to retirement
In 2012, there was a net loss of 72 police officers in Canada. While the provinces and territories gained 20 officers, 92 officers left the Royal Canadian Mounted Police Headquarters and Training Academy (Table 5).
That year, 69% of departures from police services were due to retirements and the remaining 31% left for other reasons, including being hired by another police service (Table 5). This was true for most provinces and territories, with the exception of the Northwest Territories, where reasons for departure were evenly distributed across the two categories.
In Canada, 11% of police officers, or 7,551, were eligible to retire in 2012 (Table 5). Of the provinces and territories, the highest proportion of officers who could have retired was found in Newfoundland and Labrador (23%). In contrast, the Royal Canadian Mounted Police Headquarters and Training Academy reported that 47% of their officers were eligible to retire.
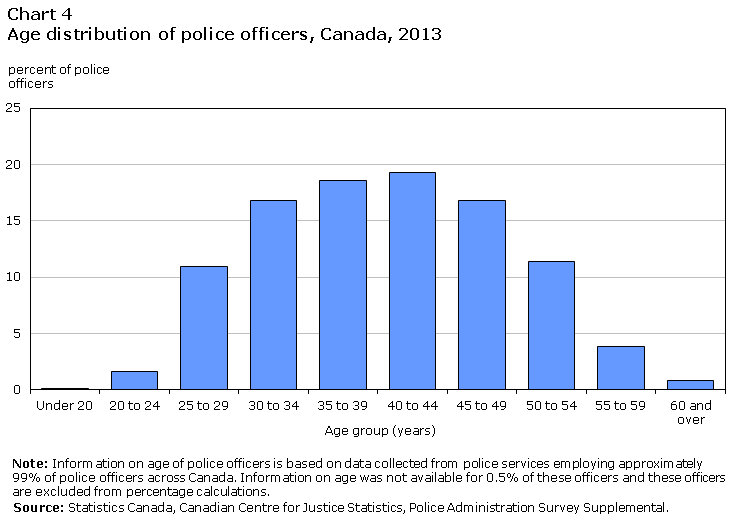
In 2013, the majority of police officers were aged 30 to 50 years (Chart 4).
Women in police services more likely to occupy civilian positions
While women comprised about one-third (34%) of total personnel employed by police services in 2013, they were found most often civilian positions (57%) and less often in police officer positions (43%).
Among civilian workers, almost nine in ten (87%) clerical support workers were women, as were over three-quarters of communications/dispatch employees (77%). Women represented almost six in ten of those employed as managers (57%) and as school crossing guards (57%). However, they were much less likely to be employed as by-law enforcement/parking control officers (30%) and cadets (21%).
Growth in number of female officers continues
With just over 14,000 female police officers in 2013, the number of female officers in Canada continued to increase (+172) while the number of male officers continued to decline (-405) in comparison to the previous year. The proportion of women serving as police officers in Canada has been rising in recent years. For example, in 1993, 8% of police officers were women, in comparison to 16% in 2003 and 20% in 2013 (Table 7). Across the provinces and territories, the proportion of female officers ranged from a low of 13% in the Yukon to a high of 24% in Quebec and 22% in British Columbia (Table 8).
Relative to similar countries, Canada has a notable proportion of female police officers
Of the 12 peer countries for which national data on the gender of police was available from the United Nations Office on Drugs and Crime (UNODC), Canada reported the fifth largest percentage of female police officers in 201115 (UNODC 2012a, Table 9). This is relatively consistent with the pattern for other years for which data were available. With the exception of 2009 and 2010, the United Kingdom has reported the largest proportion of officers who were female.
In those peer countries, except for Sweden and the United States, the proportion of police who are female has been rising for the years for which data were available.
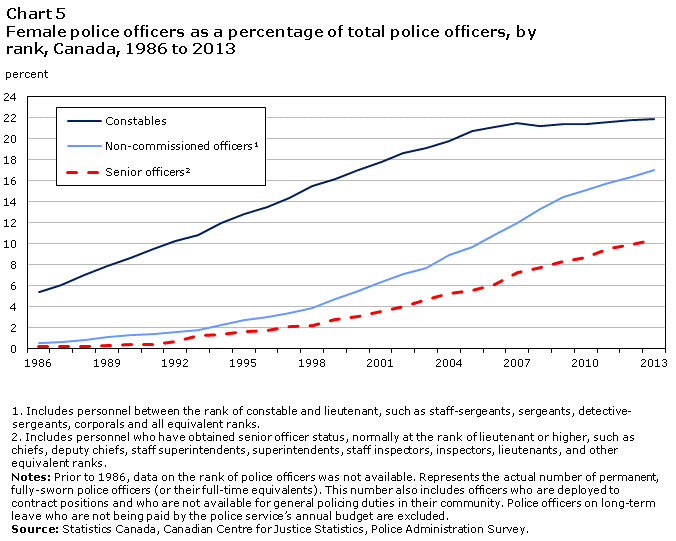
More women in the higher ranks of policing
Women are accounting for more and more positions among the higher ranks (Table 10). The proportion of women serving as senior officers and non-commissioned officers has increased since comparable data became available in the mid-1980s, reaching 10% and 17% respectively in 2013. Representation of women for each of these ranks has more than doubled since 2003. While the proportion of female officers as constables16 increased from the mid-1980s to 2005, it has remained relatively stable since. In 2013, 22% of constables were female, compared to 5% in 1986 (Chart 5, Table 10).
Aboriginal persons and visible minorities
Over the years, Canada has become more diverse as Aboriginal and visible minority populations have grown in this country. According to Statistics Canada’s National Household Survey (NHS), 1,400,685 people identified as an Aboriginal person in 2011, which represented 4.3% of the Canadian population17. This population has increased faster than the non-Aboriginal population between 2006 and 2011 (+20.1% versus +5.2%)18 (National Household Survey 2011a).
In addition, the 2011 NHS found that almost 6,264,800 people identified themselves a member of a visible minority group, which represented 19.1% of Canada’s population, as compared to 16.2% in 2006. This growth is largely due to the number of immigrants arriving from non-European countries including those from Asia (including the Middle East), the Caribbean and Central and South America, Africa, and Oceania and other regions. Almost eight in ten (78.0%) of immigrants who arrived between 2006 and 2011 identified themselves as visible minorities compared to three quarters of those who arrived in the 1990s (74.8%) (National Household Survey 2011b).
Individuals who identify themselves as an Aboriginal person19 or a member of a visible minority group20 comprise two of four groups designated under the Employment Equity Act, with the other two being women and persons with disabilities. In 2013, information was available on Aboriginal and visible minority identity for 48,710 officers (69% of all officers).21 Of these, 5% reported being an Aboriginal person and 9% reported being a member of a non-Aboriginal visible minority group, while the remainder identified as Caucasian in race or white in colour.
Expenditures reached $13.5 billion in 2012
Operating expenditures for all police services in Canada reached $13.5 billion in 2012, up 2.8% from the previous year when controlling for inflation22 (Table 11). With the exception of 2011, constant dollar spending on policing services has been increasing since the late 1990s.
After controlling for inflation, all provinces reported an annual increase in total spending in 2012, with the exception of Nova Scotia where expenditures remained stable23. Spending increased the most in Nunavut (+12.8%) and the Northwest Territories (+9.5%). The province with the largest increase in spending from the previous year was Manitoba (+8.2%) (Table 12).
Since 2002, police expenditures in constant dollars Canada have increased by 42%. While large increases were found in the territories (including Nunavut at +63%), some of the largest were found in the provinces, including Alberta (+73%) and British Columbia (+60%). In contrast, expenditures increased the least in Prince Edward Island (+21%) (Table 13).
Compared to expenditures presented on their own, the per capita cost, which takes the size of the population into account, demonstrates more moderate changes in Canada since the late 1990s. In the last three years, the per capita cost was stable24 in 2010, decreased in 2011, and then again increased moderately in 2012 (Table 11).
Text box 5
Salaries and wages of police officers and those in similar occupations
One of several questions raised within of the economics of policing discussion is the trend in police officer salaries (Public Safety Canada 2013). Although the Police Administration Survey collects information on total spending on salaries, it does not distinguish between the salaries of police officers and civilians within a police service. Therefore, in order to compare salaries of police officers with those in similar professions, data from the Labour Force Survey (LFS) are used.
In addition to collecting estimates of employment and unemployment, since 1997 the LFS has also collected information on the usual wages1 of employees at their main job by occupation2 (Statistics Canada 2013a). Occupations consist of groupings of jobs by types of tasks, duties and responsibilities involved, taking into account such factors as complexity, services provided and degree of responsibility (Statistics Canada 2013b).
Police officers are responsible for law enforcement, crime prevention and reduction, assistance to victims, maintenance of public order and emergency response (Burczycka 2013) (see Text box 1). As such, police work overlaps with other occupations that involve these responsibilities. Also, police officers work with those in other occupations to fulfill these responsibilities. For example, firefighters and ambulance attendants are also involved in emergency response. These occupations, as well as nurses, counsellors, social workers, teachers, and community and social service workers provide assistance to others and are responsible for the well-being of others. Those in many of these occupations must abide by provincial standards and regulations and must achieve similar educational and/or training requirements. While security guards differ in terms of training, accountability, and service to the public, they are also involved in maintaining order, providing assistance, and responding to emergencies. Trends in salaries for these occupations provide a point of comparison for police officer salaries.
When controlling for inflation3, LFS data show that police officers earned an average hourly wage4 of $27.12 in 2012, the fourth highest among the occupations analysed (Text box 5 Table). The highest earners in 2012 were secondary school teachers, at an average wage of $28.92 hourly, followed by registered nurses at $27.61, and elementary school and kindergarten teachers at $27.47. In contrast, the lowest average earnings per hour were for security guards and related occupations at $12.88, and community and social service workers at $17.57. These two occupations had wage rates lower than the average for all occupations at $19.16.
Such differences in wages were found throughout the period of 2002 to 2012. During this period, hourly earnings were consistently higher for secondary school teachers and usually higher for elementary school and kindergarten teachers as well as registered nurses. Security guards and community social service workers consistently had lower hourly earnings, which were lower than the average for all occupations.
Between 2002 and 2012, the average hourly wage rate increased 7% for police officers, as it did for community and social service workers (+7%) and similar to social workers (8%). The lowest increase in average hourly wage rate for this period was for security guards and related occupations (5%). In contrast, the highest increases from 2002 to 2012 were for ambulance attendants and other paramedical occupations (21%), family, marriage and other related counsellors (15%), and registered nurses (14%).
Notes
- Wage/salary information does not take into account taxes and other deductions, but does include tips and commissions. In addition, weekly and hourly wages/salary are calculated by taking into account the usual paid work hours per week (see Statistics Canada 2013a).
- Wage information from the Labour Force Survey (LFS) are the most recent data available at the time this article was produced. Those contained in this report are organized according to the National Occupational Classification for Statistics (NOC-S) 2006 (see Statistics Canada 2013b).
- Data from the Consumer Price Index (CPI) used to calculate constant dollars are the most recent data available at the time this article was produced.
- Wages were analyzed in terms of hours rather than weeks given variation in the average usual hours worked by those in different occupational groups. Of the occupations considered, from 2002 to 2012 police officers had one of the highest average numbers of usual hours, along with firefighters and ambulance attendants, working between four to five hours per week more than the average for all occupations. Of these three occupational groups, the number of hours varied the least for police officers. The least average usual hours per week were worked by nurses, community and social service workers, security guards, and sometimes counsellors during this period.
| Occupational GroupNote 3 | 2002 | 2003 | 2004 | 2005 | 2006 | 2007 | 2008 | 2009 | 2010 | 2011 | 2012 | Percent change 2002 to 2012 |
|---|---|---|---|---|---|---|---|---|---|---|---|---|
| dollars | ||||||||||||
| Secondary School Teachers | 26.54 | 26.40 | 26.69 | 26.73 | 26.82 | 26.86 | 26.99 | 28.01 | 28.70 | 28.78 | 28.92 | 9 |
| Registered Nurses | 24.30 | 24.87 | 25.18 | 25.16 | 25.31 | 25.87 | 26.38 | 27.45 | 27.94 | 27.70 | 27.61 | 14 |
| Elementary School and Kindergarten Teachers | 24.93 | 25.19 | 25.30 | 25.34 | 25.60 | 25.67 | 25.93 | 27.02 | 27.45 | 27.51 | 27.47 | 10 |
| Police Officers (Except Commissioned) | 25.43 | 24.83 | 24.35 | 24.60 | 25.30 | 25.58 | 25.78 | 26.42 | 26.68 | 26.96 | 27.12 | 7 |
| Firefighters | 23.77 | 23.82 | 23.51 | 23.99 | 24.88 | 24.86 | 25.13 | 26.04 | 25.99 | 26.14 | 26.52 | 12 |
| Social Workers | 23.30 | 23.50 | 24.06 | 23.90 | 23.46 | 23.61 | 24.13 | 24.86 | 24.91 | 25.26 | 25.20 | 8 |
| Ambulance Attendants and Other Paramedical Occupations | 19.36 | 19.97 | 20.36 | 20.64 | 21.23 | 21.43 | 21.19 | 21.91 | 22.07 | 22.74 | 23.49 | 21 |
| Family, Marriage and Other Related Counsellors | 19.32 | 19.29 | 20.10 | 20.21 | 20.18 | 20.91 | 21.58 | 21.92 | 21.18 | 21.18 | 22.22 | 15 |
| Community and Social Service Workers | 16.38 | 16.16 | 16.01 | 16.10 | 16.60 | 16.72 | 16.82 | 17.82 | 17.97 | 17.49 | 17.57 | 7 |
| Security Guards and Related Occupations | 12.26 | 12.24 | 11.97 | 11.93 | 12.03 | 11.98 | 12.12 | 12.72 | 12.88 | 12.72 | 12.88 | 5 |
Sources: Statistics Canada, Labour Force Survey and Consumer Price Index. |
||||||||||||
End of text box.
Summary
The rate of police strength in Canada continued to decline in 2013. Following growth in the 2000s, this was the third consecutive annual decrease.
In 2012, most hirings in police services were recruit graduates and the most common reason for departures was retirement. In 2012, 11% of police officers in Canada could have left due to retirement, but only 2% of police officers did.
The trend towards more women in policing continued in 2013. Once again, the number of female officers increased, while the number of male officers declined. Females now account for 20% of all police officers and 68% of civilian employees, and representation of women in the higher ranks of policing continued to increase.
Expenditures on policing totalled $13.5 billion in 2012. Controlling for inflation, this was an increase of 2.8% from the previous year. With the exception of 2011, constant dollar spending on policing has been increasing since the late 1990s.
Survey descriptions
The Police Administration Survey collects data on police personnel and expenditures from each municipal, provincial and federal (RCMP) police service in Canada. First Nations police personnel and expenditures falling under the jurisdiction of the RCMP are reported under RCMP federal policing.
The following federal policing and security agencies are excluded from the survey: the Canadian Security Intelligence Service, railway and military police. Federal and provincial government departments deploying personnel to enforce specific statutes in the areas of income tax, customs and excise, immigration, fisheries and wildlife are also excluded. As well, private security guards and private investigators are not included in this survey.
Data presented in this report represent police personnel as of May 15, 2013 and final expenditures for the year 2012 (or 2012/2013 for those services operating on a fiscal year). Most municipal police services operate on a calendar year while the provincial services and the RCMP operate on a fiscal year.
Personnel counts are based on permanent, full-time equivalents; part-time employees are converted to full-time equivalents (e.g., 4 employees working 10 hours per week would equal 1 full-time employee working a 40-hour week). Police officers include the actual number of sworn police officers available for active duty as of May 15, 2013. Other employees include all civilian personnel, including clerks, dispatchers, managers, cadets, special constables, security officers, school crossing guards, and by-law enforcement officers.
Counts for temporary officers are not included in any of the police officer counts, as only permanent, full-time officers (and full-time equivalents) are included. Temporary police officers are hired to fill in, as needed, for permanent police officers. The province of Quebec employs more temporary police officers than any other jurisdiction. Of the 923 temporary officers reported in 2013, 816 or 88% were employed in Quebec.
Police expenditures are actual operating expenditures and include: salaries and wages, benefits, and other operating expenses such as accommodation costs, fuel, maintenance, etc. Capital expenditures, funding from external sources, revenues and recoveries are not included.
In 2013, the Police Administration Survey Program included the Supplemental questionnaire for the second time, which captured detailed information on hirings, departures, eligibility to retire, years of service, age, education, visible minority status and language. The majority of the information collected through this questionnaire is based on the familiar May 15 survey snapshot day. Other data, including those on annual hirings, departures and eligibility to retire, is collected based on the previous calendar year or fiscal year.
Some police services are unable to provide one or more of the data elements asked for on the Supplemental Police Administration Survey questionnaire. In these cases, the police services are excluded from related percent calculations and a note explaining coverage for the data element is included in the text or table.
Data from the Uniform Crime Reporting (UCR) Survey are also included in this report to provide appropriate caseload context for the police in terms of the volume of criminal incidents coming to their attention. The UCR Survey collects police-reported crime and traffic offences reported by all police services in Canada, dating back to 1962, and is the basis for crime rate, Crime Severity Index and Violent Crime Severity Index information.
Detailed data tables
Table 1 Trends in police strength and expenditures, Canada, 1962 to 2013
Table 2 Police officers by level of policing, by province and territory, 2013
Table 3 Rates of police strength and selected crime statistics, by province and territory, 2012-2013
Table 4 Police officers and selected crime statistics, by census metropolitan area, 2013
Table 5 Hirings and departures of police officers, by province and territory, Canada, 2012/2013
Table 6 Hirings and departures of police officers, by overall years of service, Canada, 2012/2013
Table 7 Police officers by sex, Canada, 1986 to 2013
Table 8 Police officers by sex, by province and territory, 2013
Table 10 Male and female police officers by rank, Canada, 1986 to 2013
Table 11 Current and constant dollar expenditures on policing, Canada, 1986 to 2012
Table 12 Total expenditures on policing, current dollars, by province and territory, 2012
Table 13 Total expenditures on policing, constant dollars, by province or territory, 2002-2012
References
Burbidge, Scott. 2005. “The Governance Deficit: Reflections on the Future of Public and Private Policing in Canada.” Canadian Journal of Criminology and Criminal Justice: 63-86.
Burczycka, Marta. 2013. Police Resources in Canada, 2012. Statistics Canada Catalogue no. 85-225-X.
Burczycka, Marta. 2011. Police Resources in Canada, 2011. Statistics Canada Catalogue no. 85-225-X.
Conference Board of Canada. 2013. “Methodology.” http://conferenceboard.ca/hcp/methodology.aspx (accessed October 10, 2013).
Federation of Canadian Municipalities. 2008. Towards Equity and Efficiency in Policing: A Report on Policing Roles, Responsibilities and Resources in Canada. http://www.fcm.ca/Documents/reports/Towards_Equity_and_Efficiency_in_Policing_EN.pdf (accessed October 9, 2013).
Griffiths, Curt Taylor, Sgt Adam Palmer, Sgt Larry Weeks, and Brian Polydore. 2006. Civilianization in the Vancouver Police Department. http://vancouver.ca/police/assets/pdf/studies/vpd-study-civilianization.pdf (accessed October 9, 2013).
Labour Force Survey. 2013. “Wages of employees by occupation (current dollars), Canada, from 1997/1998 to 2011/2012, 2 years moving average.” (Custom request)
Murphy, Christopher. 2007. “‘Securitizing’ Canadian Policing: A New Policing Paradigm for the Post 9/11 Security State?” Canadian Journal of Sociology 32(4): 449-475.
National Household Survey, 2011a. 2013. Aboriginal Peoples in Canada: First Nations People, Métis and Inuit. Statistics Canada Catalogue no. 99-011-X2011001.
National Household Survey, 2011b. 2013. Immigration and Ethnocultural Diversity in Canada. Statistics Canada Catalogue no. 99-010-X2011001.
Perreault, Samuel. 2013. “Police-reported crime statistics in Canada, 2012.” Juristat. Statistics Canada Catalogue no. 85-002-X.
Public Safety Canada. 2013. 2013 Summit on the Economics of Policing: Summit Report. http://www.publicsafety.gc.ca/cnt/rsrcs/pblctns/smmt-cnmcs-plcng-2013/index-eng.aspx (accessed October 9, 2013).
Statistics Canada. 2013a. “Guide to the Labour Force Survey.” http://www.statcan.gc.ca/pub/71-543-g/71-543-g2013001-eng.htm (accessed January 7, 2014). Statistics Canada Catalogue no.71-542-G.
Statistics Canada. 2013b. “Introduction.” National Occupational Classification (NOC-S) 2006. http://www.statcan.gc.ca/subjects-sujets/standard-norme/soc-cnp/2006/noc2006-cnp2006-introduction-eng.htm (accessed January 7, 2014).
Trottier, Daniel. 2012. “Policing Social Media.” Canadian Review of Sociology 49(4): 411-425.
UNODC. 2012a. “Total, male and female police personnel as at 31 December.” Criminal justice system resources. http://www.unodc.org/unodc/en/data-and-analysis/statistics/crime.html (accessed October 9, 2013).
UNODC. 2012b. “Total Police Personnel at the National Level.” Criminal justice system resources. http://www.unodc.org/unodc/en/data-and-analysis/statistics/crime.html (accessed October 9, 2013).
Notes
- Although the Police Administration Survey has collected data on highest level of education completed at time of hiring and languages spoken, the data are not presented due to issues related to data quality.
- The crime rate represents data from the Aggregate Uniform Crime Reporting (UCR1) Survey, and permits historical comparisons back to 1962. The crime rate is the number of police-reported Criminal Code offences (excluding traffic) per 100,000 population.
- Percent change of -0.2% rounds to 0%, so Nunavut’s percent change is considered stable.
- The Crime Severity Index (CSI) takes into account both the volume and the seriousness of crime. In the calculation of the CSI, each offence is assigned a weight, derived from average sentences handed down by criminal courts. The more serious the average sentence, the higher the weight for that offence. As a result, more serious offences have a greater impact on changes in the index. All police-reported Criminal Code offences, including traffic offences and other federal statute offences, are included in the Crime Severity Index.
- The Violent Crime Severity Index (Violent CSI) takes into account both the volume and the seriousness of violent crime. In the calculation of the Violent CSI, each violent offence is assigned a weight, derived from average sentences handed down by criminal courts. The more serious the average sentence, the higher the weight for that offence. As a result, more serious offences have a greater impact on changes in the index. All police-reported violent Criminal Code offences are included in the Violent CSI.
- Police Administration Survey data on police personnel and expenditures are publicly available for each municipal police service in Canada. See CANSIM tables 254-0004 and 254-0006 at www.statcan.gc.ca or contact the Canadian Centre for Justice Statistics at ccjsccsj@statcan.gc.ca or by calling 1-800-387-2231.
- Percent change rounds to 0%.
- Special constables, such as Native Special Constables, are civilians employed by police services. They are not included within the definition of police officer.
- The Police Administration Survey only collects data on civilian employees paid for by the police service. Therefore, if civilian employees of a police service are paid for by the municipality, such as in the case of RCMP detachments, they are not captured by the survey.
- Native Special Constables are personnel that provide a restrictive policing role within Aboriginal communities and act as liaison between fully-sworn police officers and Aboriginal members of the community. They have limited law enforcement authority. Many of the Native Special Constables were part of the Native Special Constable Program that was sponsored by the RCMP.
- While most Police Administration Survey data on police strength pertains to the snapshot date of May 15, 2013, data on hiring, departures, and eligibility to retire refers to either the 2012 calendar year or the 2012/2013 fiscal year, depending on the police service.
- Includes paid police officers who achieved the status of fully-sworn police officer during the calendar or fiscal year prior to the year for which data are shown.
- Includes senior officers, non-commissioned officers and constables who achieved the status of fully-sworn officer prior to the calendar or fiscal year for which data are shown.
- Some police services are unable to report on the overall years of service of their police officers and have instead been reporting the years of service at their respective police service.
- The most recent year for which data for these countries is available.
- Includes all classes of constables, except Special Constables, who are civilians employed by police services and are not sworn police officers.
- Some Indian reserves and settlements did not participate in the 2011 National Household Survey (NHS) as enumeration was either not permitted, it was interrupted before completion, or because of natural events (e.g., forest fires). These are called "incompletely enumerated reserves" (See National Household Survey 2011a).
- According to the NHS, several factors should be taken into account when comparing data on Aboriginal persons over time, including measuring the growth rate. These include differences in questions pertaining to Aboriginal identity, differences in the methodology, legislative changes, changes to the definition of reserves, differences in the list of incompletely enumerated reserves, as well as individuals reporting their identity and/or ancestry differently from one data collection period to another (See National Household Survey 2011a).
- According to the NHS, “Aboriginal identity” refers to self-identifying as First Nations (North American Indian), Métis or Inuk (Inuit) and/or being a Registered or Treaty Indian and/or being a member of a First Nation or Indian band (See National Household Survey 2011a).
- The Employment Equity Act defines as visible minorities as “persons, other than Aboriginal persons, who are non-Caucasian in race or non-white in colour.” The visible minority population consists mainly of the following groups: South Asian, Chinese, Black, Filipino, Latin American, Arab, Southeast Asian, West Asian, Korean and Japanese (see National Household Survey 2011b).
- Information was not available on Aboriginal or visible minority status for 31% of police officers since the police service or the individual officer did not choose to report this information. In 2013, information about Aboriginal or visible minority status was more likely to be available for recruit graduates (76%) than experienced officers (69%).
- Data from the Consumer Price Index (CPI) used to calculate constant dollars are the most recent data available at the time this article was produced.
- Percent change is considered stable if it rounds to 0%.
- Percent change is considered stable if it rounds to 0%..
- Date modified: