Police-reported crime statistics in Canada, 2009
Archived Content
Information identified as archived is provided for reference, research or recordkeeping purposes. It is not subject to the Government of Canada Web Standards and has not been altered or updated since it was archived. Please "contact us" to request a format other than those available.
by Mia Dauvergne and John Turner
Corrections have been made to this product.
The publication has been reloaded on June 5, 2013.
Please take note of the following change(s):
Note to readers
Due to incorrect reporting by a police service of incidents of child pornography from 2008 to 2011, the data originally contained in this report have been suppressed and revised data were made available on July 25, 2013 with the release of 2012 crime statistics.
We regret any inconvenience this may have caused.
Police-reported crime in Canada continues to decline
Police-reported crime severity generally highest in west and north
Toronto has 3rd lowest CSI among metropolitan areas
Violent crime
Violent crime declining, but to a lesser extent than overall crime
National homicide rate stable over the past decade
Attempted murders increased 10% in 2009
Police-reported sexual assaults continue to decline
Robbery rates continue to be highest in Winnipeg
Non-violent crime
Police-reported break-ins continue to decrease
Motor vehicle thefts drop across the country
Police-reported impaired driving offences increase for the third year in a row
Drop in police-reported cocaine offences
Youth crime
Youth violent crime declining but still higher than a decade ago
Factors affecting police-reported crime statistics
Detailed data tables
References
Notes
In Canada, crime is measured using data collected by two Statistics Canada surveys: police-reported data through the Uniform Crime Reporting (UCR) Survey and victim-reported data through the General Social Survey.
This report presents findings from the 2009 UCR Survey, an annual survey of all criminal incidents known to, and substantiated by, Canadian police services. The survey collects data on about 200 individual criminal offences. These data conform to a nationally-approved set of common crime categories and definitions and have been systematically reported by police services and submitted to Statistics Canada each year since 1962. Counts for each offence are based on the most serious offence in an incident.
The report examines trends in the severity and volume of both overall and violent crime at the national, provincial/territorial and census metropolitan area levels. Changes in the rates of certain offence types, including homicide, assault, sexual offences, robbery, break and enter, motor vehicle theft, impaired driving and drug offences are presented. This report also provides information on youth crime including, for the first time, trends in the severity of crime committed by youth.
Text box 1
General Social Survey on Victimization
In addition to the police-reported Uniform Crime Reporting (UCR) Survey, Statistics Canada also conducts the General Social Survey (GSS) on victimization. This is a sample survey of Canadians aged 15 years and older that has been conducted every five years since 1988. It focuses on eight offence types: sexual assault, robbery, assault, break and enter, theft of personal property, theft of household property, theft of motor vehicles/parts and vandalism.
One of the major benefits of the GSS is that it measures the nature and extent of crime that is not reported to police which, in 2004 (the latest year of available statistics), was estimated at about two-thirds of all criminal victimizations (Gannon and Mihorean, 2005). Victimization results from the 2009 GSS will be the subject of a separate report scheduled for public release in Fall 2010.
Police-reported crime in Canada continues to decline
Both the severity and the volume of police-reported crime declined in 2009, continuing the general drop seen over the past decade (Chart 1). Canada's Crime Severity Index (CSI), a measure of the seriousness of police-reported crime, decreased 4% from 2008, and was 22% lower than in 1999 (Table 1a). The drop in crime severity over the past 10 years has occurred virtually right across the country.
Chart 1
Police-reported Crime Severity Indexes, 1999 to 2009

Note: Indexes have been standardized to a base year of 2006 which is equal to 100.
Source: Statistics Canada, Canadian Centre for Justice Statistics, Uniform Crime Reporting Survey.
The traditional crime rate, a measure of the volume of crime reported to police, also dropped in 2009, down 3% from 2008 (Table 1b). There were approximately 43,000 fewer crimes reported to police. Three property crimes accounted for the majority of this drop: 17,000 fewer motor vehicle thefts, 10,000 fewer mischief offences and 5,000 fewer break-ins (Table 2). The overall crime rate was 17% lower than a decade ago.
Text box 2
Comparing the Crime Severity Index and traditional crime rate
The traditional crime rate and the Crime Severity Index (CSI) are complementary measures of police-reported crime. The crime rate measures the volume of crime reported to the police, while the Crime Severity Index measures the seriousness of crime reported to the police.
Crime rate—Since 1962, trends in overall police-reported crime have been measured using the traditional "crime rate". This measure represents the sum of all criminal incidents (excluding traffic offences and drug offences) reported to the police, divided by the population. In this calculation, all offences are counted equally; for example, one incident of murder equals one incident of bicycle theft. The crime rate is expressed as a rate per 100,000 population. In addition to the overall crime rate, there are three sub-totals: violent, property and other Criminal Code.
Crime Severity Index—To address the issue of the overall crime rate being driven by high-volume, less-serious offences such as minor thefts, mischief and minor assaults, another measure of police-reported crime, called the Crime Severity Index, was developed and released in April 2009. For simplicity, this measure is referred to as the police-reported CSI.
In the calculation of the CSI, each offence is assigned a weight, derived from sentences handed down by criminal courts. The more serious the average sentence, the higher the weight for that offence. As a result, more serious offences have a greater impact on changes in the Index.
All offences, including traffic and drug offences, are included in the CSI. The calculation involves summing the weighted offences and dividing by the population. The CSI is then standardized to a base year of "100", which is 2006 for Canada. CSI values are available back to 1998. In addition to the overall CSI, both a violent CSI and a non-violent CSI have been created.
Youth Crime Severity Index—This year, for the first time, the concept of weighting offences according to their seriousness has been applied to youth crime data, with the release of a new Youth CSI. Youth CSI data are also available back to 1998.
For more information on the Crime Severity Index, see Wallace et al. (2009) "Measuring Crime in Canada: Introducing the Crime Severity Index and Improvements to the Uniform Crime Reporting Survey" and Babyak et al. (2009) "The methodology of the police-reported Crime Severity Index".
Police-reported crime severity generally highest in west and north
Between 2008 and 2009, crime severity declined or remained stable in all provinces and territories with the exception of small increases in Manitoba and Nunavut. The largest declines in crime severity occurred in British Columbia (-9%) and Alberta (-7%) (Table 3).
As in past years, the severity of crime reported in the north, particularly the Northwest Territories and Nunavut, was much higher than in any of the provinces in 2009 (Chart 2). One of the major contributing factors to this pattern is the relatively high rate of break-ins in these two territories.
Chart 2
Police-reported Crime Severity Indexes, by province and territory, 2009

Source: Statistics Canada, Canadian Centre for Justice Statistics, Uniform Crime Reporting Survey.
Among the provinces, Saskatchewan reported the highest CSI, despite a 2% decline in 2009. The only other provinces with a CSI above the national average were also in western Canada: Manitoba, British Columbia and Alberta. The lowest CSI values were seen in Prince Edward Island, Ontario, New Brunswick and Newfoundland and Labrador.
Toronto has 3rd lowest CSI among metropolitan areas
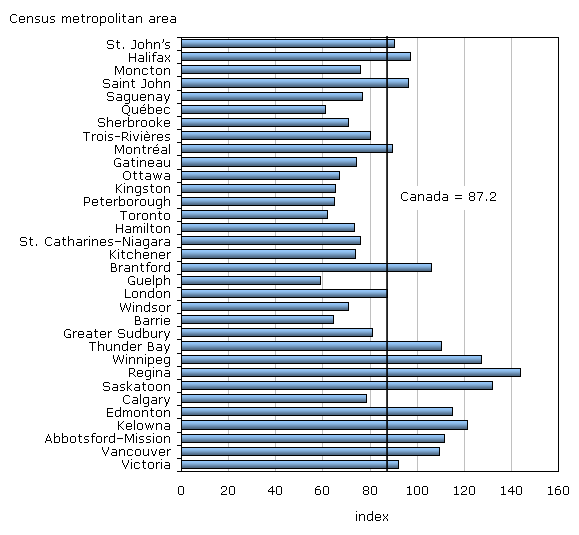
Crime severity among Canada's 33 census metropolitan areas (CMAs)1 tends to mirror the provincial pattern, with western CMAs generally reporting higher CSI values than those in the east (Table 4, Chart 3). In fact, Calgary was the only western CMA with a CSI below the national average.
Chart 3
Police-reported Crime Severity Index, by census metropolitan area, 2009
Note: The Oshawa census metropolitan area (CMA) is excluded from this table due to the incongruity between the police service jurisdictional boundaries and the CMA boundaries.
Source: Statistics Canada, Canadian Centre for Justice Statistics, Uniform Crime Reporting Survey.
Despite a 12% decrease in 2009, Regina continued to report the highest CSI, followed by Saskatoon, Winnipeg and Kelowna. Canada's largest CMA, Toronto, reported the third lowest CSI, with only Guelph and Québec reporting lower CSI values.
Although crime was down in most areas of the country, some CMAs showed increases in crime severity, the largest of which were in Saguenay (+12%), Greater Sudbury (+10%) and Kitchener (+7%). In contrast, the largest decrease was seen in Abbotsford–Mission (-22%). Large declines in break-ins and motor vehicle thefts contributed to the overall drop in Abbotsford–Mission.
Police-reported CSI values are also available for the approximately 200 police services located in areas with a central core of over 10,000 population (Statistics Canada, 2010). Among these areas, the highest CSI values were reported in North Battleford, Saskatchewan and Quesnel, British Columbia. The highest violent CSI values (to be discussed in the next section) were also in western Canada—Quesnel and Thompson, Manitoba.
The lowest CSI values were generally found in Ontario, with Tecumseh and Caledon reporting the lowest values among all 208 police services.
Violent crime
Violent crime declining, but to a lesser extent than overall crime
Both the police-reported violent Crime Severity Index and the violent crime rate declined slightly in 2009, down 1%. The violent CSI dropped for the third consecutive year, and was 6% lower than in 1999, a much smaller decline than the overall CSI drop of 22%.
In 2009, there were approximately 443,000 violent incidents, accounting for one in five offences (Table 2). While most violent crime offences declined in 2009, increases were reported in attempted murders, extortion, firearms offences, and criminal harassment.
Manitoba reported the highest violent CSI among the provinces, while the lowest violent CSI values were seen in Prince Edward Island and Newfoundland and Labrador (Table 3, Chart 2). Manitoba's violent CSI increased by 10% in 2009, primarily due to a 25% increase in robberies.
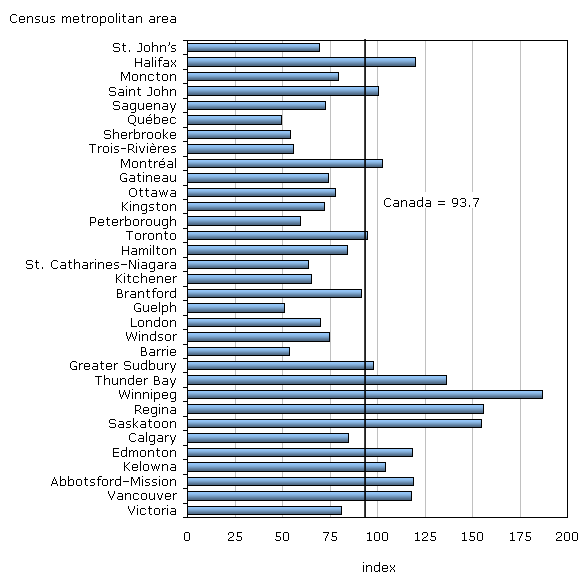
Winnipeg reported a 15% increase in violent crime severity in 2009, giving it the highest violent CSI among all CMAs (Table 4, Chart 4). Other notable increases in the severity of violent crime were reported in Greater Sudbury (+30%), Saguenay (+28%), Guelph (+21%) and Moncton (+20%). Despite increasing in 2009, Guelph still recorded the second lowest violent CSI, behind only Québec.
Chart 4
Police-reported violent Crime Severity Index, by census metropolitan area, 2009
Note: The Oshawa census metropolitan area (CMA) is excluded from this table due to the incongruity between the police service jurisdictional boundaries and the CMA boundaries.
Source: Statistics Canada, Canadian Centre for Justice Statistics, Uniform Crime Reporting Survey.
In contrast to having one of the lowest overall CSI values among CMAs, violent crime severity in Toronto (94.5) was slightly above the national average of 93.7. Violent CSI values were higher in both Vancouver (117.8) and Montréal (102.7).
National homicide rate stable over the past decade
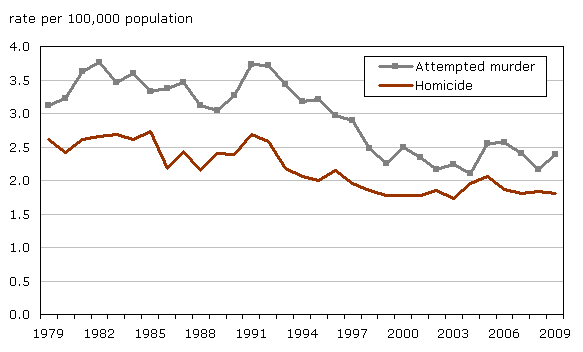
Police reported 610 homicides in 2009, 1 less than the previous year (Table 5). Despite annual fluctuations, the homicide rate has been relatively stable for the past decade (Chart 5) and well below the peak rate seen in the mid-1970s.
Chart 5
Attempted murder and homicide, police-reported rates, Canada, 1979 to 2009
Source: Statistics Canada, Canadian Centre for Justice Statistics, Uniform Crime Reporting Survey.
Alberta recorded the largest drop in the number of homicides in 2009, with 15 fewer than in 2008. The homicide rate in the province of Quebec continued to decline in 2009, reaching its lowest point in over 40 years. Similarly, the homicide rate in Montréal was at its lowest point since CMA data were first collected in 1981.
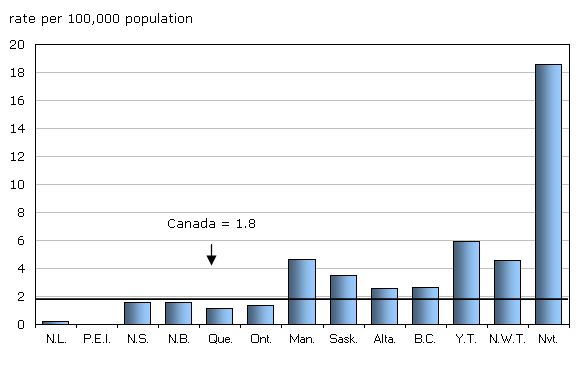
With 57 more homicides in 2009, Manitoba reported the highest homicide rate among the provinces for the third consecutive year (Chart 6). However, the largest increases in homicide in 2009 were reported in New Brunswick, up nine homicides from 2008, and Saskatchewan with an increase of six homicides. The increase in New Brunswick followed a 40-year low in 2008.
Chart 6
Homicide, police-reported rate, by province and territory, 2009
Source: Statistics Canada, Canadian Centre for Justice Statistics, Uniform Crime Reporting Survey.
With nine homicides in 2009, Abbotsford–Mission reported the highest homicide rate among all CMAs for the second year in a row. The next highest rates were reported in Thunder Bay, Winnipeg, Saguenay and Halifax. St. John's and Saint John were the only CMAs not to have a homicide in 2009 (Table 6).
Attempted murders increased 10% in 2009
Attempted murders were one of the few violent crimes to increase in 2009. Police reported 806 attempted murders, 85 more than in 2008. Although there are usually slightly more attempted murders each year than homicides, the trend in these offences is generally very similar (Chart 5).
The term "serious assault" refers to two forms of assault: assault with a weapon or causing bodily harm (level 2) and aggravated assault, whereby the victim is wounded, maimed, disfigured or whose life is endangered (level 3). Together, there were just over 57,000 such incidents reported to police in 2009 (Table 5). Following nearly 25 years of gradual increase, the rate of serious assault fell for the second year in a row in 2009, down 3% (Chart 7).
Chart 7
Serious assault (levels 2 and 3), police-reported rate, 1983 to 2009
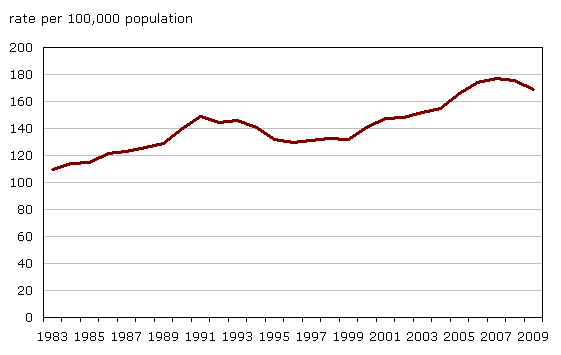
Note: Trend data begin in 1983 when legislation affecting the classification of assault came into effect.
Source: Statistics Canada, Canadian Centre for Justice Statistics, Uniform Crime Reporting Survey.
Police-reported sexual assaults continue to decline
In 2009, there were almost 21,000 sexual assaults, 98% of which were classified as level 1, the least serious form of the three levels of sexual assault. Since peaking in 1993, the rate of police-reported sexual assault has been steadily declining, including a 4% decrease in 2009 (Table 2).
It is important to note that the number of sexual assaults reported to police is likely a considerable undercount of the actual number of such offences that occur. According to self-reported victimization data from the General Social Survey, less than one in ten sexual assaults were reported to police. There are many reasons given for not reporting to police, including the belief that the incident was not important enough, that it was dealt with in some other way and that it was a private matter (Brennan and Taylor-Butts, 2008).
Police also reported about 2,600 sex offences against children, including the offences of sexual interference, invitation to sexual touching, sexual exploitation and luring a child via a computer. These figures likely under-estimate the actual number of sex offences involving children.
Robbery rates continue to be highest in Winnipeg
In 2009, police reported about 32,000 robberies in Canada, the third most common type of violent offence behind only assault and uttering threats. The rate of robbery has generally been declining since peaking in the early 1990s, including a slight drop in 2009 (Chart 8).
Chart 8
Robbery, police-reported rate, Canada, 1979 to 2009
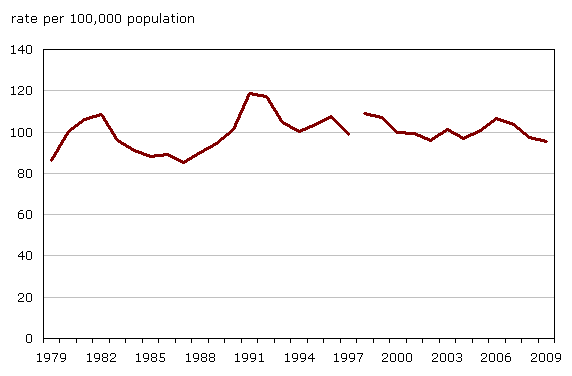
Note: Revisions have been applied to robbery data back to 1998. As a result, there is a break in the data series between 1997 and 1998.
Source: Statistics Canada, Canadian Centre for Justice Statistics, Uniform Crime Reporting Survey.
One of the major changes in robbery over the past decade has been a decrease in the use of weapons. In 2009, robberies with a firearm accounted for 15% of all robberies compared to 20% in 1999. Robberies committed with other weapons such as knives have also declined, from 36% in 1999 to 30% in 2009.
A consistently unique trend in robbery is the lower than average rates reported in the territories. Typically, crime rates, particularly violent crime rates, are higher in the territories than in the rest of Canada. However, in 2009, as in previous years, robbery rates in the Northwest Territories, Yukon and Nunavut were among the lowest in the country (Chart 9).
Chart 9
Robbery, police-reported rate, by province and territory, 2009

Source: Statistics Canada, Canadian Centre for Justice Statistics, Uniform Crime Reporting Survey.
Winnipeg continued to have the highest rate of robbery in the country, with a 26% increase in 2009. Three CMAs in Ontario also reported a sharp jump in robberies in 2009: Kingston, Guelph and Greater Sudbury all reported increases of over 30% (Table 6).
Non-violent crime
Police-reported break-ins continue to decrease
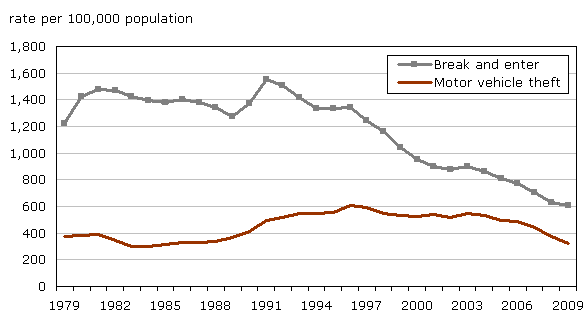
Break-ins are not only the most serious type of property crime committed in Canada, they are also one of the most common. In 2009, there were over 205,000 break-ins reported by police, accounting for 15% of all property crimes. Although break-ins continue to be prevalent, the rate has steadily dropped since peaking in the early 1990s (Chart 10). The 2009 rate was 4% lower than in 2008 and 42% lower than a decade ago (Table 2).
Chart 10
Break and enter and motor vehicle theft, police-reported rates, Canada, 1979 to 2009
Source: Statistics Canada, Canadian Centre for Justice Statistics, Uniform Crime Reporting Survey.
The decrease in break-ins may be partly explained by the existence of specialized policing programs in some communities as well as the increased use of home security devices, such as burglar alarms or motion detectors (Gannon and Taylor-Butts, 2006). It is also possible that increases in insurance deductibles have resulted in fewer incidents being reported to police (Fedorowycz, 2004).
In 2009, 60% of break-ins were to a residence, 30% were to a business location and 10% were to another location such as a shed or detached garage. Residential break-ins decreased 2% in 2009 while business break-ins declined by 9%.
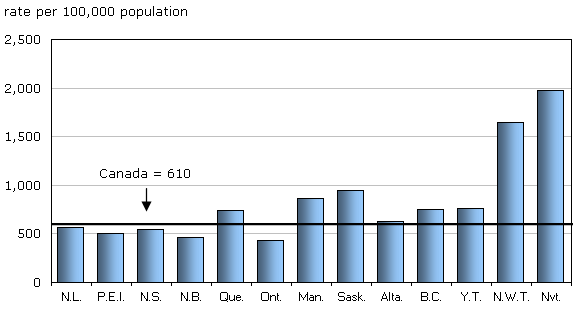
Despite a 2% decline in 2009, the rate of break-ins among the provinces was highest in Saskatchewan. The lowest rate was reported in Ontario (Chart 11).
Chart 11
Break and enter, police-reported rate, by province and territory, 2009
Source: Statistics Canada, Canadian Centre for Justice Statistics, Uniform Crime Reporting Survey.
With a 5% increase in 2009, Trois-Rivières reported the highest rate of break-ins among CMAs, while Toronto reported the lowest rate. In contrast to the national decline, some areas of the country experienced sharp increases in break-ins in 2009: Peterborough, Saguenay, Moncton and London each reported double-digit increases.
Motor vehicle thefts drop across the country
In 2009, police reported 108,000 motor vehicle thefts, an average of about 300 stolen vehicles each day. Since peaking in 1996, the rate of motor vehicle theft has been gradually declining (Chart 10). In 2009, the rate was 15% lower than the year before and 40% lower than a decade earlier (Table 2).
In 2009, the only province to report an increase in motor vehicle theft was Newfoundland and Labrador (+4%). With a 28% decrease, Manitoba reported the largest drop yet continued to report the highest rate among the provinces, slightly ahead of Saskatchewan and Alberta (Chart 12).
Chart 12
Motor vehicle theft, police-reported rate, by province and territory, 2009

Source: Statistics Canada, Canadian Centre for Justice Statistics, Uniform Crime Reporting Survey.
Part of the decrease in motor vehicle theft may be due to the increased use of anti-theft devices (such as vehicle immobilizers and car alarms), targeted initiatives such as the "bait car" program, youth prevention programs and specialized task forces to address the involvement of organized crime (Dauvergne, 2008).
Efforts to address this issue have been particularly concentrated in Winnipeg (Linden and Munn-Venn, 2008) where the rate of motor vehicle theft has been among the highest in Canada in recent years. In 2009, Winnipeg recorded its third consecutive double-digit decrease and the largest decline in the country. This latest decline resulted in Brantford surpassing Winnipeg as having the highest vehicle theft rate in the country.
The drop in vehicle thefts in 2009 was seen virtually right across the country, as only three CMAs reported an increase: Trois-Rivières, Saskatoon and Saguenay (Table 6).
Police-reported impaired driving offences increase for the third year in a row
The number of impaired driving offences reported by police can be influenced by many factors including legislative changes, enforcement practices (e.g. increased use of roadside suspensions), shifts in demographics and changing attitudes on drinking and driving (Janhevich, Gannon, and Morisset, 2003).
Police reported 89,000 impaired driving offences in 2009, resulting in a 3% increase in the rate (Table 2). This was the third consecutive annual increase. Prior to 2007, the rate of impaired driving had generally been declining for over 25 years.
Most provinces reported increases in impaired driving in 2009, with the largest seen in Prince Edward Island. Only New Brunswick reported a substantial decrease, down by 11% (Table 5).
The number of impaired driving offences reported in 2009 includes 154 incidents of impaired operation of a vehicle causing death (down from 197 in 2008) and 890 incidents of impaired operation causing bodily harm (down from 941 in 2008).
In July 2008, new legislation came into effect enabling police to conduct mandatory roadside testing and assessment of suspected drug-impaired drivers. In 2009, police reported 1,438 incidents of drug-impaired driving, accounting for about 2% of all impaired driving offences.
Drop in police-reported cocaine offences
Drug crimes, including possession, trafficking, importing, exporting and production-related offences, fall under the authority of the Controlled Drugs and Substances Act. In 2009, there were almost 98,000 drug-related offences that came to the attention of police, two-thirds of which involved cannabis.
Overall drug offences were down (-6%), due mainly to a 21% decline in the rate of cocaine offences (Chart 13). Cannabis offences were relatively stable.
Chart 13
Drug offences, police-reported rates, Canada, 1979 to 2009

Source: Statistics Canada, Canadian Centre for Justice Statistics, Uniform Crime Reporting Survey.
As in previous years, the rate of drug offences in British Columbia was well above those in the other provinces, particularly for cannabis offences (Table 5).
Youth crime
Youth and young adults commit a disproportionate amount of crime. In 2009, age-specific rates for those accused of crime were highest among 15- to 22-year-olds, with the peak age at 17 years (Chart 14). This section examines trends in crimes committed by youth, defined in the Criminal Code as 12- to 17-year-olds.
Chart 14
Persons accused of crime, by age, Canada, 2009

Source: Statistics Canada, Canadian Centre for Justice Statistics, Uniform Crime Reporting (UCR2) Survey.
Youth violent crime declining but still higher than a decade ago
In 2009, police identified nearly 165,000 youth accused of committing a crime. These included youth who were either charged (or recommended for charging) by police (42%) or dealt with by means other than the formal laying of a charge (58%). Examples of those "not charged" include youth diverted from the formal criminal justice system through the use of warnings, cautions and referrals to community programs.
This report marks the first release of a youth Crime Severity Index (CSI). Using the same concept as in the general CSI of weighting offences according to their seriousness, a youth CSI and a youth violent CSI have been created back to 1998 at the national (Table 7a) and provincial/territorial levels (Table 8).
Youth crime severity has generally been declining since 2001. The 2009 youth CSI dropped 2% from 2008 and was 7% lower than in 1999 (Chart 15). The youth violent CSI remained stable in 2009; however, it was 10% higher than a decade earlier.
Chart 15
Police-reported youth Crime Severity Indexes, Canada, 1999 to 2009

Note: Indexes have been standardized to a base year of 2006 which is equal to 100.
Source: Statistics Canada, Canadian Centre for Justice Statistics, Uniform Crime Reporting Survey.
The traditional youth crime rate, a measure of the volume of youth accused, was at virtually the same level in 2009 as it was a decade earlier (Table 7b). The youth violent crime rate was 11% higher than in 1999.
Declines were seen in the rate of youth accused for most offences in 2009, including robbery (-6%), serious assaults (-5%), break-ins (-4%) and vehicle thefts (-3%) (Table 9). However, the number of youth accused of homicide (79) increased in 2009, and was substantially higher than the average of 56 seen over the past decade.2
Factors affecting police-reported crime statistics
Many factors can influence the prevalence of police-reported crime statistics:
Demographics—changes in the age structure of the population, particularly for high-risk (15-24) and low-risk (over 50) offender groups can influence crime rates.
Public reporting rates to police—changes in societal responses and perceptions of certain crimes (such as sexual assault or spousal violence) can lead to differences in reporting rates to police.
Local police policies and procedures—some police services maintain call centres to receive and record criminal incidents, while others require victims to report crimes in person. The ease of public reporting can impact whether a criminal incident becomes known to police and subsequently reported to Statistics Canada through the UCR Survey. Also, internal police records management systems (RMS) and processes can impact on whether or not a criminal incident is entered into the local RMS.
Legislative changes—changes to the criminal justice system, such as the introduction of a new offence, can impact the number of police-reported criminal incidents.
Social and economic factors—various social and economic factors can influence crime statistics. For example, a study examining patterns in crime data found that shifts in inflation were associated with changes in financially-motivated crimes (namely robbery, break and enter and motor vehicle theft) and that alcohol consumption and unemployment rates were correlated with homicide rates (Pottie-Bunge, Johnson and Baldé, 2005). Other studies have found an association between neighbourhood crime rates and access to socio-economic resources (Charron, 2009;Savoie, 2008).
Technological change—with continuing advances in technology, opportunities for new, more complex crimes have developed.
Detailed data tables
Table 1a Police-reported Crime Severity Indexes, Canada, 1999 to 2009
Table 1b Police-reported crime rate, Canada, 1999 to 2009
Table 2 Police-reported crime for selected offences, Canada, 2008 and 2009
Table 3 Police-reported Crime Severity Indexes, by province and territory, 2009
Table 4 Police-reported Crime Severity Indexes, by census metropolitan area, 2009
Table 5 Police-reported crime for selected offences, by province and territory, 2009
Table 6 Police-reported crime for selected offences, by census metropolitan area, 2009
Table 7a Police-reported youth Crime Severity Indexes, Canada, 1999 to 2009
Table 7b Youth accused of police-reported crime, Canada, 1999 to 2009
Table 8 Police-reported youth Crime Severity Indexes, by province and territory, 2009
Table 9 Police-reported youth crime for selected offences, by province and territory, 2009
References
Babyak, Colin, Asma Alavi, Krista Collins, Amanda Halladay, Dawn Tapper. 2009. "The methodology of the police-reported Crime Severity Index". Statistics Canada, Household Surveys Methods Division. HSMD-2009-006E/F. Ottawa.
Brennan, Shannon and Andrea Taylor-Butts. 2008. "Sexual assault in Canada, 2004 and 2007". Canadian Centre for Justice Statistics Profile Series. Statistics Canada. Catalogue no. 85F0033M–No. 19. Ottawa.
/pub/85f0033m/85f0033m2008019-eng.htm (accessed on June 6, 2010).
Charron, Mathieu. 2009. "Neighbourhood characteristics and the distribution of police-reported crime in the city of Toronto". Crime and Justice Research Paper Series. Statistics Canada Catalogue no. 85-561-MIE–No. 18. Ottawa.
/pub/85-561-m/85-561-m2009018-eng.htm (accessed on June 6, 2010).
Dauvergne, Mia. 2008. "Motor vehicle theft in Canada, 2007". Juristat. Statistics Canada, Canadian Centre for Justice Statistics. Catalogue no. 85-002-X, Vol. 28, no. 10. Ottawa.
/pub/85-002-x/2008010/article/10744-eng.htm
(accessed on June 6, 2010).
Fedorowycz, Orest. 2004. "Breaking and entering in Canada–2002." Juristat. Catalogue no. 85-002-XIE. Vol. 24, no. 5. Statistics Canada. Ottawa.
/pub/85-002-x/85-002-x2004005-eng.pdf (accessed on June 6, 2010).
Gannon, Maire and Karen Mihorean. 2005. "Criminal Victimization in Canada, 2004". Juristat. Statistics Canada, Canadian Centre for Justice Statistics. Catalogue no. 85-002-XPE, Vol. 25, no. 7. Ottawa.
/pub/85-002-x/85-002-x2005007-eng.pdf (accessed on June 6, 2010).
Gannon, Maire and Andrea Taylor-Butts. 2006. "Canadians' use of crime prevention measures, 2004." Canadian Centre for Justice Statistics Profile Series. Statistics Canada Catalogue no. 85F0033MIE–No. 12. Ottawa.
/pub/85f0033m/85f0033m2006012-eng.htm (accessed on June 6, 2010).
Janhevich, Derek, Maire Gannon, and Nicolas Morisset. 2003. "Impaired driving and other traffic offences, 2002". Juristat. Statistics Canada, Canadian Centre for Justice Statistics. Catalogue no. 85-002-XIE, Vol. 23, no. 9. Ottawa.
/pub/85-002-x/85-002-x2003009-eng.pdf (accessed on June 6, 2010).
Linden, Rick and Trefor Munn-Venn. 2008. "Making Communities Safer: Lessons Learned Combating Auto Theft in Winnipeg". Conference Board of Canada, National Security and Public Safety. Ottawa.
Pottie-Bunge, Valerie, Holly Johnson and Thierno Baldé. 2005. "Exploring crime patterns in Canada". Crime and Justice Research Paper Series. Statistics Canada Catalogue no. 85-561-MIE–No. 5. Ottawa.
/pub/85-561-m/85-561-m2005005-eng.htm (accessed on June 6, 2010).
Savoie, Josée. 2008. "Neighbourhood characteristics and the distribution of crime: Edmonton, Halifax and Thunder Bay." Crime and Justice Research Paper Series. Statistics Canada Catalogue no. 85-561-MIE–No. 10. Ottawa.
/pub/85-561-m/85-561-m2008010-eng.htm (accessed on June 6, 2010).
Statistics Canada. 2010. "Crime Severity Index values for 208 police services policing communities over 10,000 population, 2009". July 20, 2010.
/pub/85-002-x/2010002/article/11292/tbl/csivalue-igcvaleurs-eng.htm (accessed on July 20, 2010).
Wallace, Marnie, John Turner, Colin Babyak and Anthony Matarazzo. 2009. "Measuring crime in Canada: Introducing the Crime Severity Index and improvements to the Uniform Crime Reporting survey". Statistics Canada Catalogue no. 85-004-X. Ottawa.
/pub/85-004-x/85-004-x2009001-eng.htm (accessed on June 6, 2010).
Notes
- A census metropolitan area (CMA) consists of one or more neighbouring municipalities situated around a central core. A CMA must have a total population of at least 100,000 of which 50,000 or more live in the central core. To be included in the CMA, other adjacent municipalities must have a high degree of integration with the central core, as measured by commuting flows derived from census data. A CMA typically comprises more than one police service.
- Includes one youth under the age of 12 years.
- Date modified:
