
Knives and violent crime in Canada, 2008

Archived Content
Information identified as archived is provided for reference, research or recordkeeping purposes. It is not subject to the Government of Canada Web Standards and has not been altered or updated since it was archived. Please "contact us" to request a format other than those available.
by Mia Dauvergne
Knives most common weapon used to commit violent crime
Use of knives to commit violent crime stable
Three in ten homicides committed with a knife
Youth and young adults account for half of all persons accused of violent crime with a knife
Summary
Detailed data tables
References
Notes
In 2008, several fatal stabbings sparked extensive media attention about knife violence in Canada (CBC News, 2008; Giroday and Hitchen, 2008; Henry, 2008). Bill C-393 was also proposed that year, legislation that aimed to increase the severity of penalties for crimes committed with a concealed weapon, including a knife. Shortly after reaching second reading, however, Parliament was prorogued and the Bill expired.1
This Juristat article examines Canadian trends in police-reported violent crime committed with knives, with a particular focus on the period from 1999 to 2008. Data are drawn from the Uniform Crime Reporting (UCR) Survey and the Homicide Survey which collect information on crimes that have been reported to, and substantiated by, police services from across the country.
Knives most common weapon used to commit violent crime
In Canada, most crimes reported by police do not involve violence. Furthermore, among those crimes that are classified as violent, most are committed with physical force or threats (76%) rather than with a weapon (18%). When a weapon is used, however, a knife is the most common type.
In 2008, a knife was used against 6% of all victims of a violent crime. Included in this category are other cutting instruments such as broken bottles, screwdrivers or scissors.2 In comparison, 3% of violent crimes were committed with a club or blunt instrument and 2% with a firearm.
In 2008, police reported almost 23,500 victims of a violent crime with a knife (Table 1).3 Homicides and attempted murders had the highest proportion of incidents involving knives, at about one-third.
Use of knives to commit violent crime stable
For most violent crimes, police-reported trend data on the use of weapons is only available from a subset of police services beginning in 1999.4 These data show that the trend in the rate of violent crime committed with a knife has remained relatively stable since 1999 (Chart 1).
Chart 1
Victims of violent crime, by select weapon, 1999 to 2008
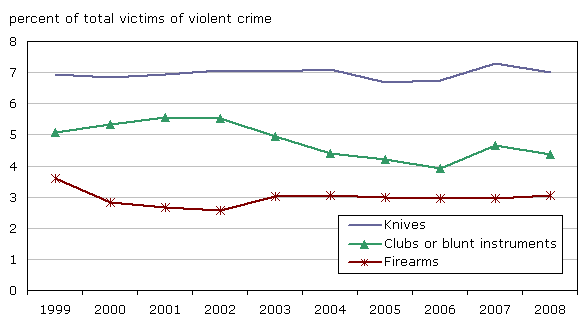
Note: Data reflect victim counts from the UCR2 survey (Trend database) and represent 54% of the population of Canada. Data are not nationally representative. The 2008 data do not match the information presented elsewhere in this report due to differences in coverage.
Source: Statistics Canada, Canadian Centre for Justice Statistics, Uniform Crime Reporting (UCR Trend) Survey.
The trend in knife-related crime over the past decade has been driven by assault, the highest volume knife-related crime. The proportions of attempted murder, sexual assault and robbery committed with a knife have each decreased slightly, while homicides have increased.
Geographically, the rates of violent crime with a knife tend to mirror those for violent crime in general. In order to identify areas of the country where knives are used more frequently than other weapons, the remainder of this section examines the proportion of all violent crime in which knives are used.
The highest proportions of knife-related violence in 2008 were in the Prairie provinces (Chart 2), driven largely by the census metropolitan areas (CMAs) of Winnipeg, Regina and Edmonton (Chart 3).5 Conversely, lower proportions of knife violence were in eastern and central Canada, most notably in Kingston and Saguenay.
Chart 2
Victims of violent crime committed with knives, by province or territory, 2008

Note: Coverage for each province/territory exceeds 95% except for British Columbia (92%).
Source: Statistics Canada, Canadian Centre for Justice Statistics, Uniform Crime Reporting (UCR2) Survey.
Chart 3
Victims of violent crime committed with knives, by census metropolitan area, 2008
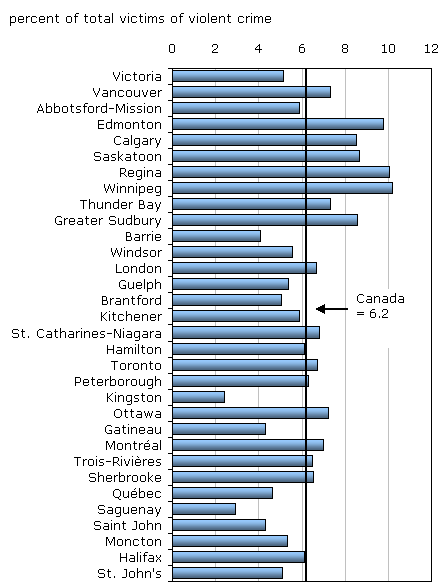
Note: Coverage for each CMA is virtually 100% except for the following: Winnipeg (99%), Saskatoon (99%), Brantford (95%), Windsor (91%), Toronto (91%), Hamilton (75%) and Barrie (70%). Excludes the CMAs of Oshawa and Kelowna.
Source: Statistics Canada, Canadian Centre for Justice Statistics, Uniform Crime Reporting (UCR2) Survey.
There is some variation across the country with respect to the use of knives to commit certain types of violent crime. For example, St. John's, and consequently Newfoundland and Labrador, stood out as having the highest proportion of robberies committed with a knife (Table 2, Table 3).6 Toronto, on the other hand, reported one of the lowest proportions of knife-related robbery in 2008. Robberies in Toronto more often involved a firearm (18%) than a knife (12%).
Three in ten homicides committed with a knife
Homicide data are unique in that detailed information on the use of weapons, including knives and firearms, is available for all homicides from 1974 onward. These longer-term trend data show that the proportion of homicides with knives has remained close to 30% since 1985.7 When looking only at the past 10 years, the use of knives to commit homicide has increased, up from 27% in 1999 to 34% in 2008.
Prior to 1985, firearms were used most often to commit homicide. Since then, however, the most common cause of death has varied between stabbings and shootings (Chart 4). In 2008, there were 200 victims stabbed to death, the same number of victims killed with a firearm.
Chart 4
Homicides with knives and firearms, Canada, 1974 to 2008
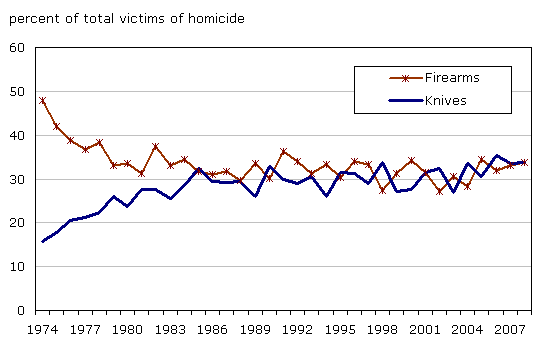
Note: Data reflect victim counts from the Homicide survey and represent 100% of the national volume of homicides.
Source: Statistics Canada, Canadian Centre for Justice Statistics, Homicide Survey.
The geographical pattern in the use of knives to commit homicide is similar to that for other types of violent crimes. Between 1999 and 2008, the proportion of homicides committed with a knife was highest in Saskatchewan and lowest in Prince Edward Island (Table 4). At the CMA level, more than half of all homicides in Oshawa, Saskatoon, Regina and Trois-Rivières were committed with a knife (Table 5).8
Among Canada's larger cities, Calgary and Edmonton had the highest proportions of knife-related homicides, at 4 in 10. Other large cities, namely, Vancouver, Ottawa and Toronto, were among those cities with the lowest proportions of homicides committed with a knife.
Of all knife-related homicides between 1999 and 2008, about half (49%) occurred between acquaintances, most commonly during the course of an argument. Family members committed another 35% of stabbings and strangers the remaining 16%.
Gang-related homicides are less likely than homicides in general to be committed with knives. Between 1999 and 2008, most gang-related homicides were committed with a firearm (73%) rather than a knife (16%).
Youth and young adults account for half of all persons accused of violent crime with a knife
In general, violent crime is disproportionately committed by youth and young adults. This finding is particularly true with respect to violent crime committed with knives. In 2008, those 12 to 24 years of age accounted for half (50%) of all persons accused of a violent crime committed with a knife. In comparison, persons in this age group represented 39% of those accused of committing non-knife-related violent crimes.
In general, as people age, their use of knives to commit violent crime decreases (Chart 5). In 2008, 7% of those aged 12 to 17 years and 18 to 24 years who were accused of committing a violent offence had used a knife. In comparison, a knife was used by 5% of 25 to 34 year-olds, 5% of 35 to 44 year-olds, 4% of those 45 to 54 year-olds and 3% of those 55 years or older.
Chart 5
Persons accused of violent crime committed with knives, by age group, Canada, 2008
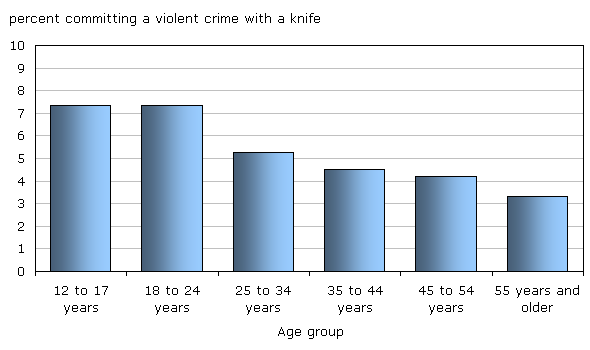
Note: Data reflect accused counts from the UCR2 survey and represent 98% of the population of Canada.
Source: Statistics Canada, Canadian Centre for Justice Statistics, Uniform Crime Reporting (UCR2) Survey.
The higher incidence of knife use by youth and young adults may also be related to what has been termed the "substitution effect". Youth and young adults may use knives instead of other weapons, such as firearms, because they are readily accessible and more easily concealed.
In general, males are responsible for committing about 8 in 10 violent crimes involving knives, about the same proportion of violent crime in general. This finding has been consistent for a decade.
Summary
In Canada, about 6% of all violent crimes are committed with a knife or other piercing or cutting instrument. Attempted murder and homicide involve knives more often than other offences, although the volume of such crimes is relatively low. The use of knives to commit violent crime tends to be highest in the western part of the country where overall violent crime was also highest. Half of all those accused of violent crime with a knife are youth and young adults, higher than the proportion of violent crime that does not involve a knife.
Detailed data tables
Table 1 Victims of violent crime committed with a knife, 2008
Table 4 Homicides by selected type of weapon, by province or territory, 1999 to 2008
Table 5 Homicides by selected type of weapon, by census metropolitan area, 1999 to 2008
References
Beattie, Sara. 2009. "Homicide in Canada, 2008." Juristat.Vol. 29, no. 4.
Statistics Canada Catalogue no. 85-002-X.
www.statcan.gc.ca/pub/85-002-x/85-002-x2009004-eng.htm
(accessed January 19, 2010.
CBC
News. May 31, 2008. "Vigil held for Calgary murder-suicide victims".
www.cbc.ca/canada/story/2008/05/31/calgary-deaths.html
(accessed January 19, 2010.
Dauvergne, Mia. 2010. "Police-reported robbery in Canada, 2008." Juristat.Vol. 30, no. 1. Statistics Canada Catalogue no. 85-002-X.
www.statcan.gc.ca/pub/85-002-x/85-002-x2010001-eng.htm
(accessed March 25, 2010).
Giroday Gabrielle and Ian Hitchen. July 31, 2008. "Man stabbed, beheaded on Greyhound bus by apparent stranger." The National Post. Canwest News Service.
www.nationalpost.com/news/story.html?id=692762
(accessed January 17, 2010).
Henry, Michelle. November 24, 2008. "Killer, 66, stabbed his family to death." The Star. Toronto edition.
www.thestar.com/News/GTA/article/542228 (accessed January 16, 2010).
Notes
- For further information on Bill C-393 An Act to amend the Criminal Code and the Corrections and Conditional Release Act (punishment and hearing) see: www2.parl.gc.ca/Sites/LOP/LEGISINFO/index.asp?Language=E&query=5834&List=toc&Session=22
- For the remainder of this report, the term "knife" includes other piercing or cutting instruments.
- The 2008 data are based upon information reported by police services covering 98% of the population of Canada.
- Incident-based trend data are reported by a subset of police services that have been consistently reporting to the UCR Survey since 1999. In 2008, these police services covered 54% of the population of Canada and are not nationally representative.
- Coverage for each province/territory exceeds 95% except for British Columbia (92%). Coverage for each CMA is virtually 100% except for the following: Winnipeg (99%), Saskatoon (99%), Brantford (95%), Windsor (91%), Toronto (91%), Hamilton (75%) and Barrie (70%).
- For further information on trends in robbery see: Dauvergne, Mia. "Police-reported robbery in Canada, 2008". Juristat. Statistics Canada catalogue no. 85-002-X. March 2010. Vol. 30, no. 1.
- For further information on trends in homicide see: Beattie, Sara. "Homicide in Canada, 2008". Juristat. Statistics Canada catalogue no. 85-002-X. October 2009. Vol. 29, no. 4.
- While the proportion of knife-related homicides is higher in Brantford and Moncton, these data are based upon only three years of information as these areas became CMAs in 2006.
- Date modified: